


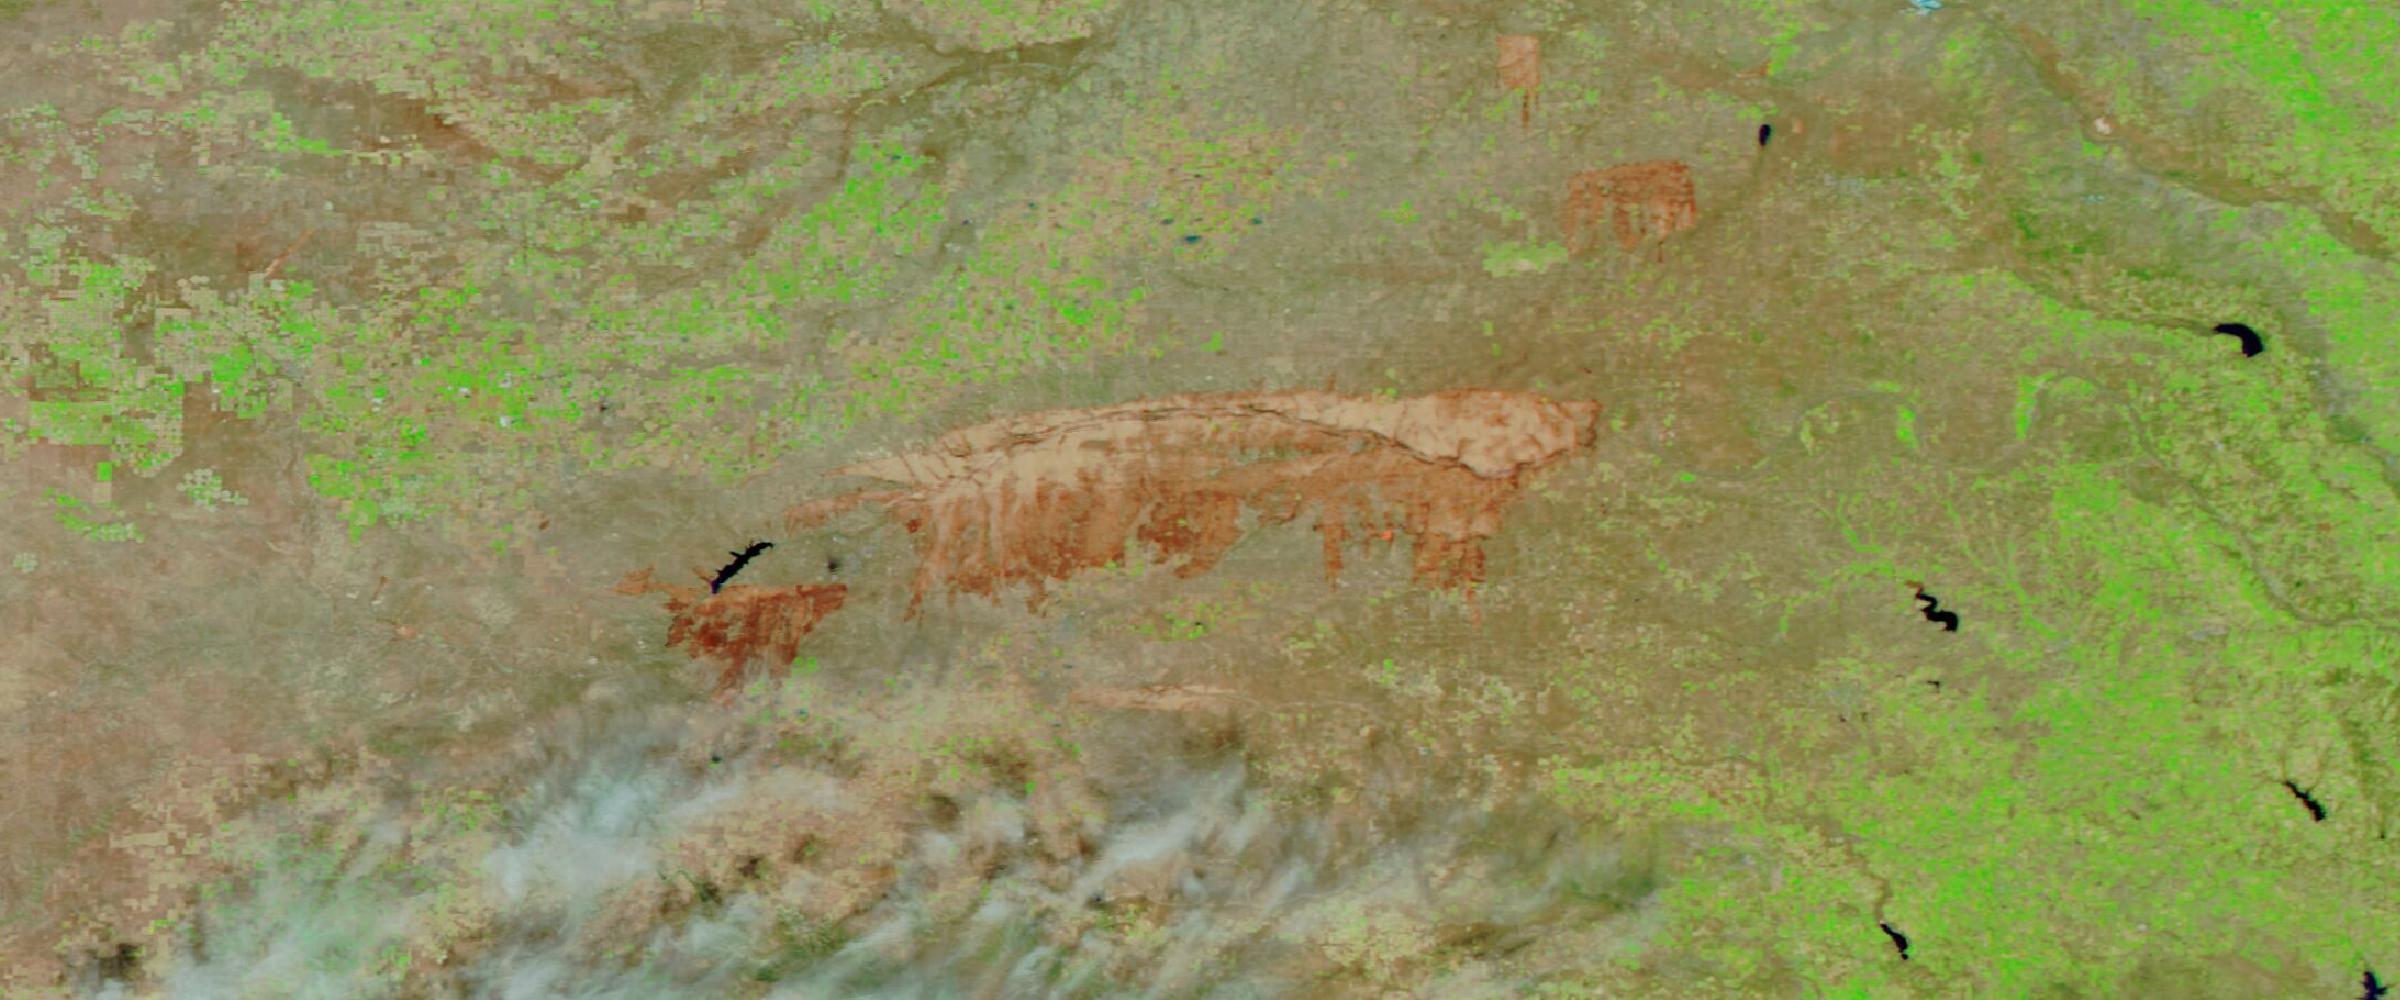
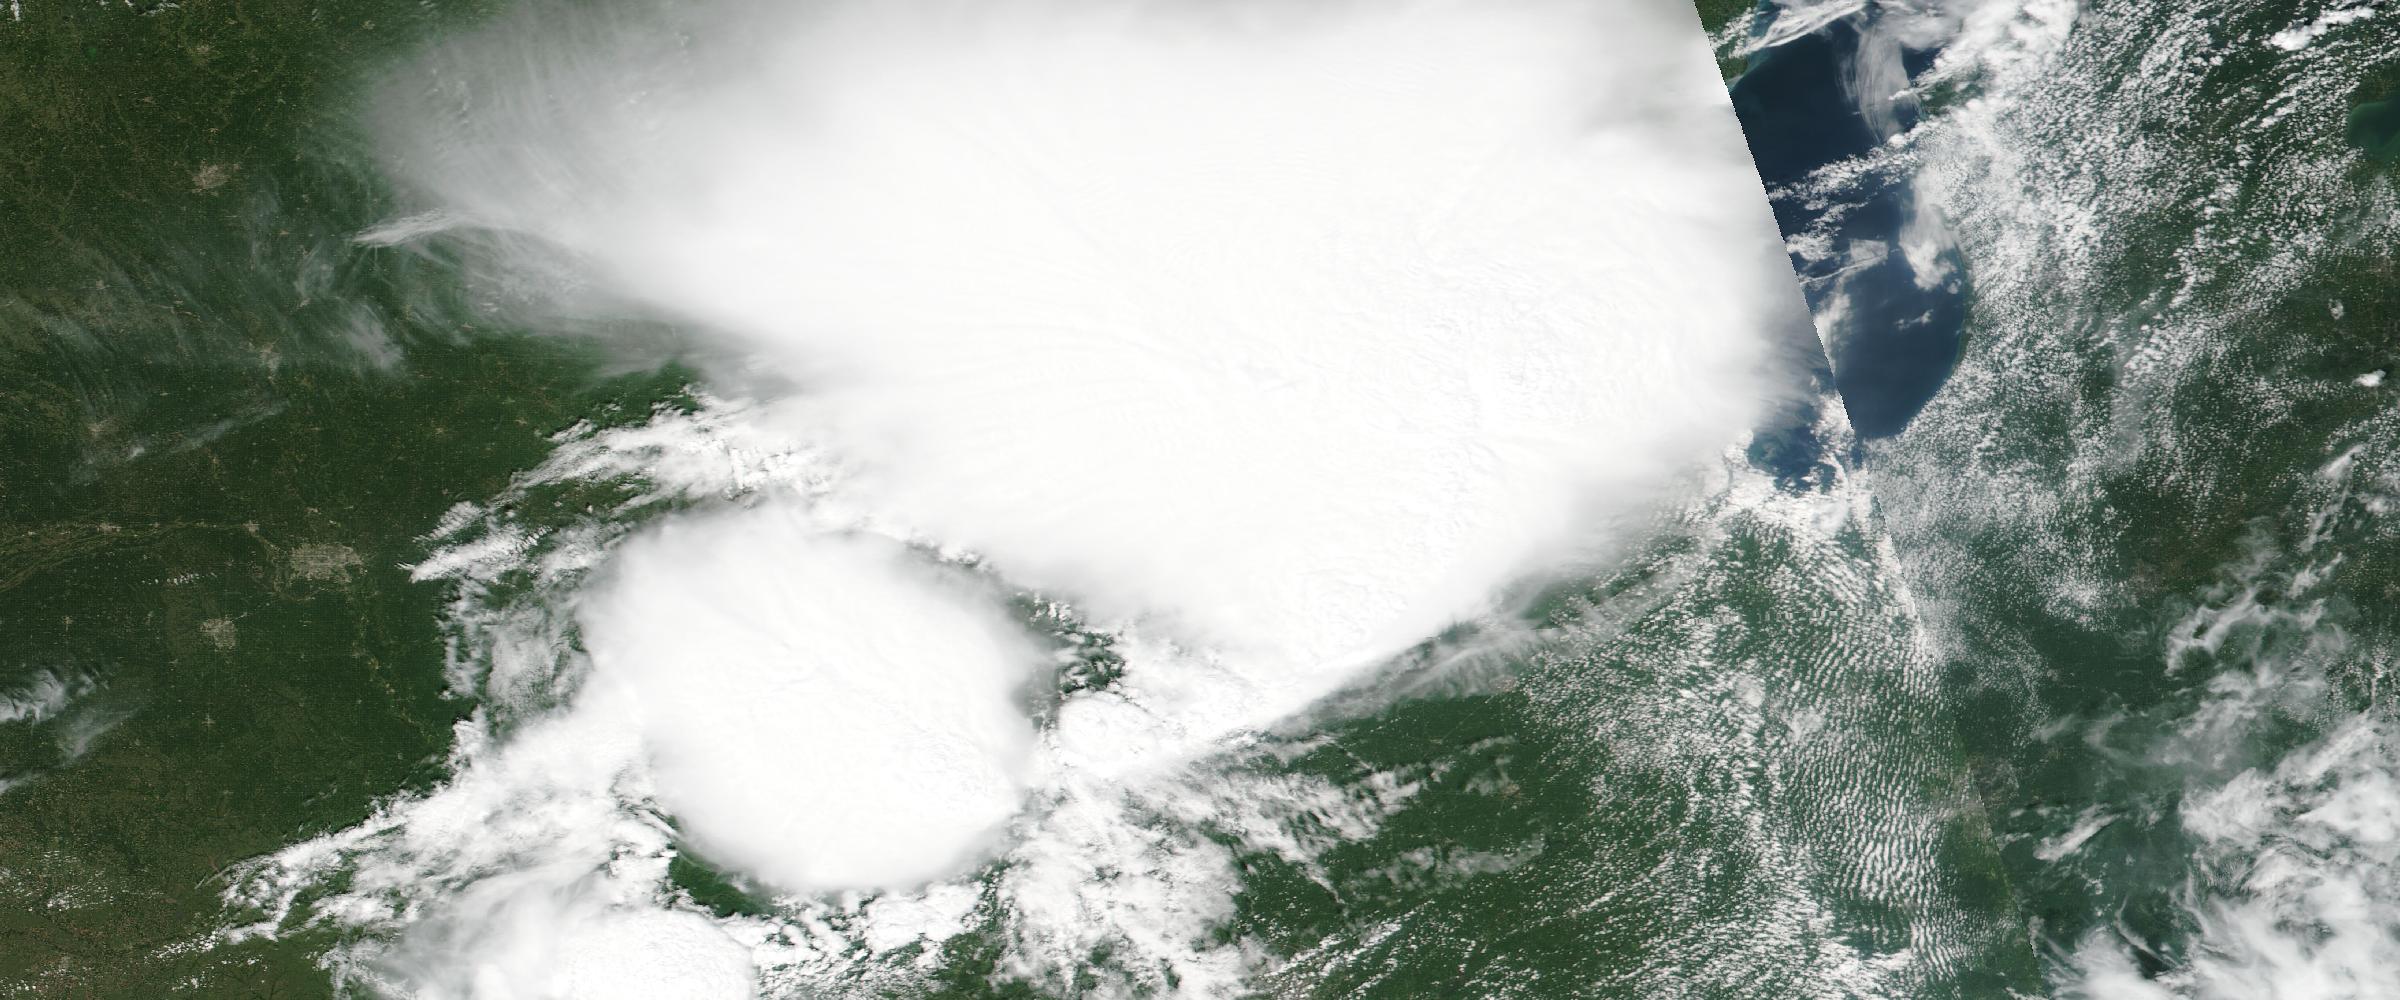
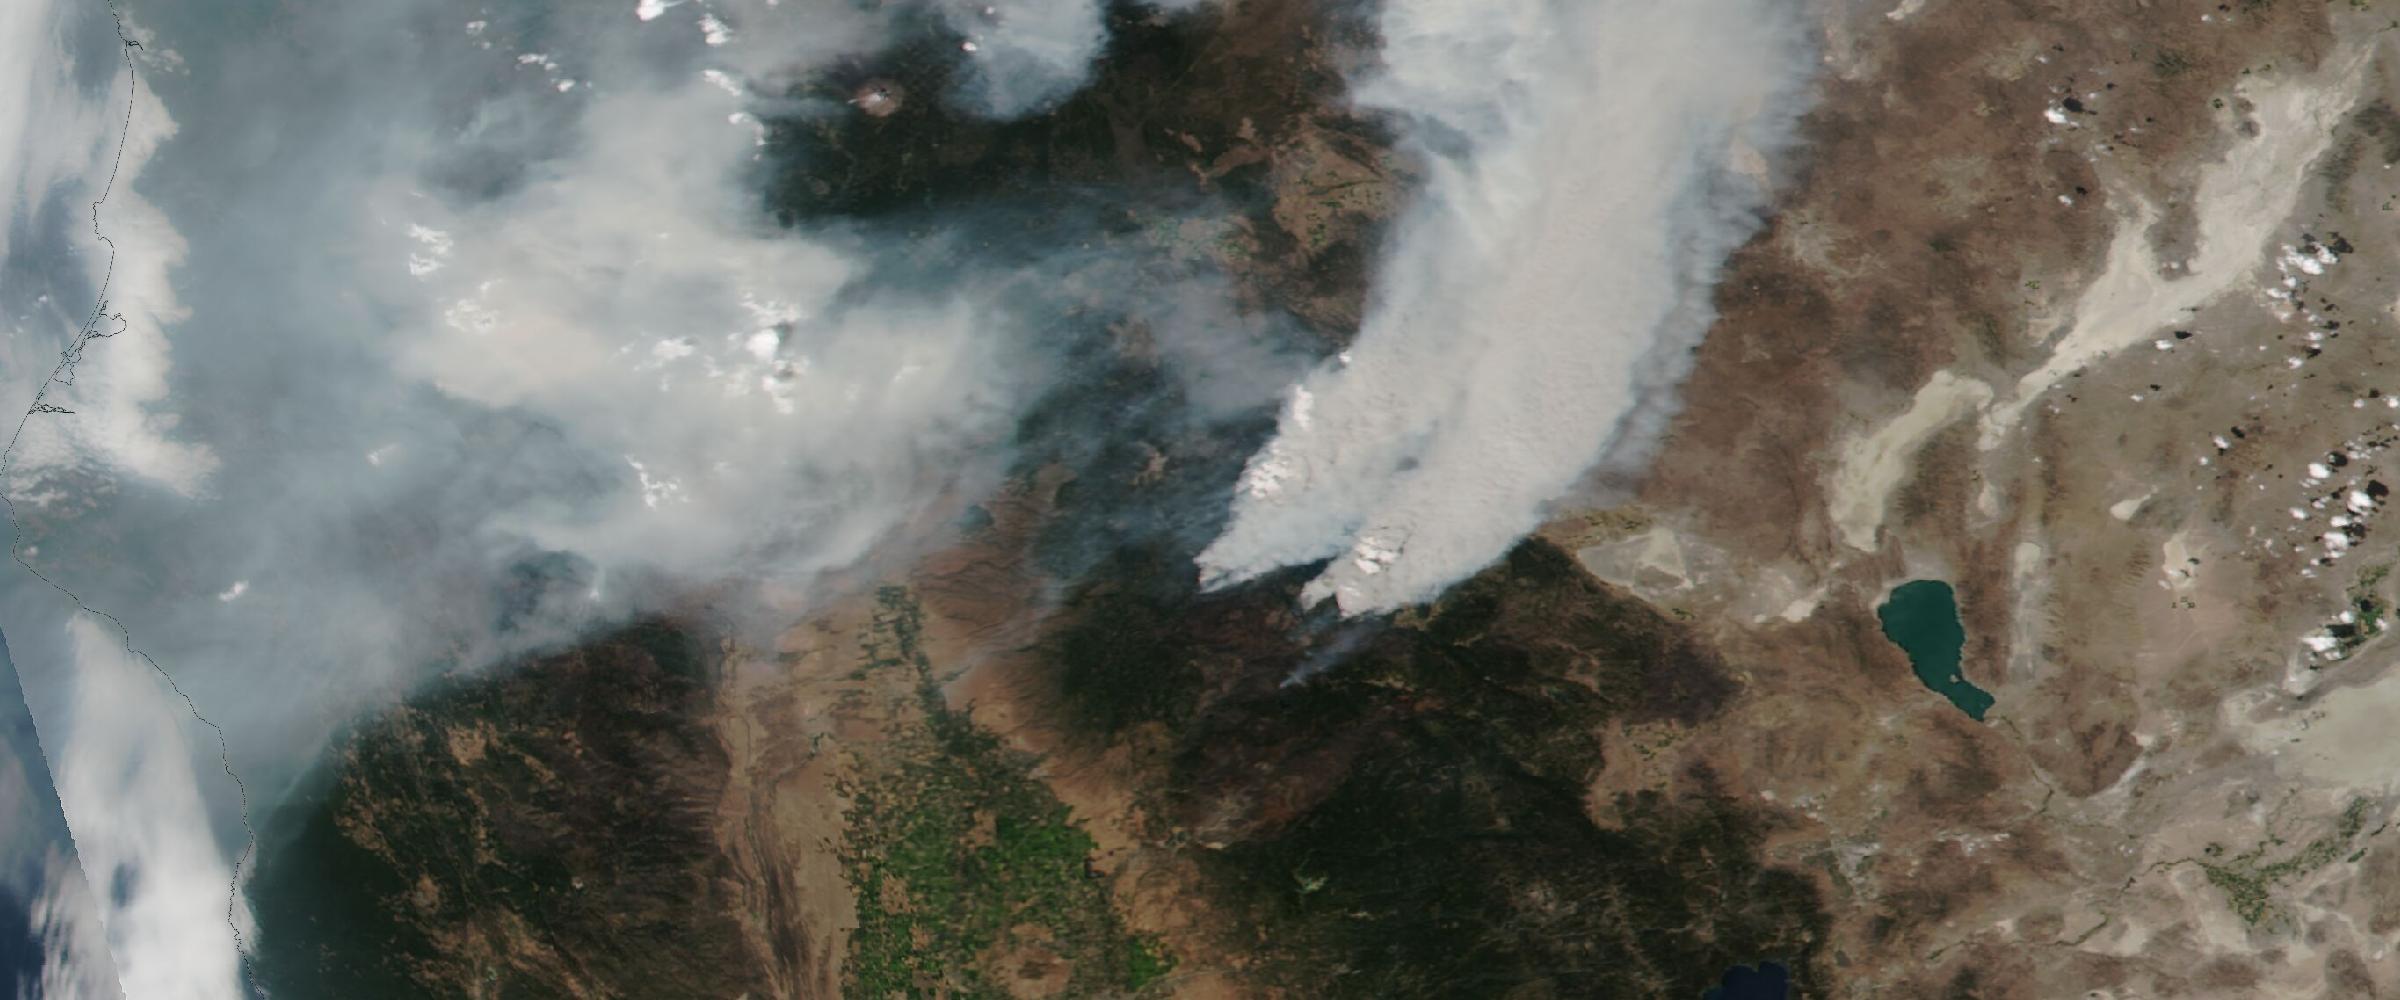
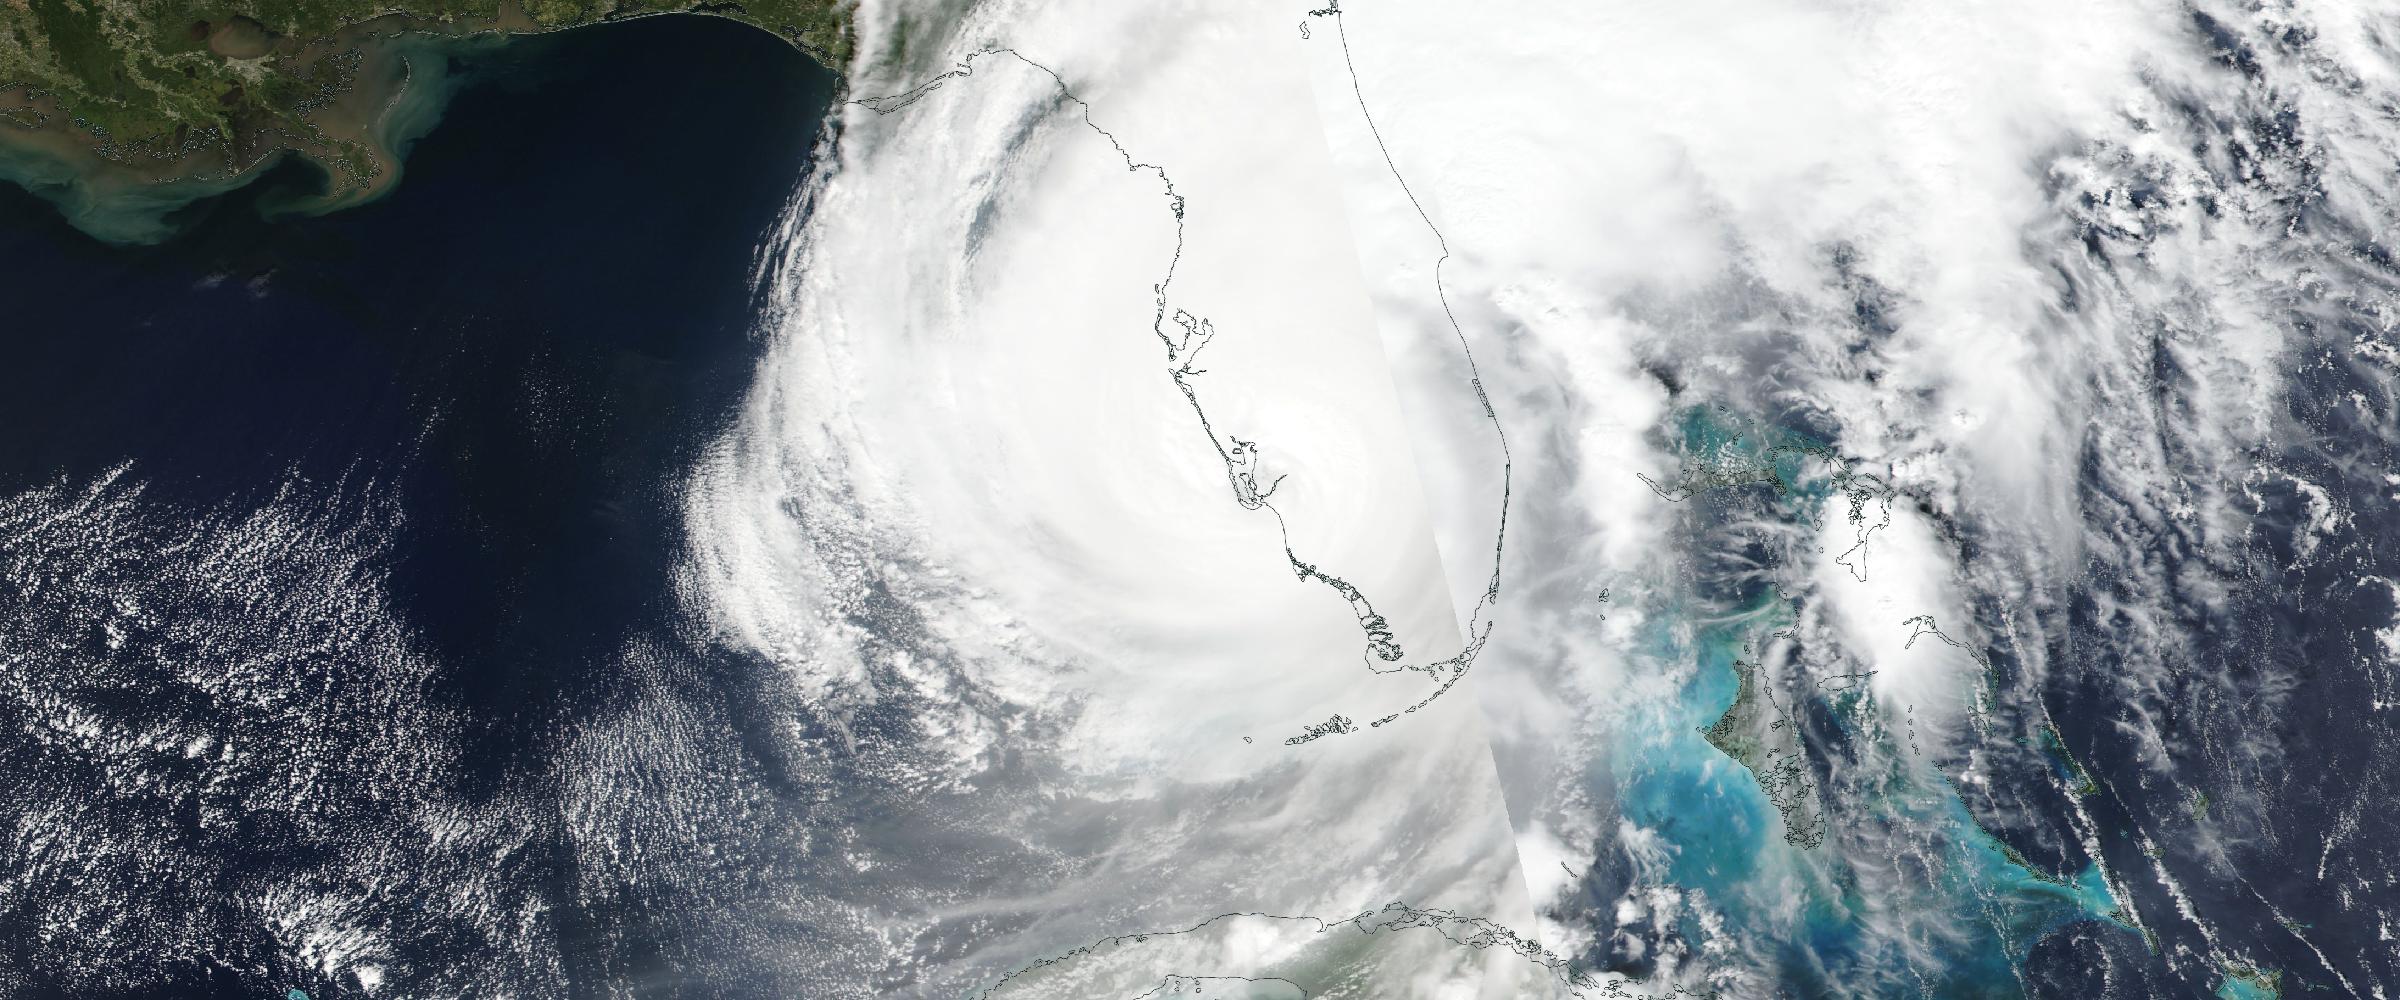
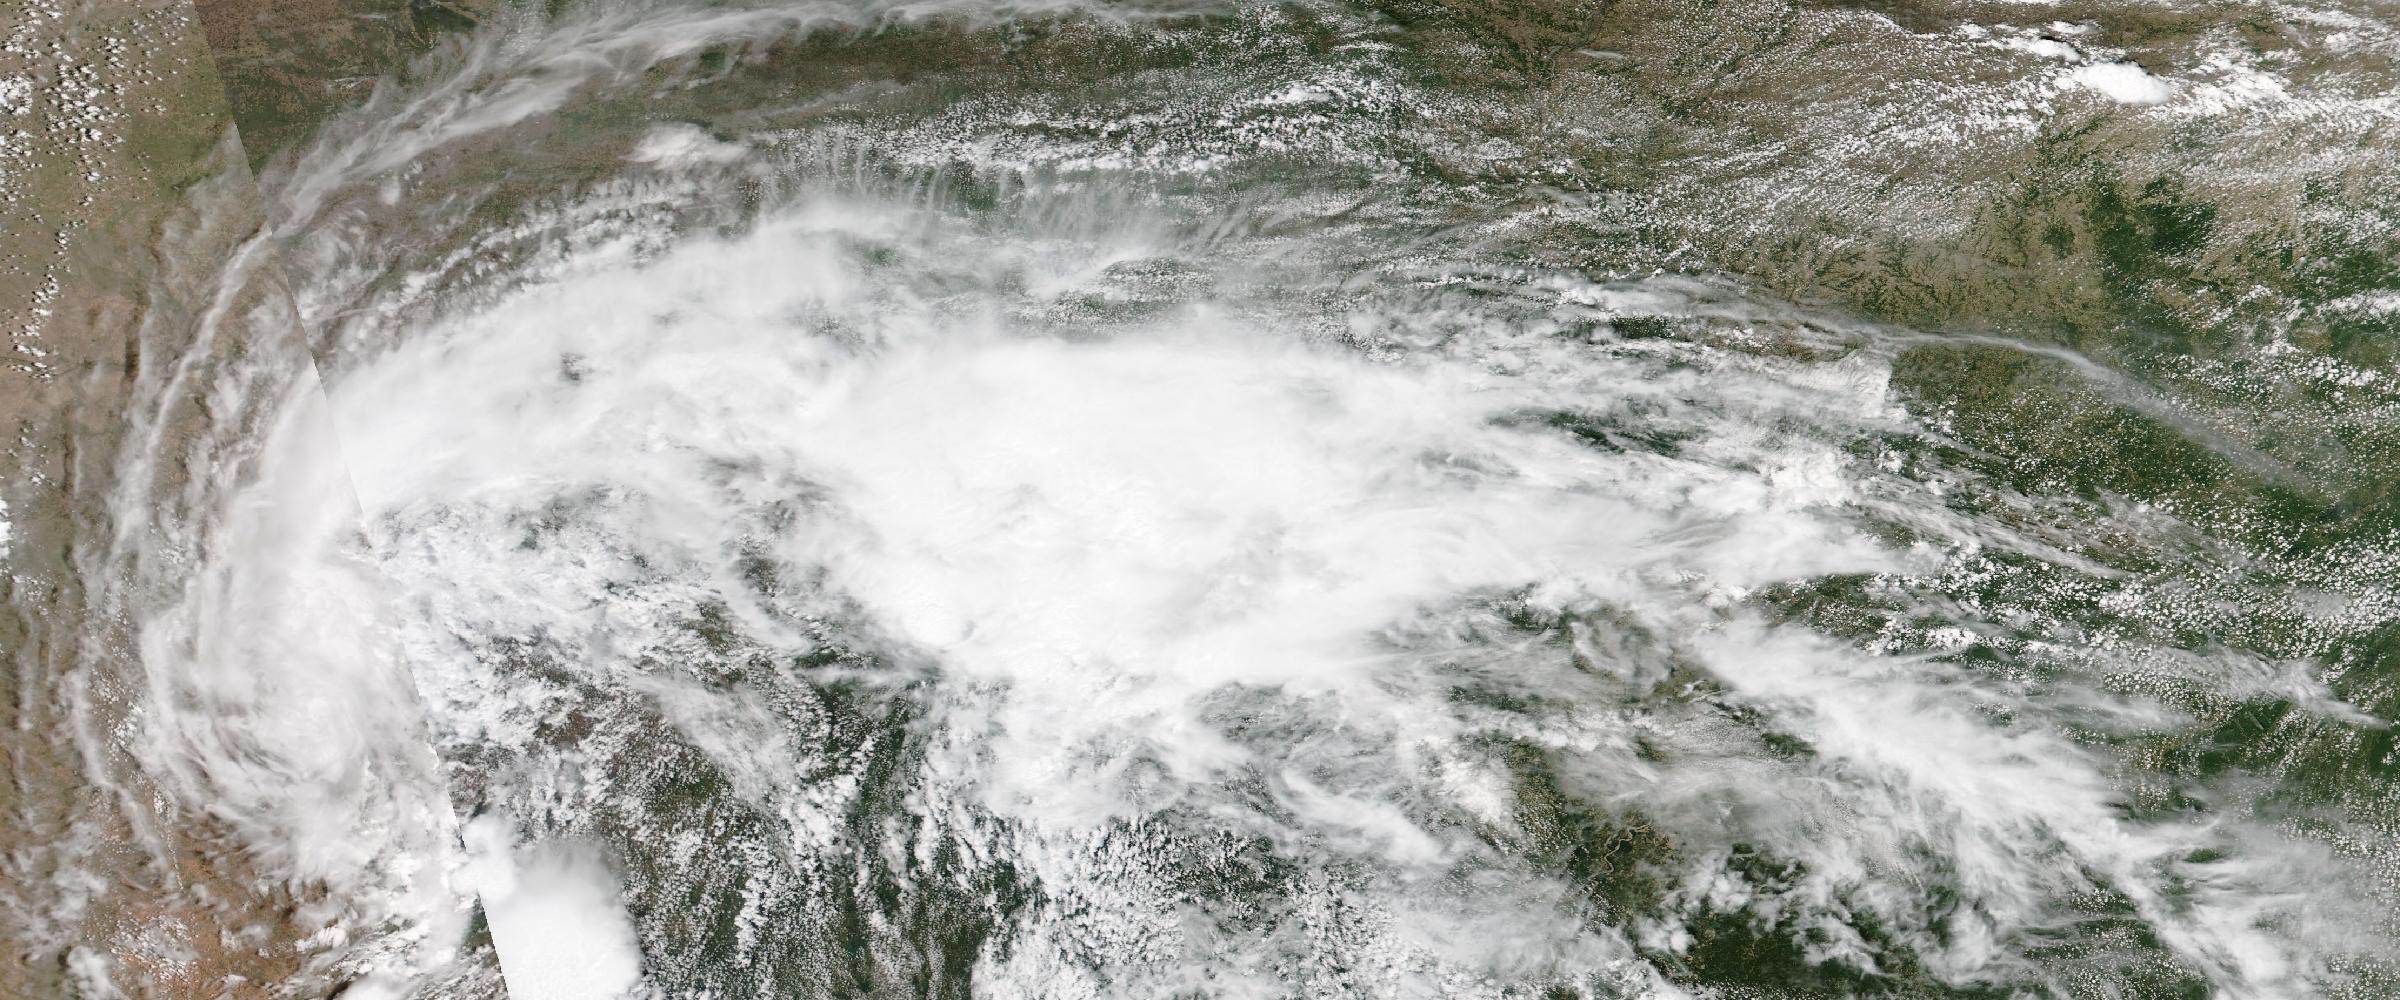
For reinsurers, understanding a catastrophe starts with understanding where the hazard actually occurred. A hurricane can cover hundreds of miles. A wildfire can expand rapidly across a changing perimeter. A tornado can create a narrow path through a much smaller geographic area, while hail can affect scattered locations across a broad storm system.
The shape, size, location, and characteristics of that affected area matter because they determine which insured locations may have been exposed to the event.
This is where hazard footprints become particularly valuable.
A hazard footprint provides a geographic representation of an event that can be compared against exposure data, allowing reinsurers to move from a broad question - Did a catastrophe occur? - to a much more specific one: Which parts of our portfolio were actually inside the affected area?
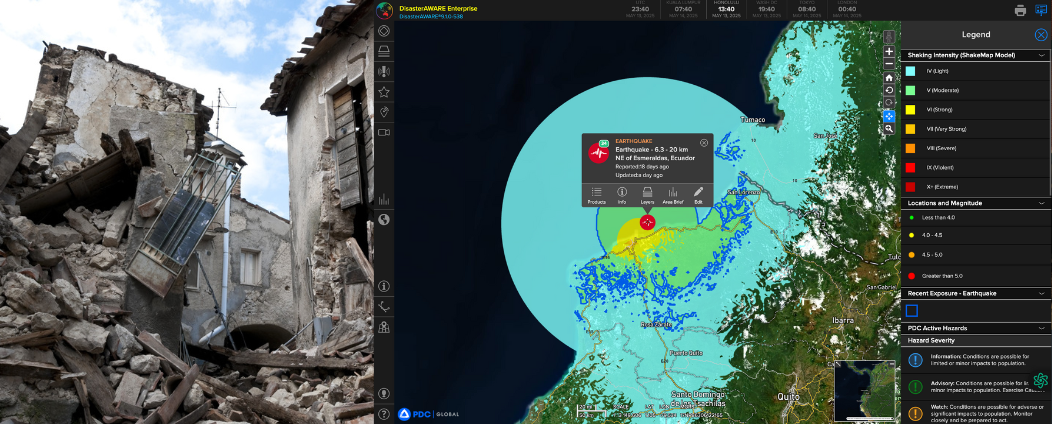
A hazard footprint is a geographic representation of the area affected by a specific natural hazard event. Depending on the peril, it might represent:
A footprint can also contain additional information about the event, such as intensity, severity, depth, duration, or other characteristics.
That distinction is important. A simple polygon showing that an area was affected is useful. A footprint that also describes how the hazard varied across that area can provide considerably more information for exposure analysis.
Reinsurance portfolios can contain enormous numbers of insured locations distributed across multiple geographies and cedents.
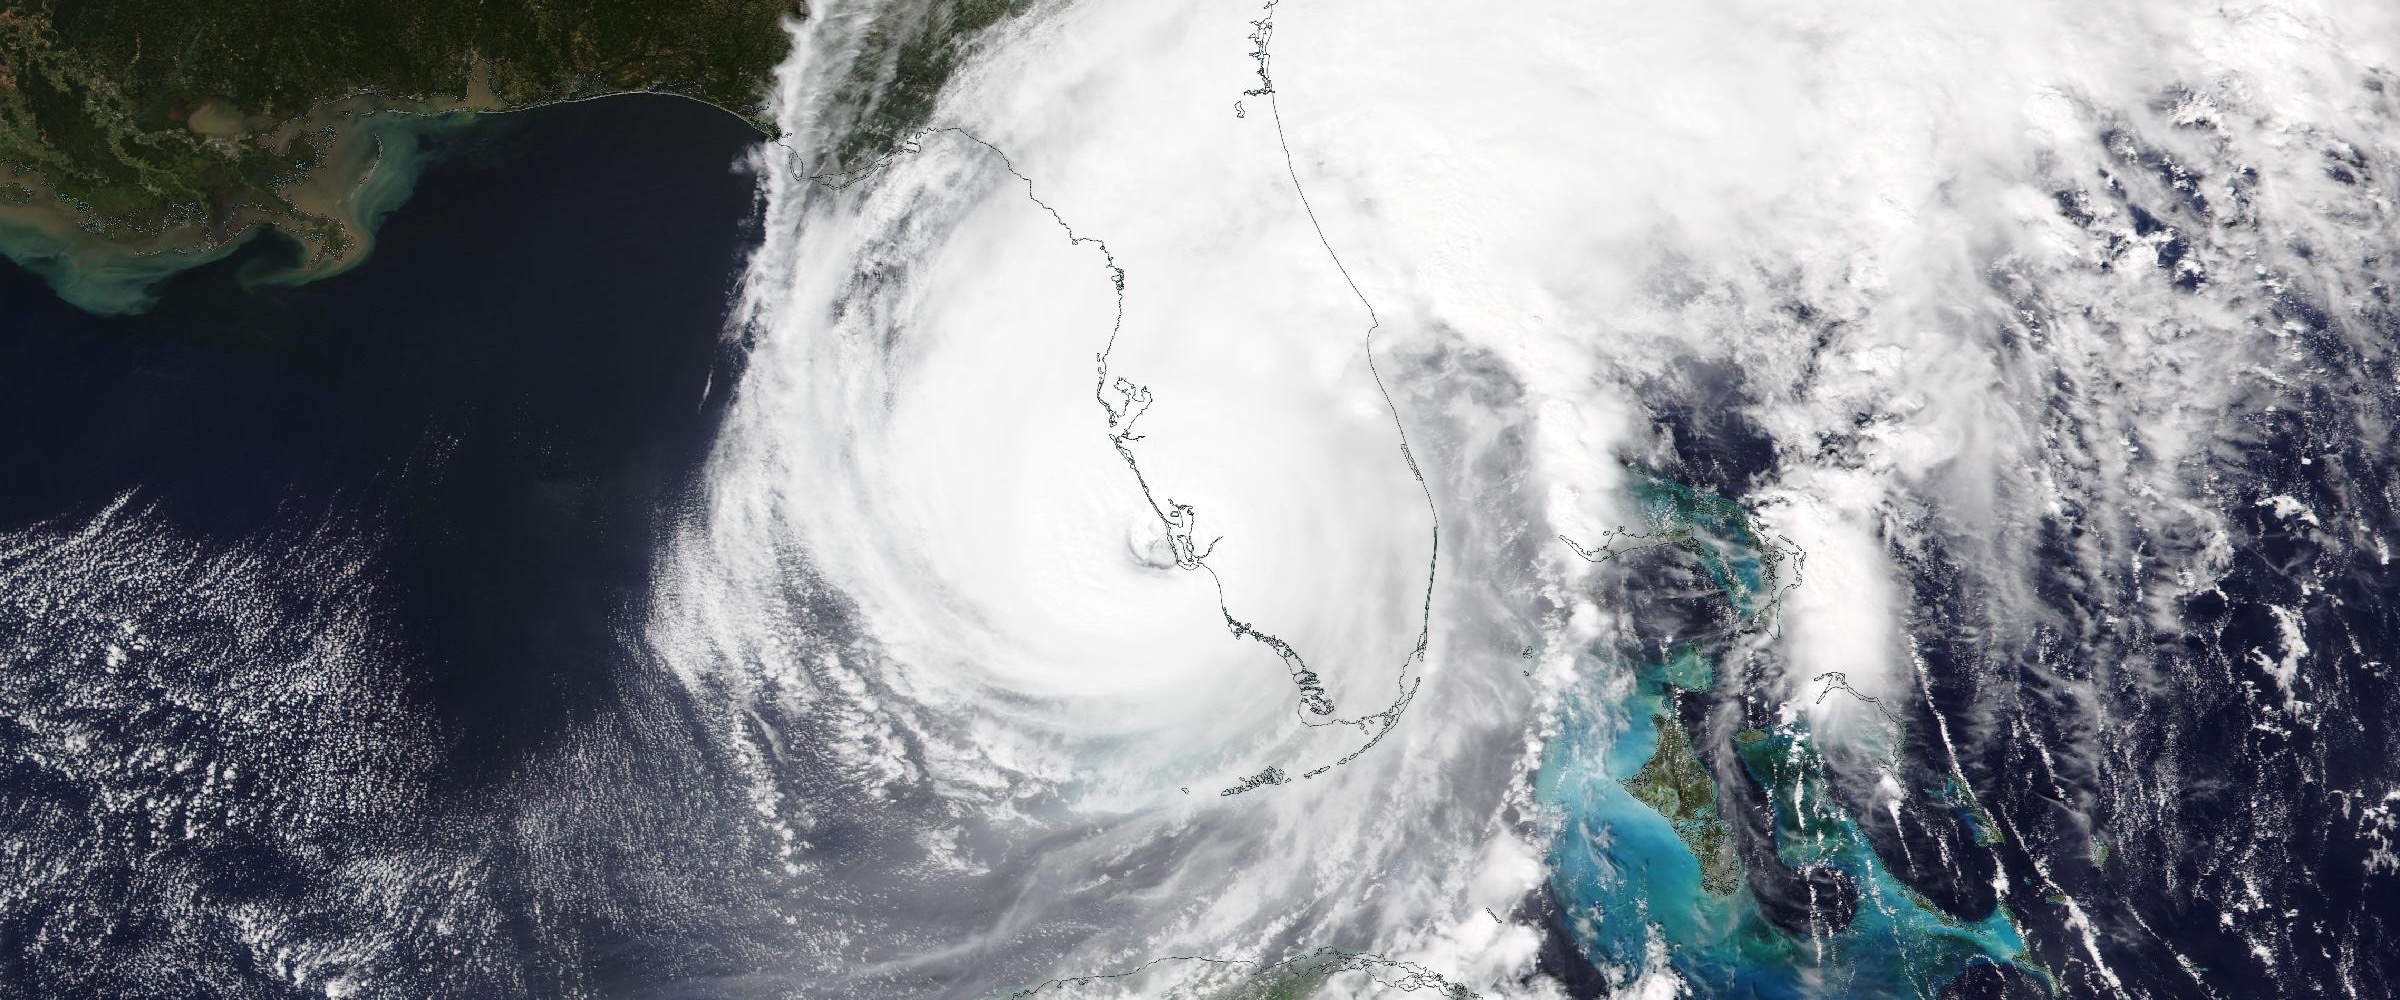
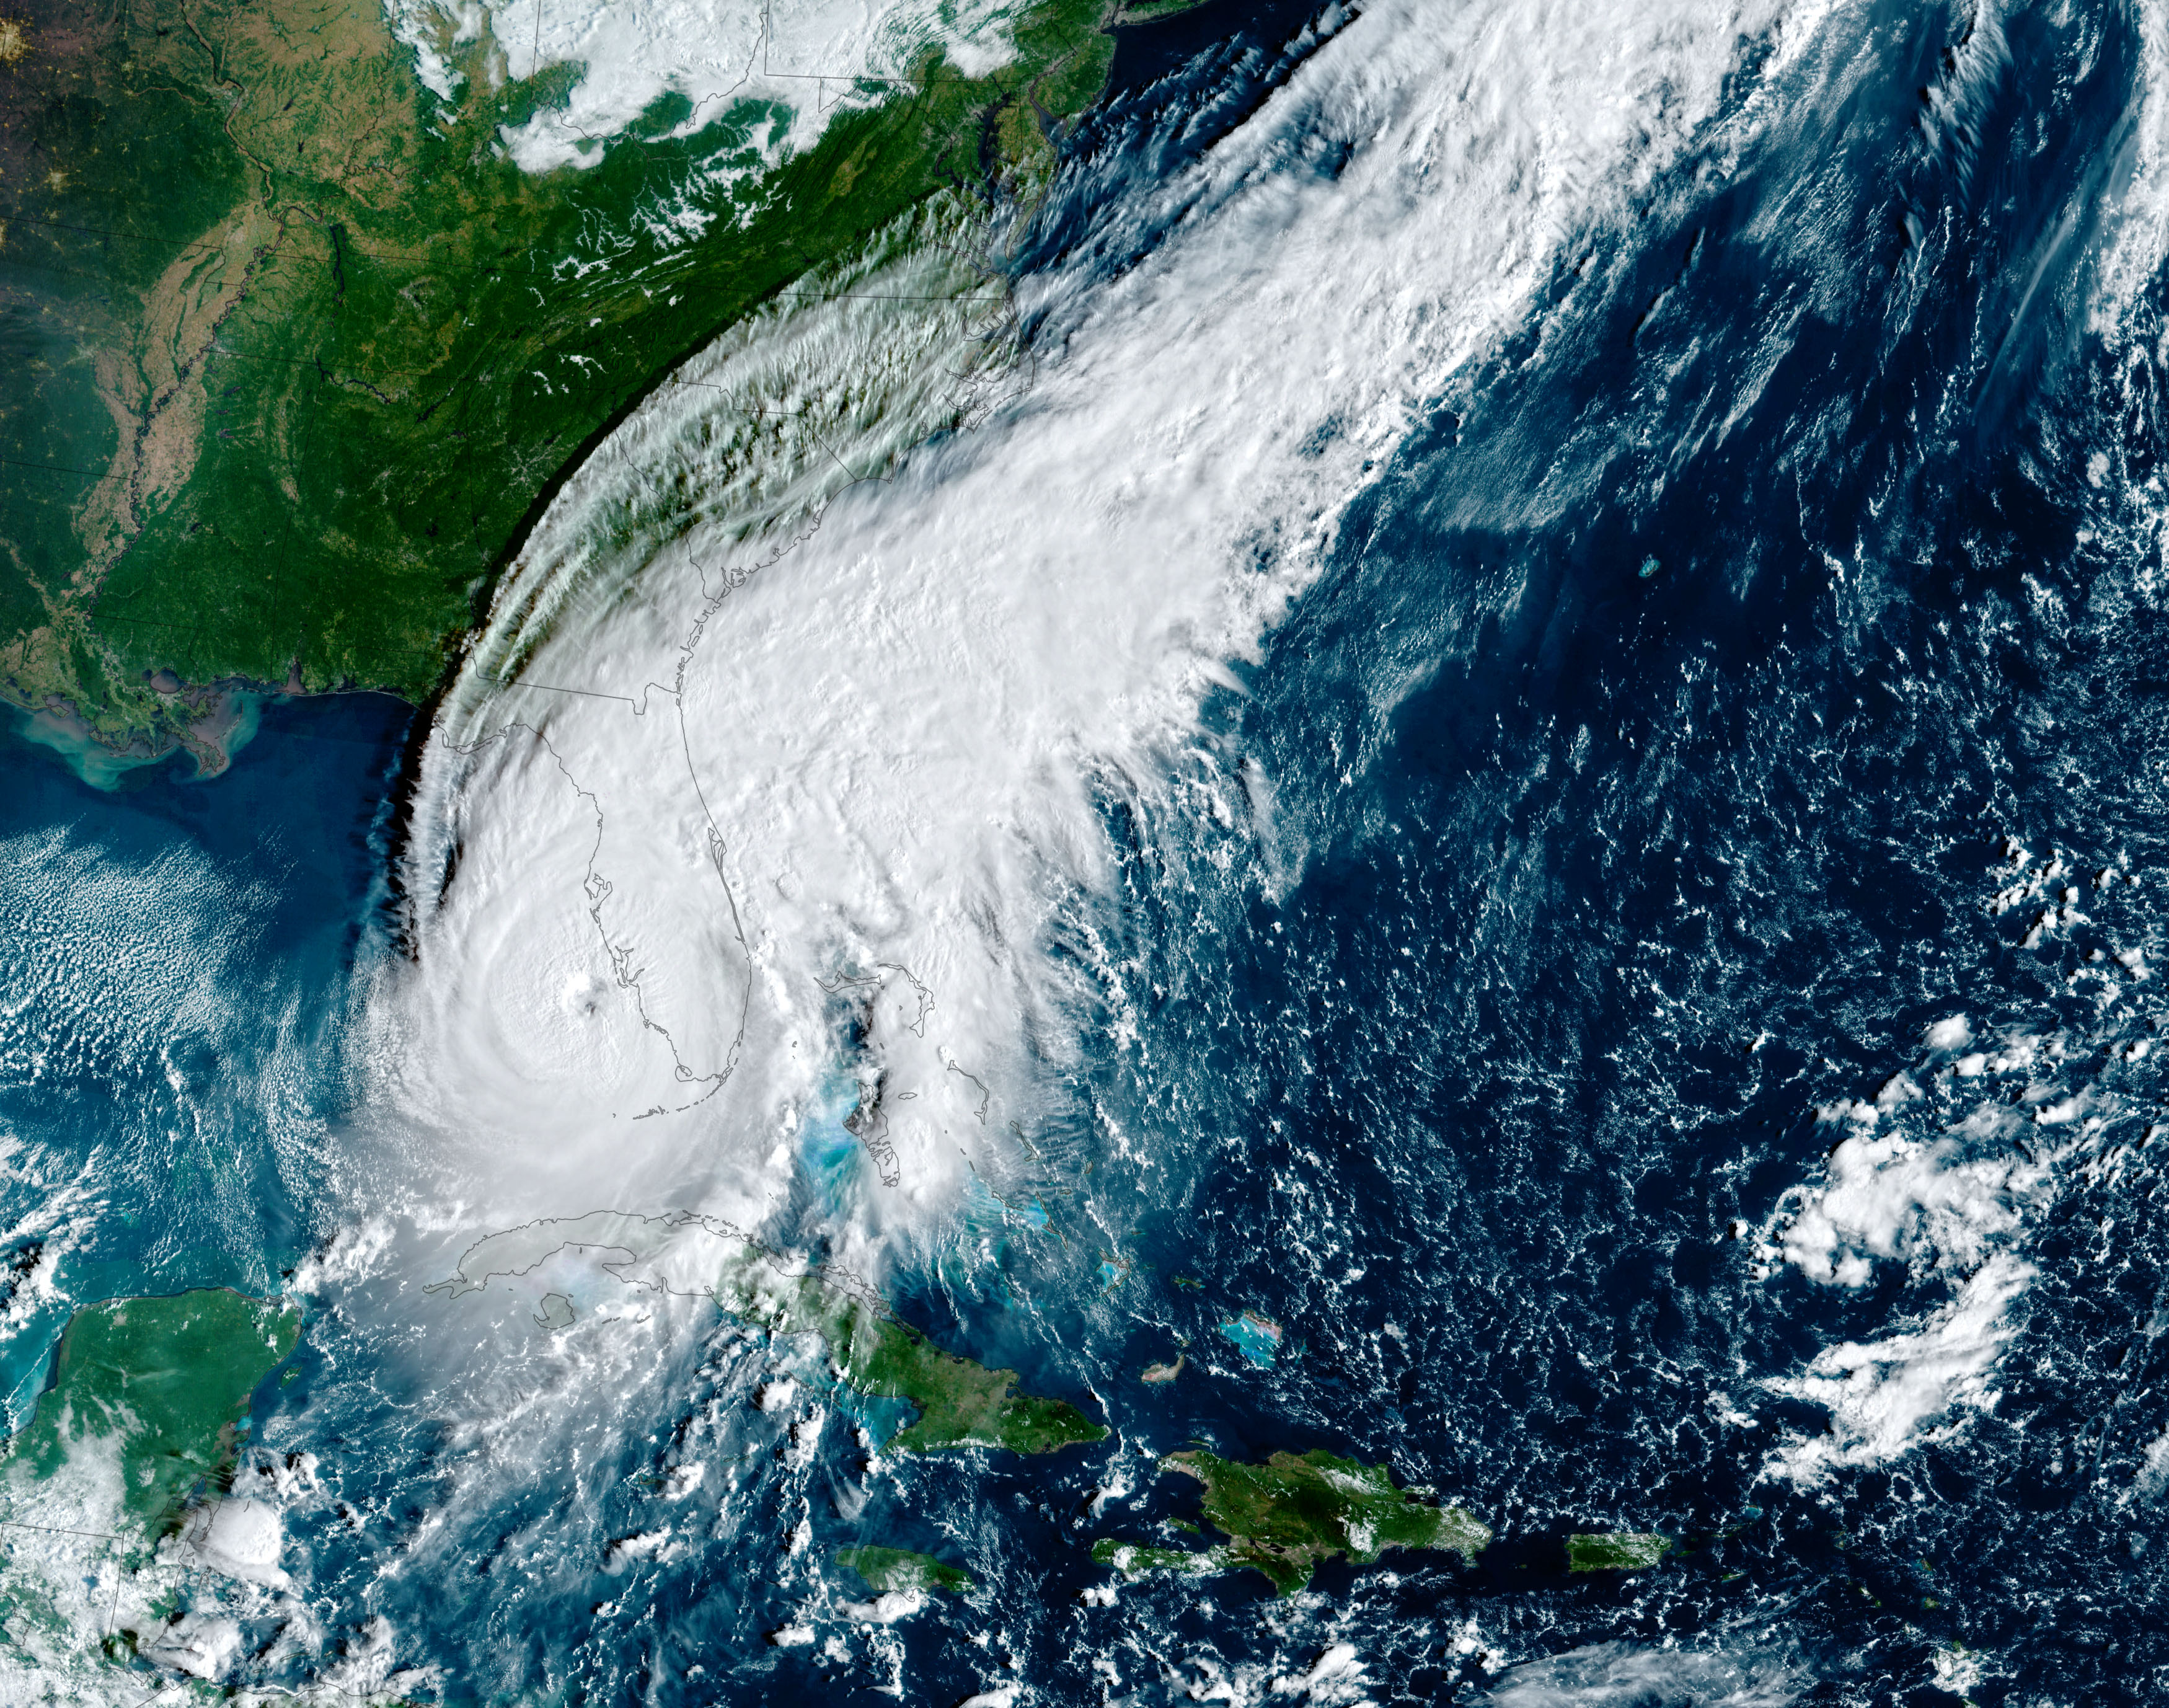
Knowing that a hurricane made landfall in Florida, for example, does not tell a reinsurer which portfolio locations were exposed. The footprint provides the geographic connection.
By overlaying a hazard footprint against exposure data, teams can identify:
This turns the hazard from a general event into something that can be analyzed against the reinsurer's actual book.
Put historical footprints next to reinsured exposure
DisasterAWARE Historical Event Intelligence delivers event footprints, severity and source provenance for past catastrophes — ready to intersect with cedent and portfolio exposure.
The basic concept is straightforward:
Hazard Footprint + Exposure Data = Potentially Exposed Portfolio
Consider a reinsurer with property exposure across several counties. A wildfire begins in one county and expands over several days.
The initial event footprint may intersect only a small portion of the portfolio. As the fire expands, the footprint changes—and the number of potentially exposed locations can change with it. This means exposure analysis does not necessarily happen once.
For rapidly developing events, it can be a continuing process as the hazard footprint evolves. That dynamic element is particularly important for reinsurance teams monitoring large or fast-moving catastrophes.
One of the limitations of treating an event as a simple boundary is that hazard intensity can vary substantially within the footprint.
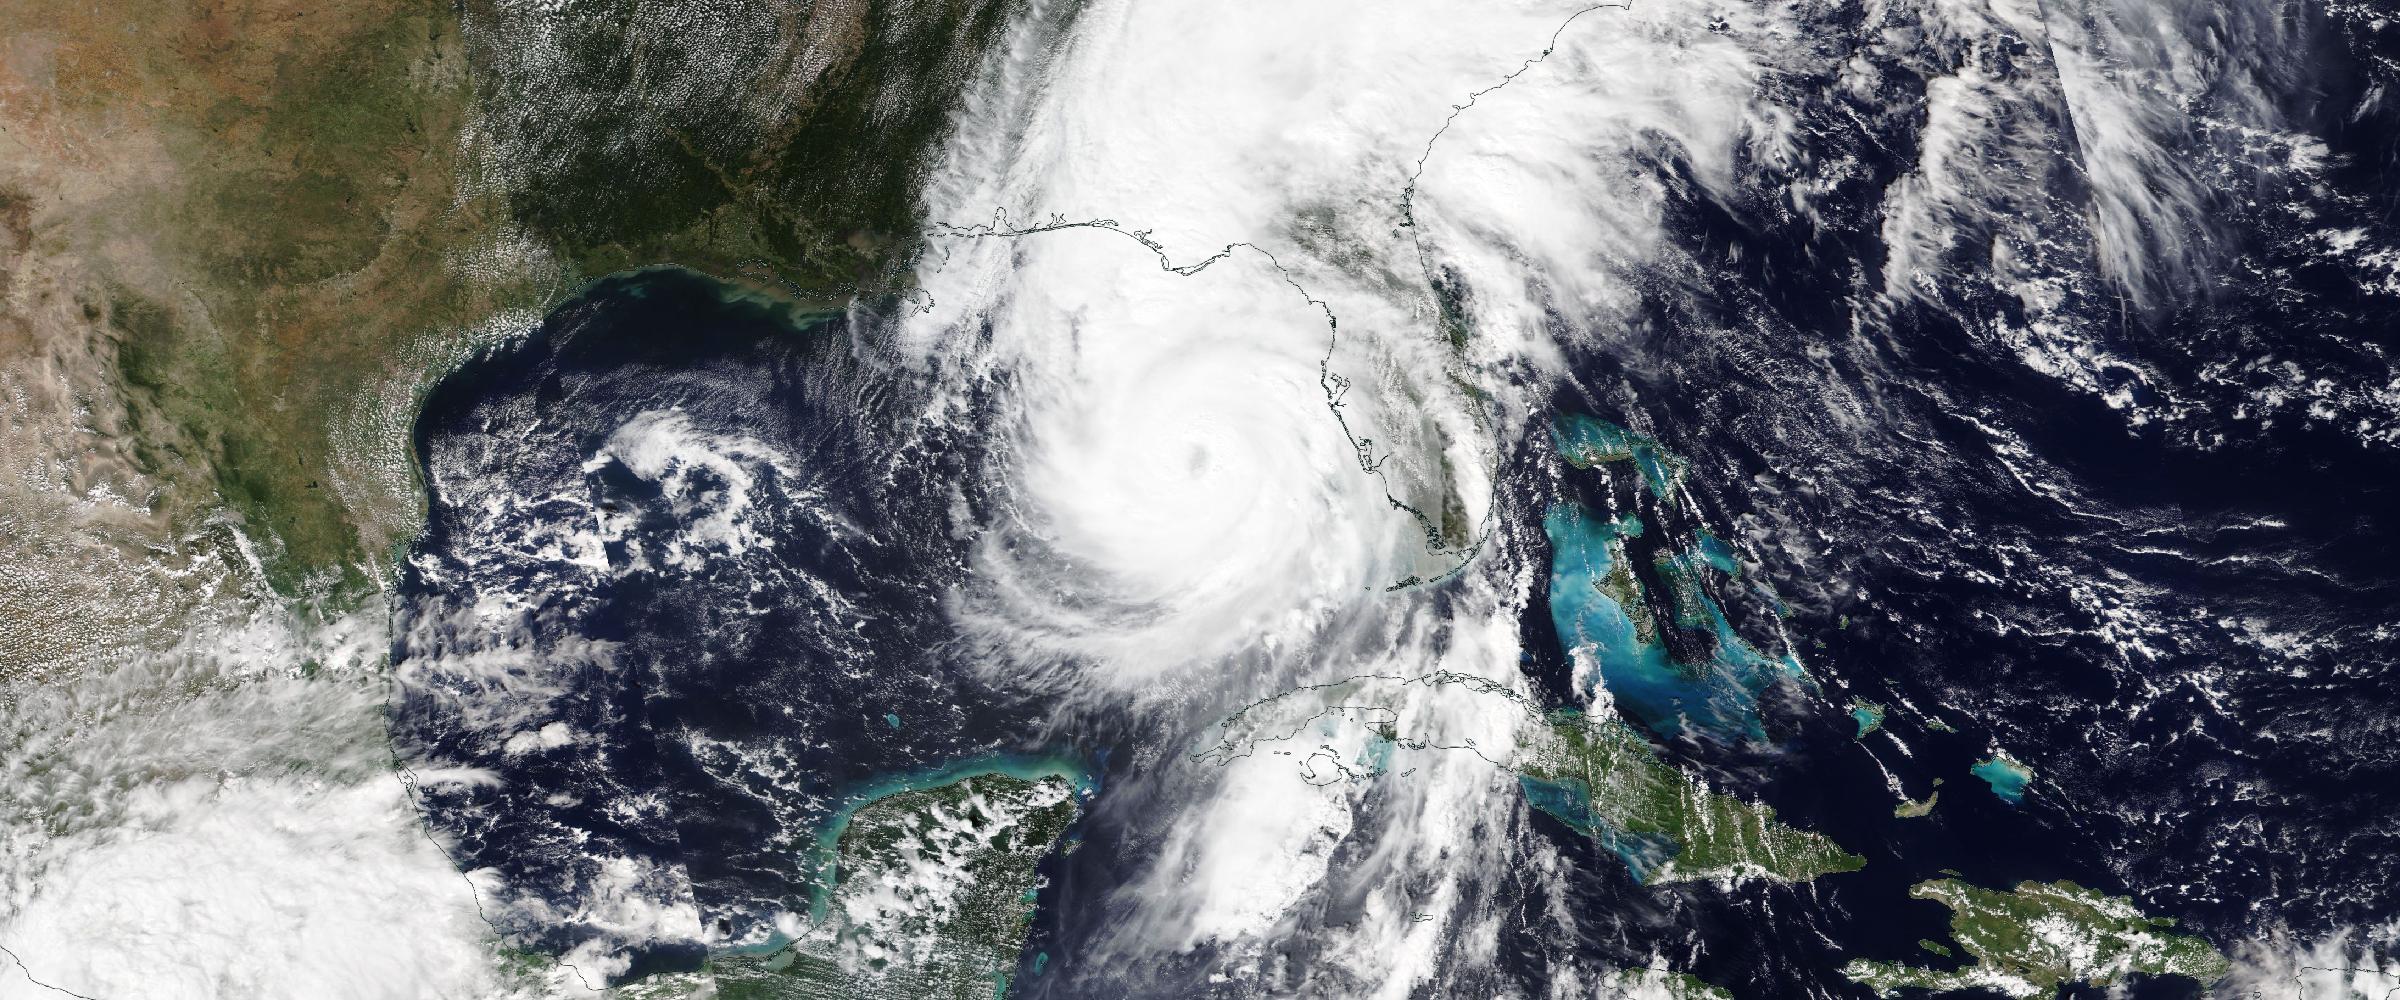
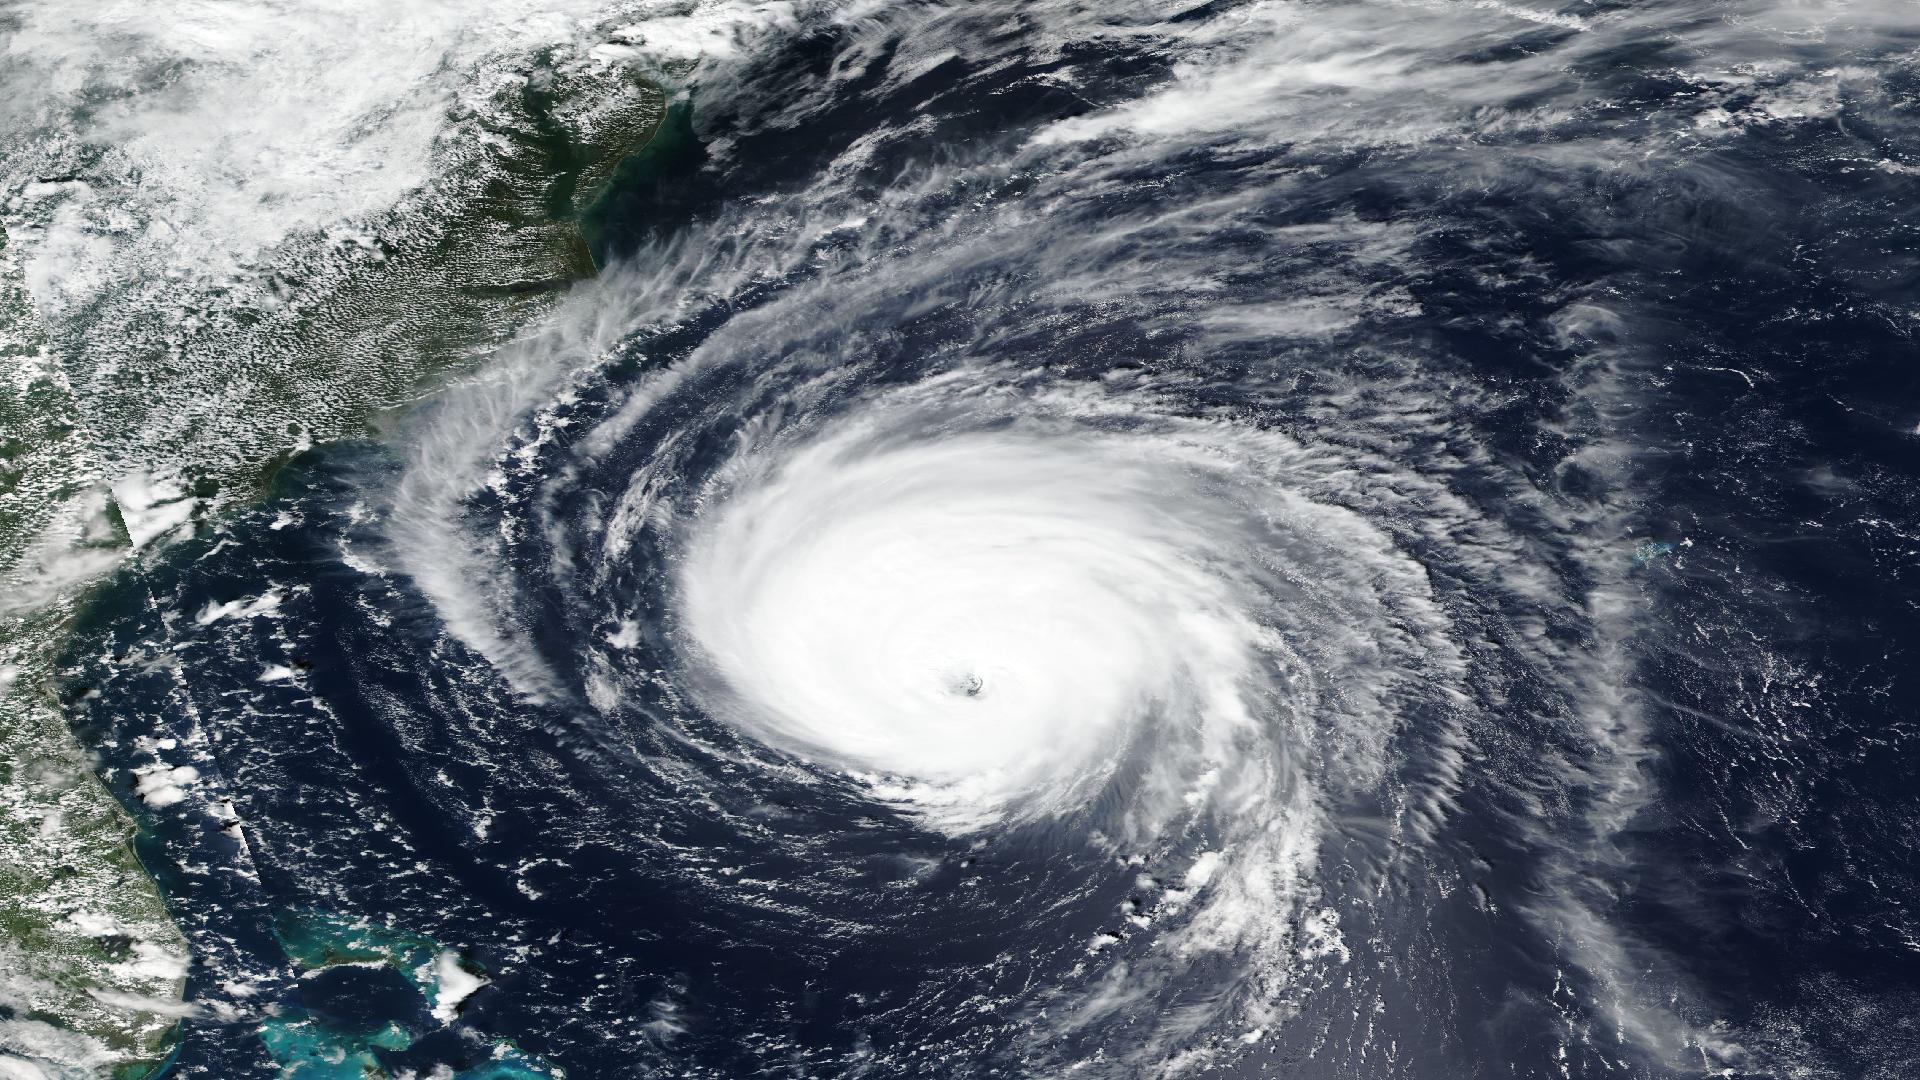
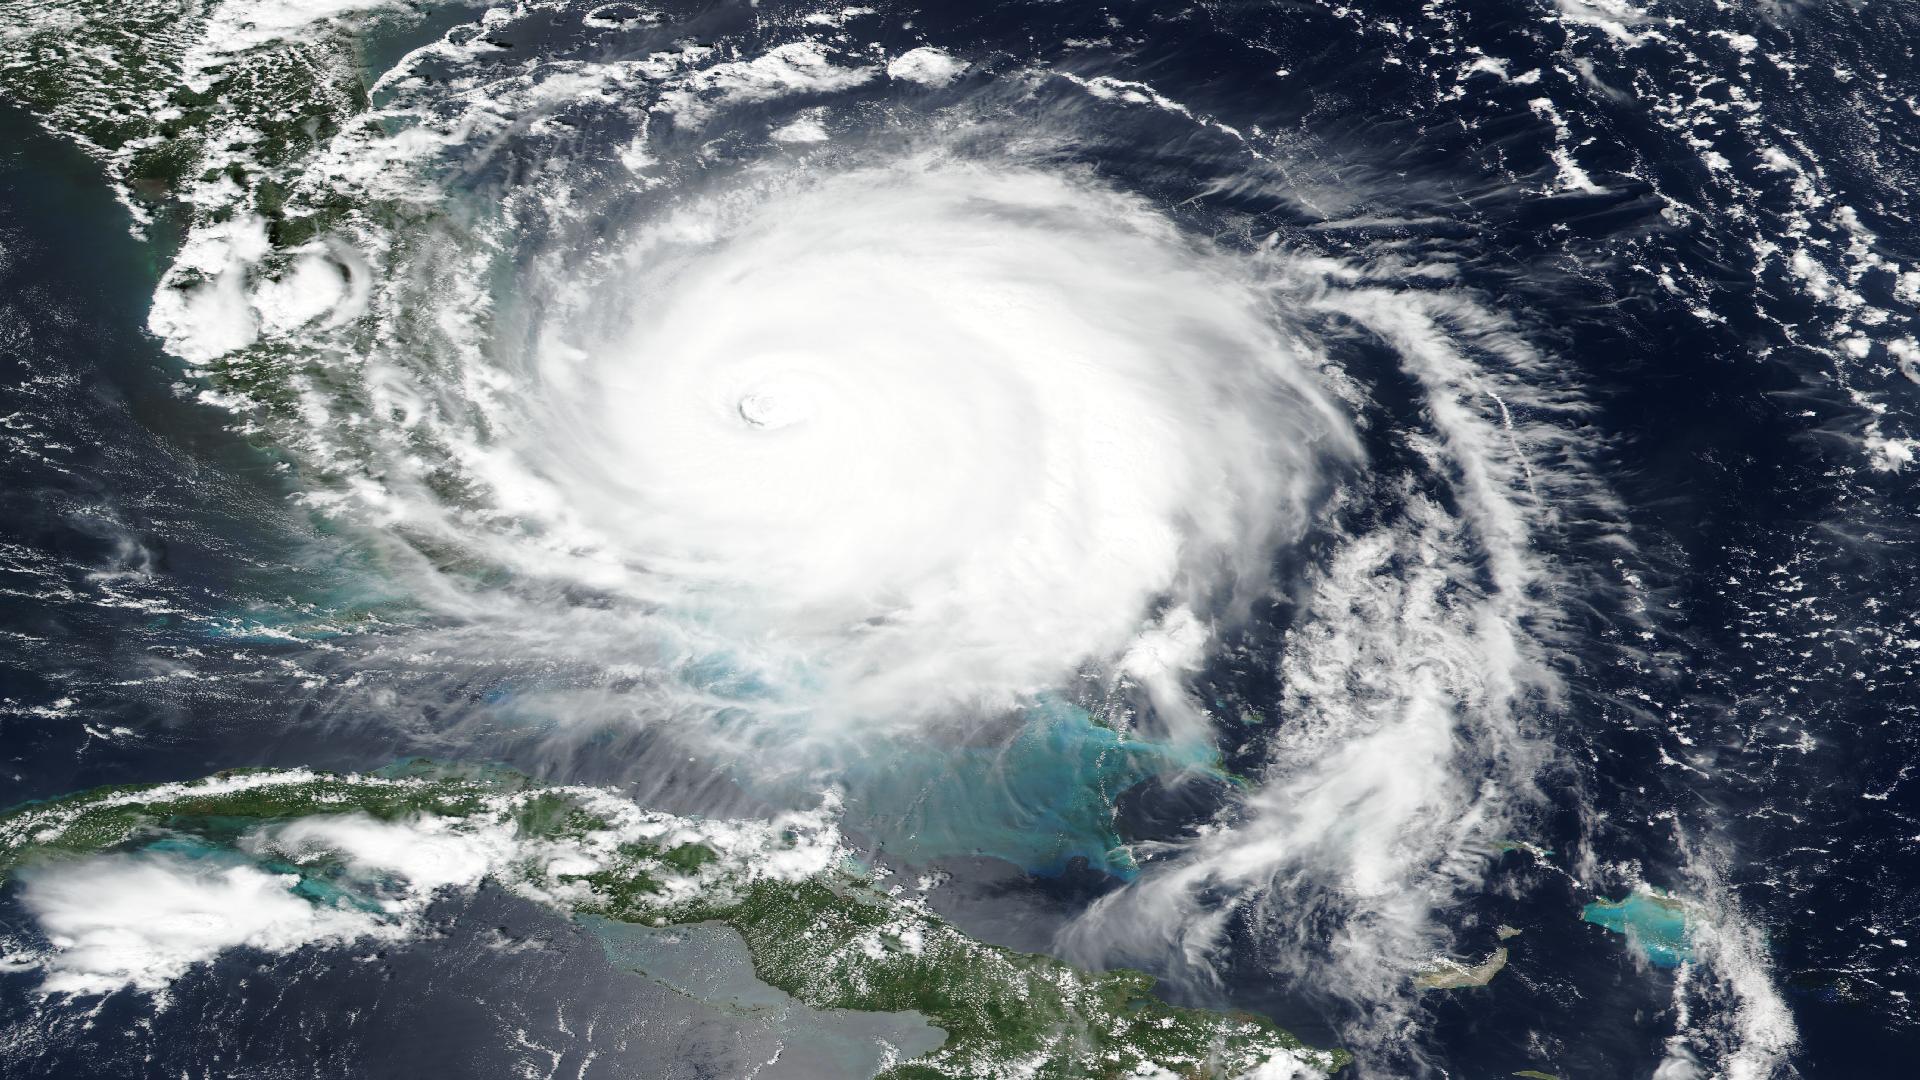
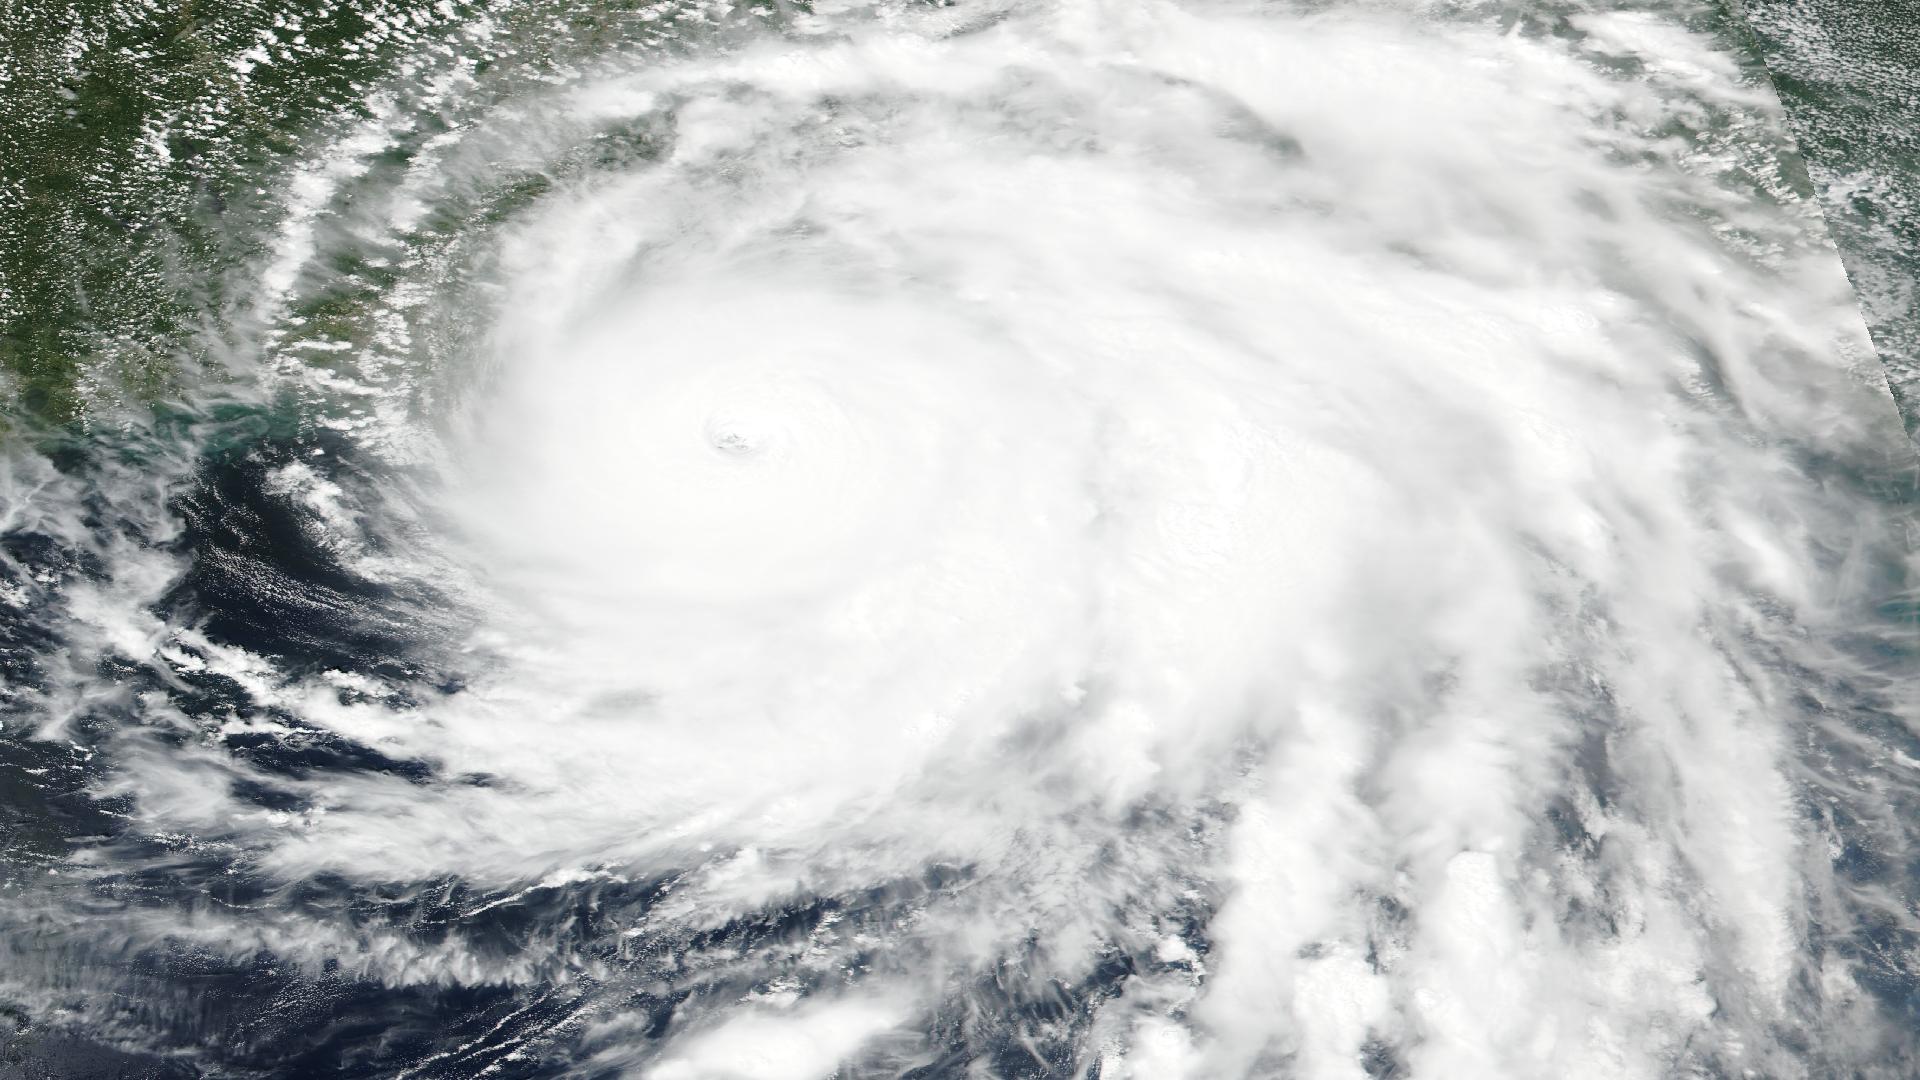
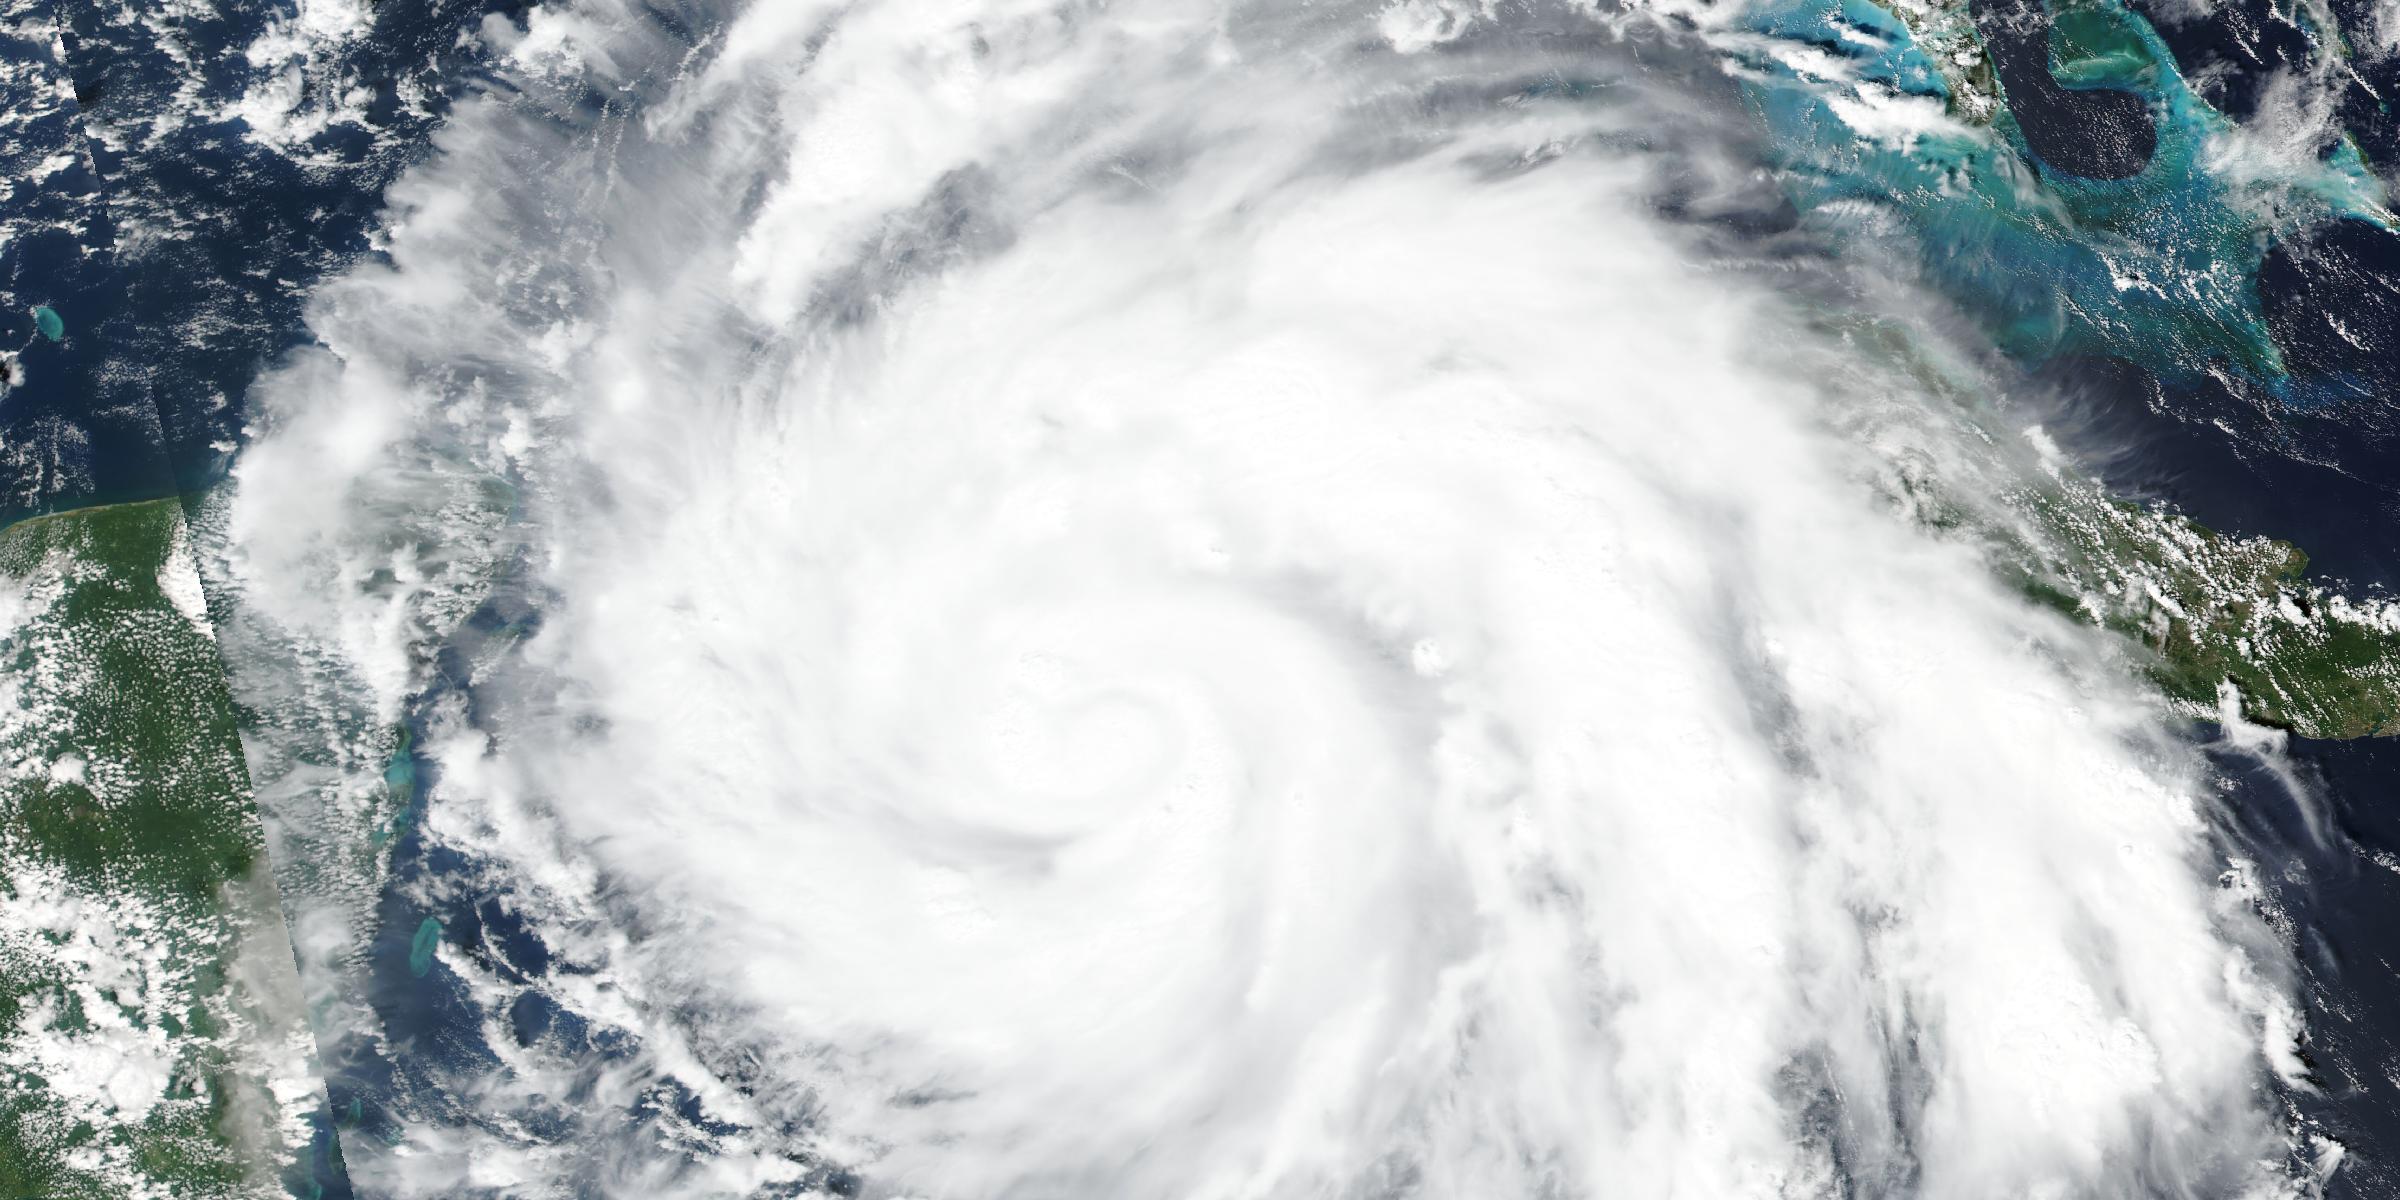
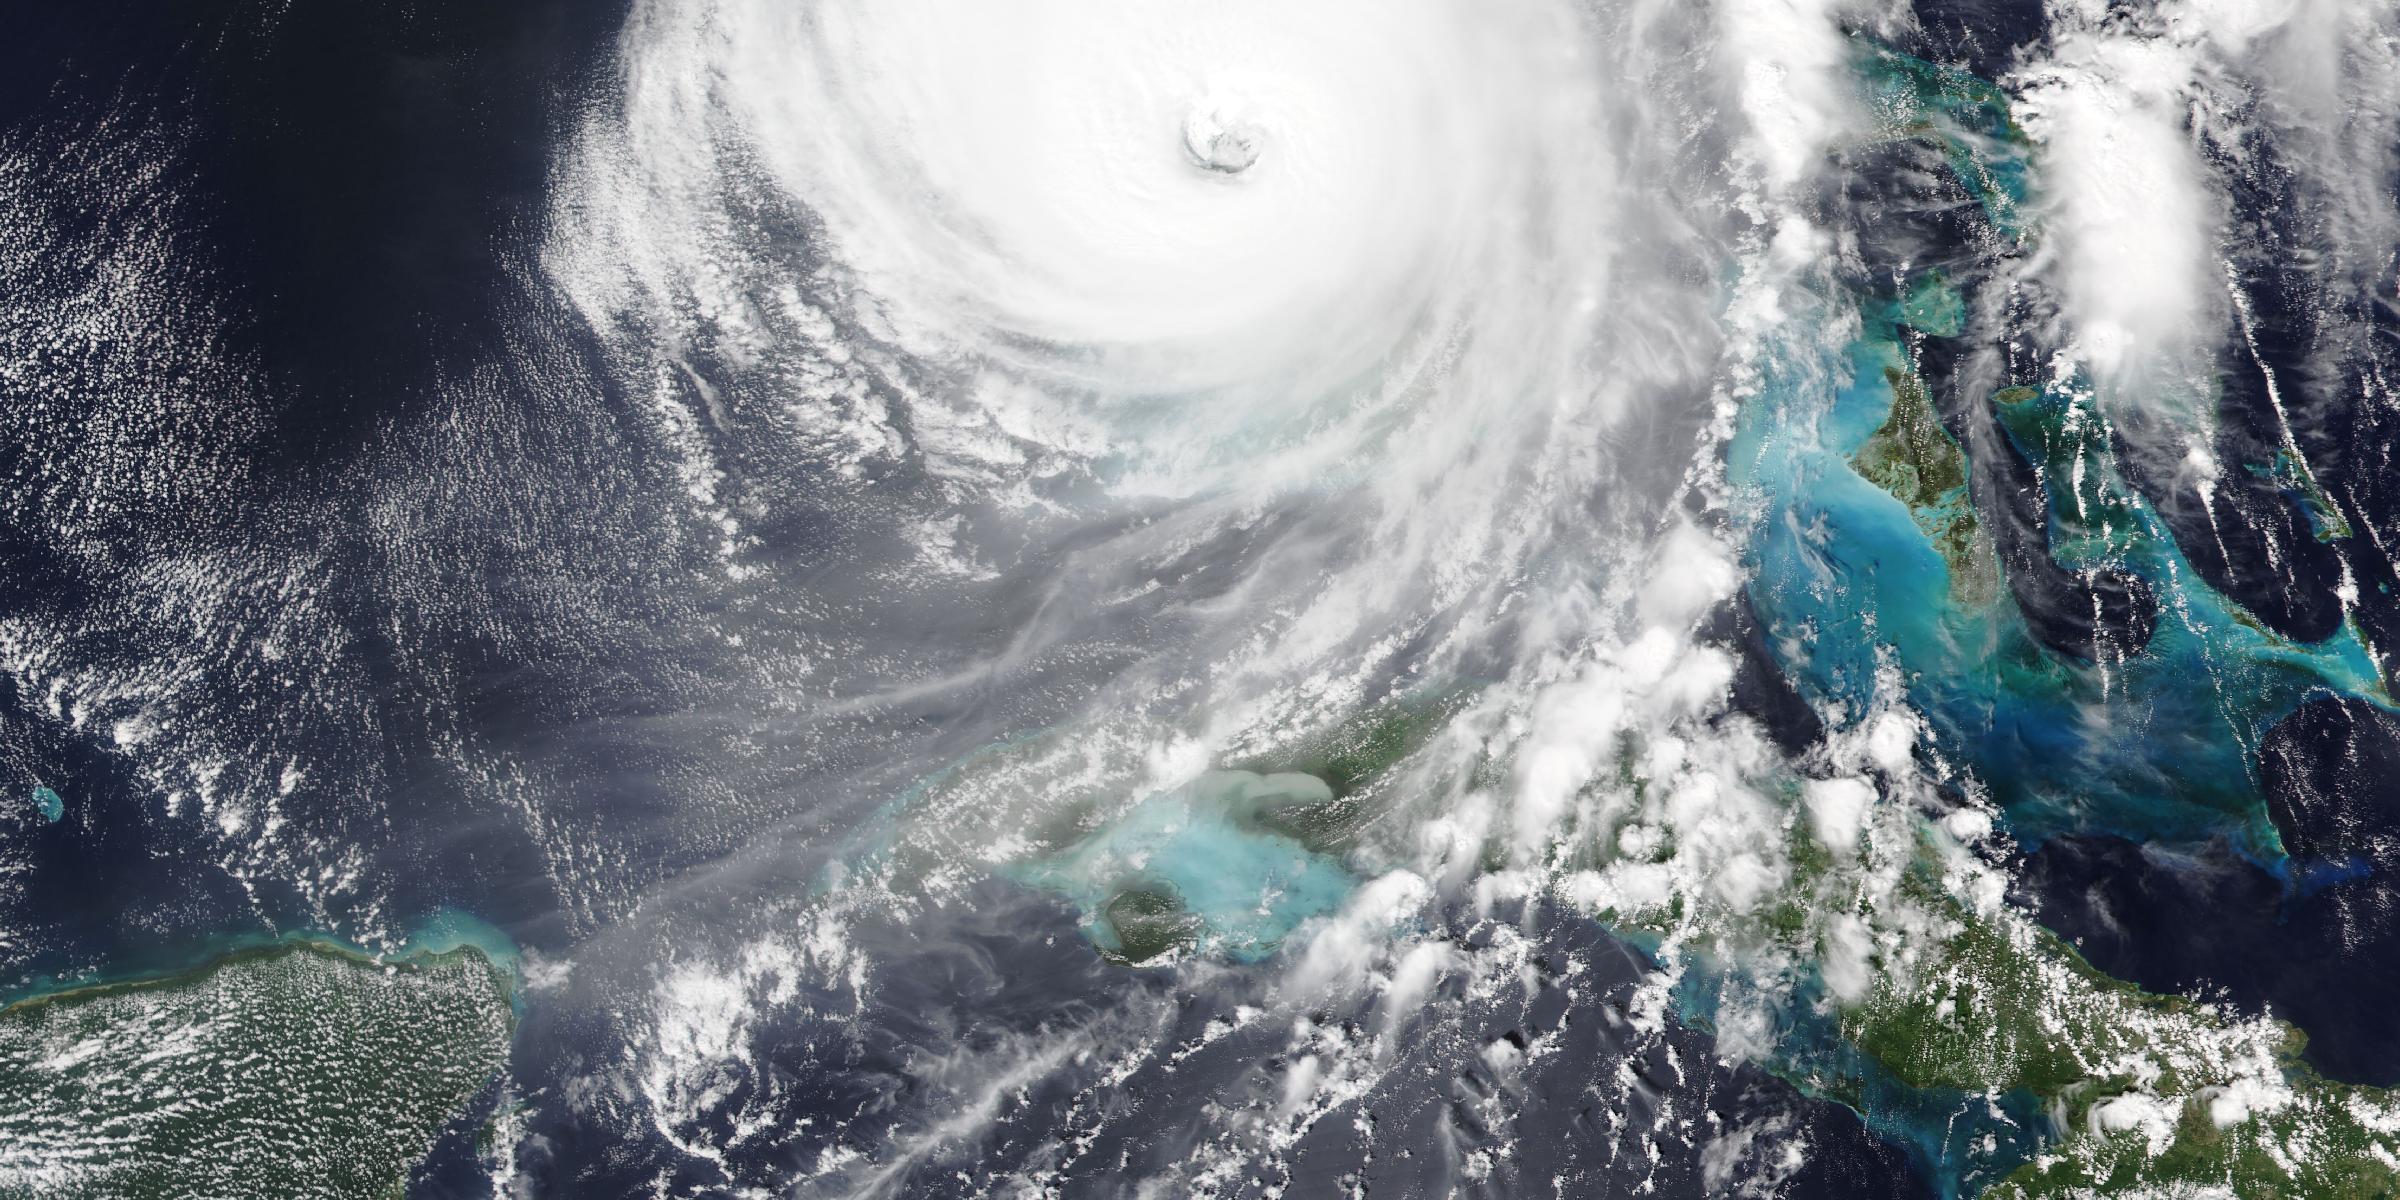
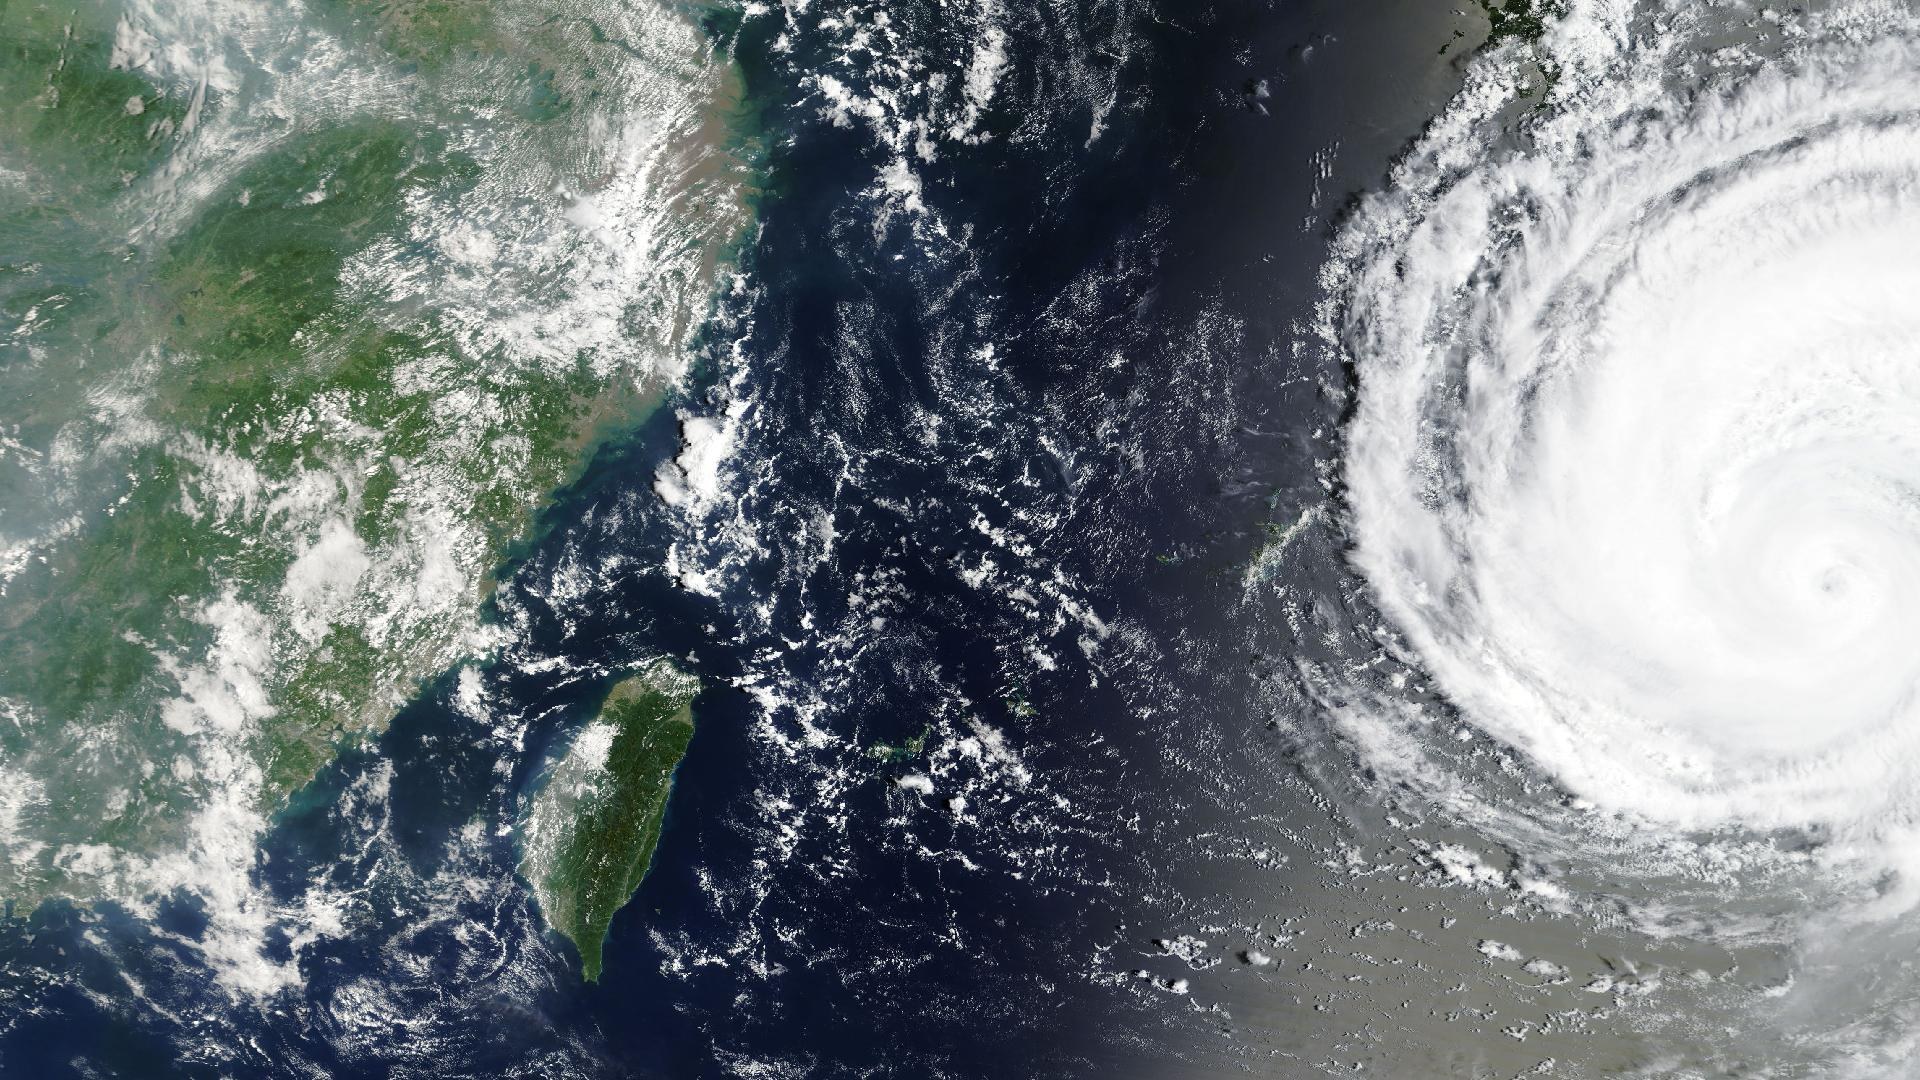
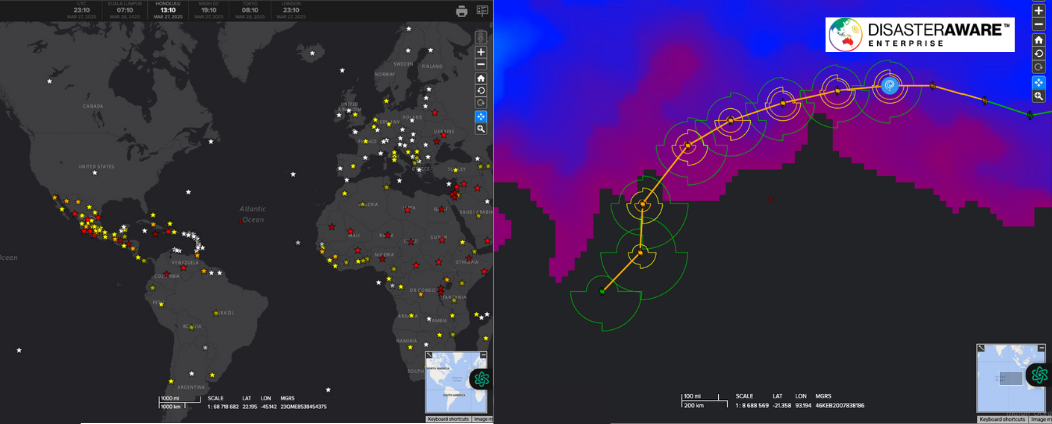
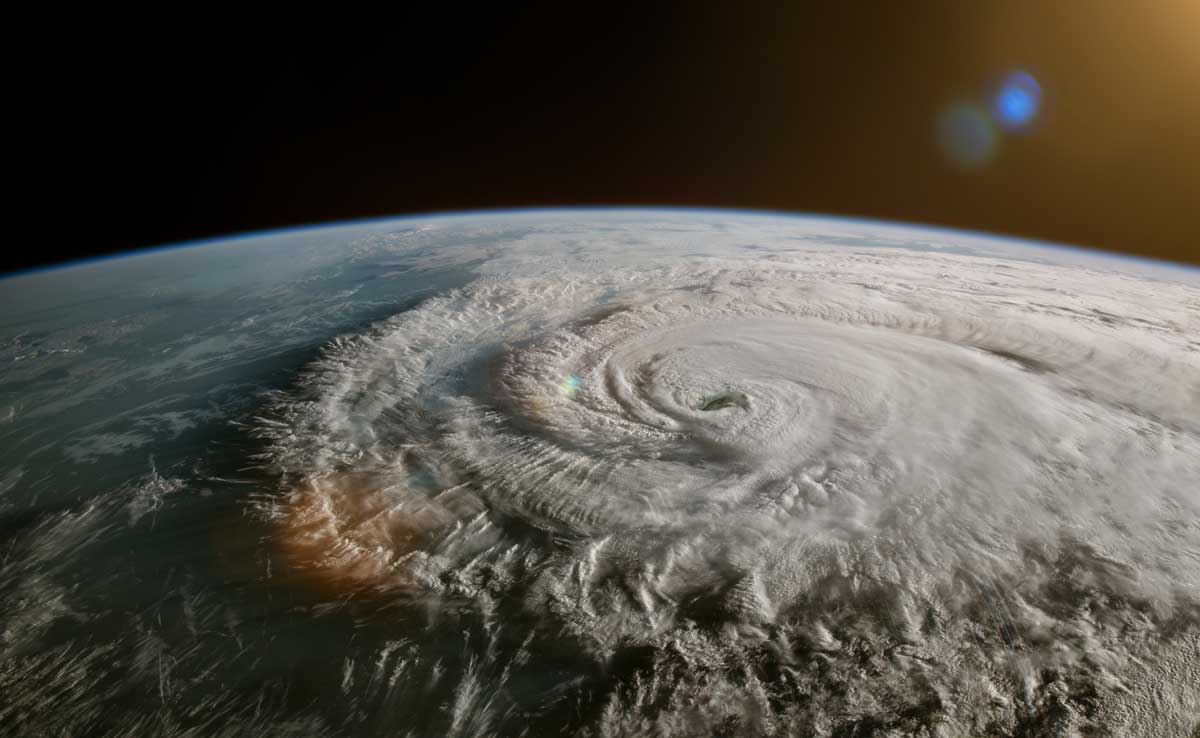
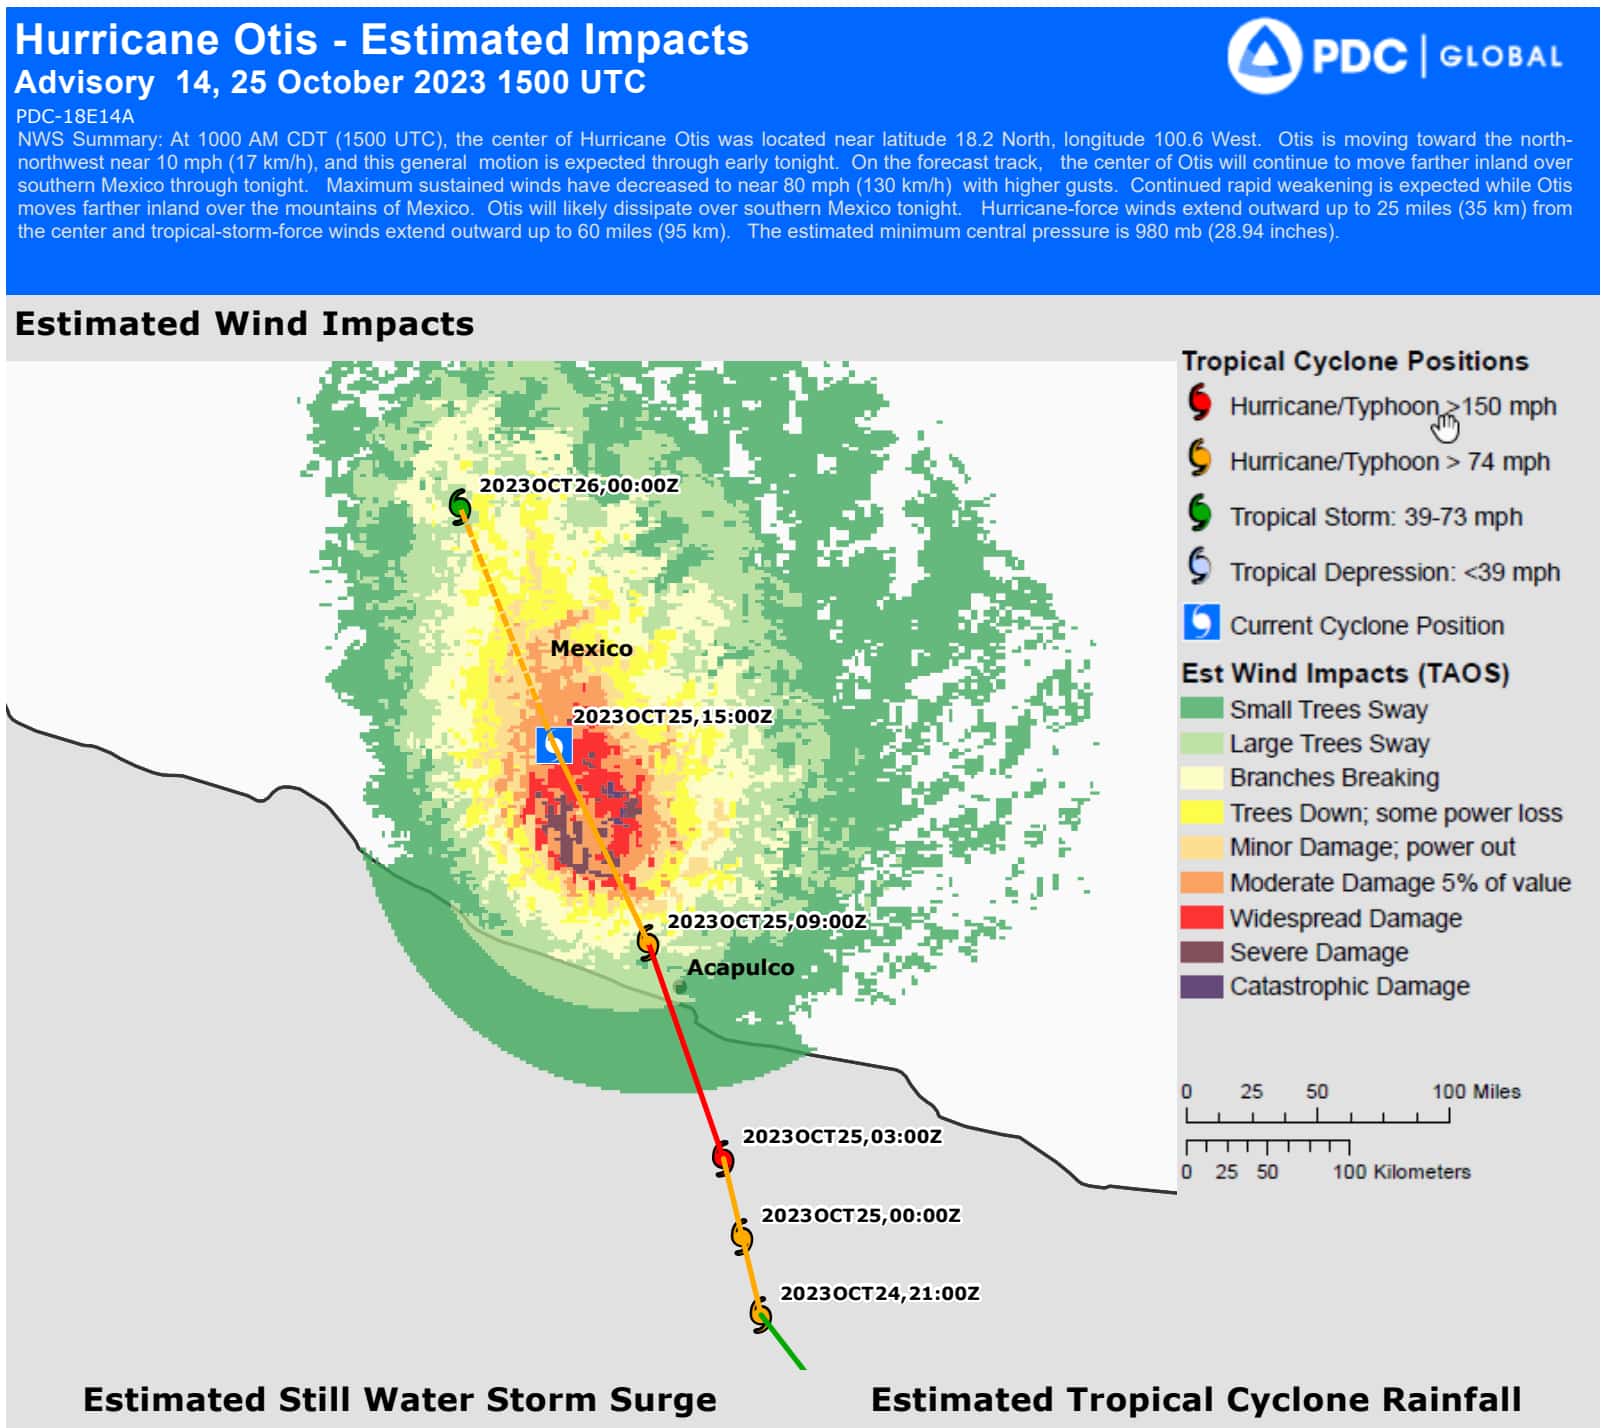
Consider a hurricane. A geographic footprint might show the area affected by the storm, but wind intensity, rainfall, storm surge, and other hazards can vary significantly across that area.
Likewise, a wildfire perimeter tells you where the fire has burned or is burning, but exposure to smoke, heat, flames, and other impacts may extend beyond the perimeter.
For reinsurers, this means that the characteristics attached to a footprint can be as important as the footprint itself.
More detailed hazard intelligence can allow exposure teams to ask not simply:
Was the location inside the event?
but:
What level or type of hazard did the location experience?
The value of a footprint looks different depending on the catastrophe.
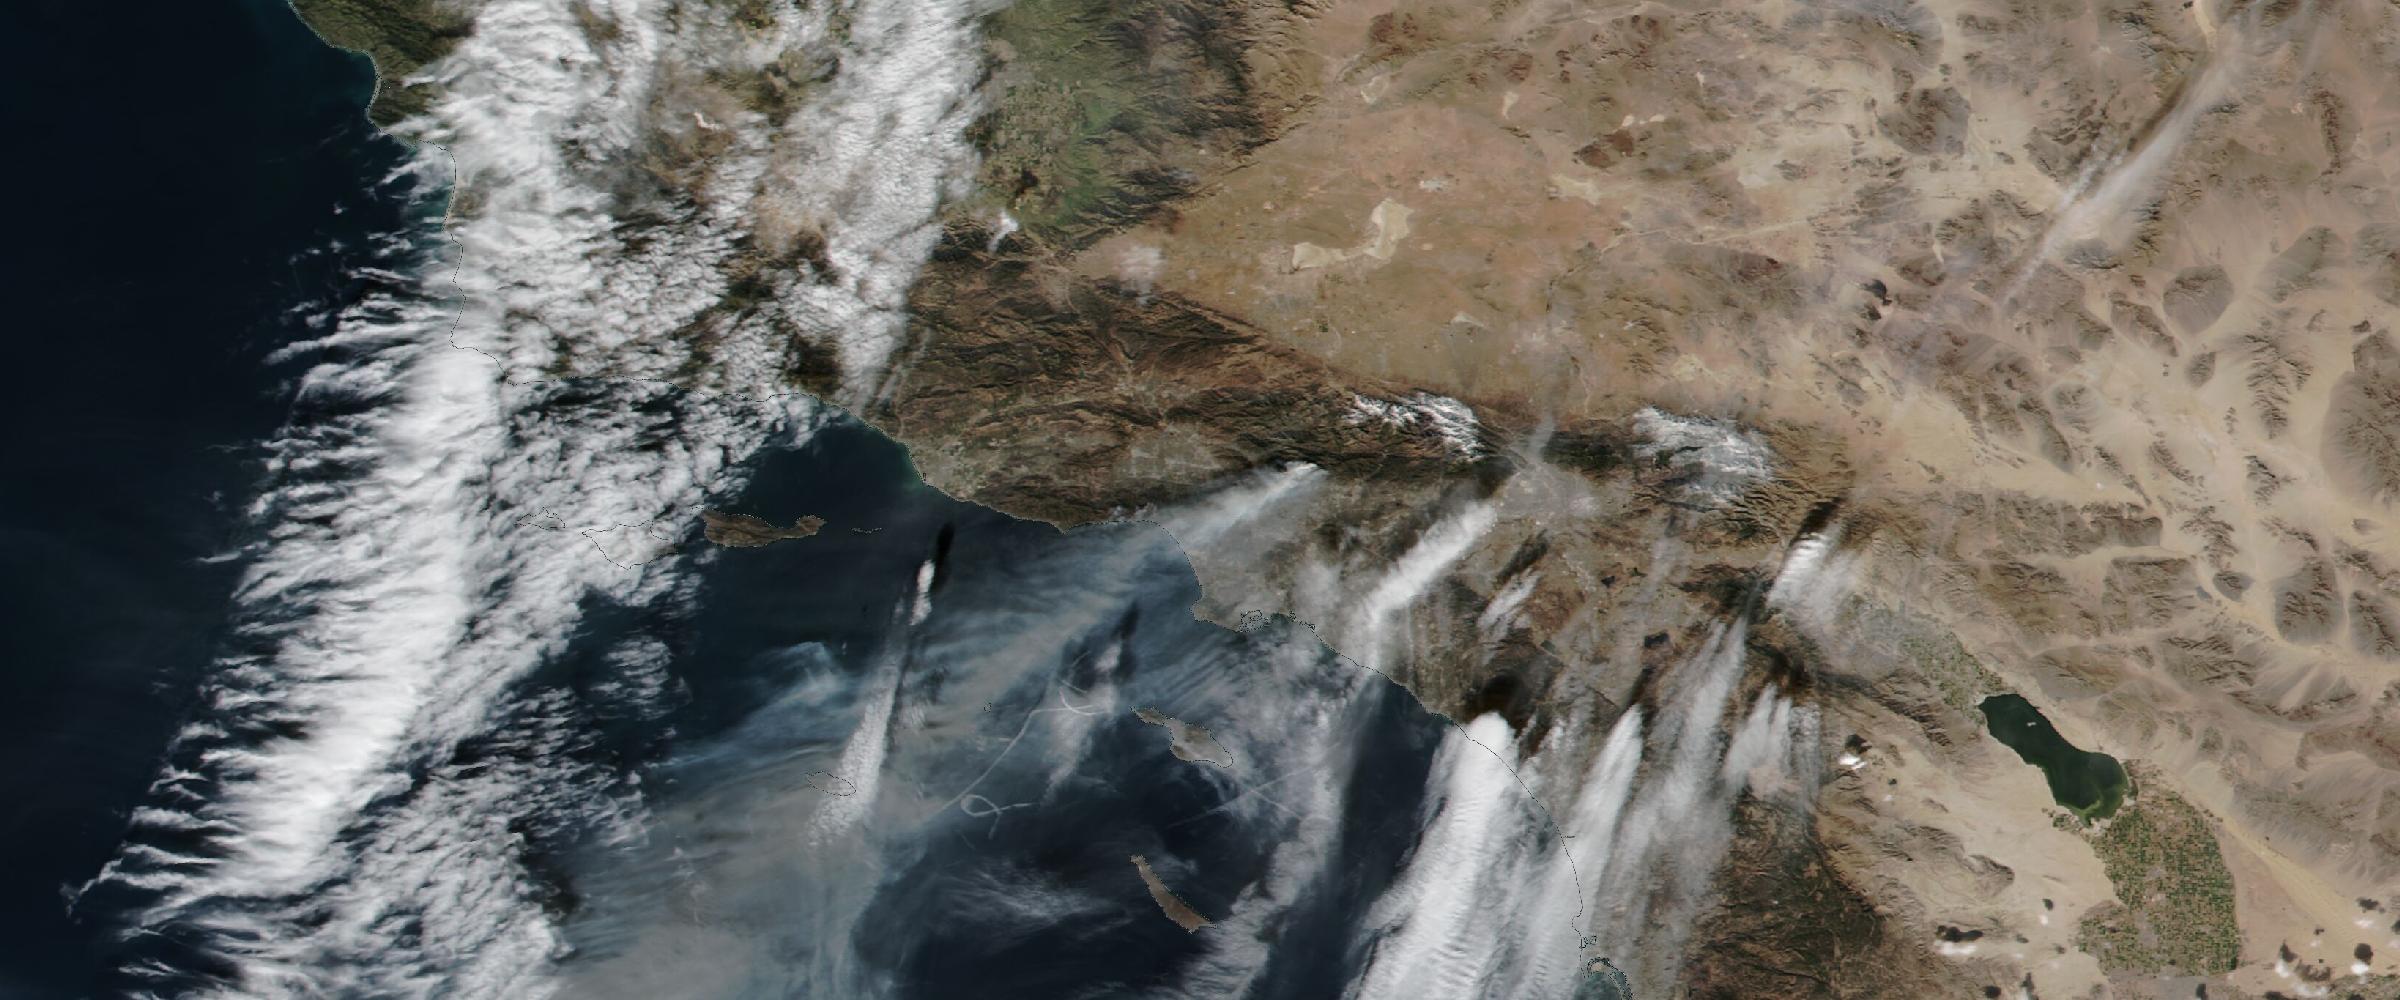
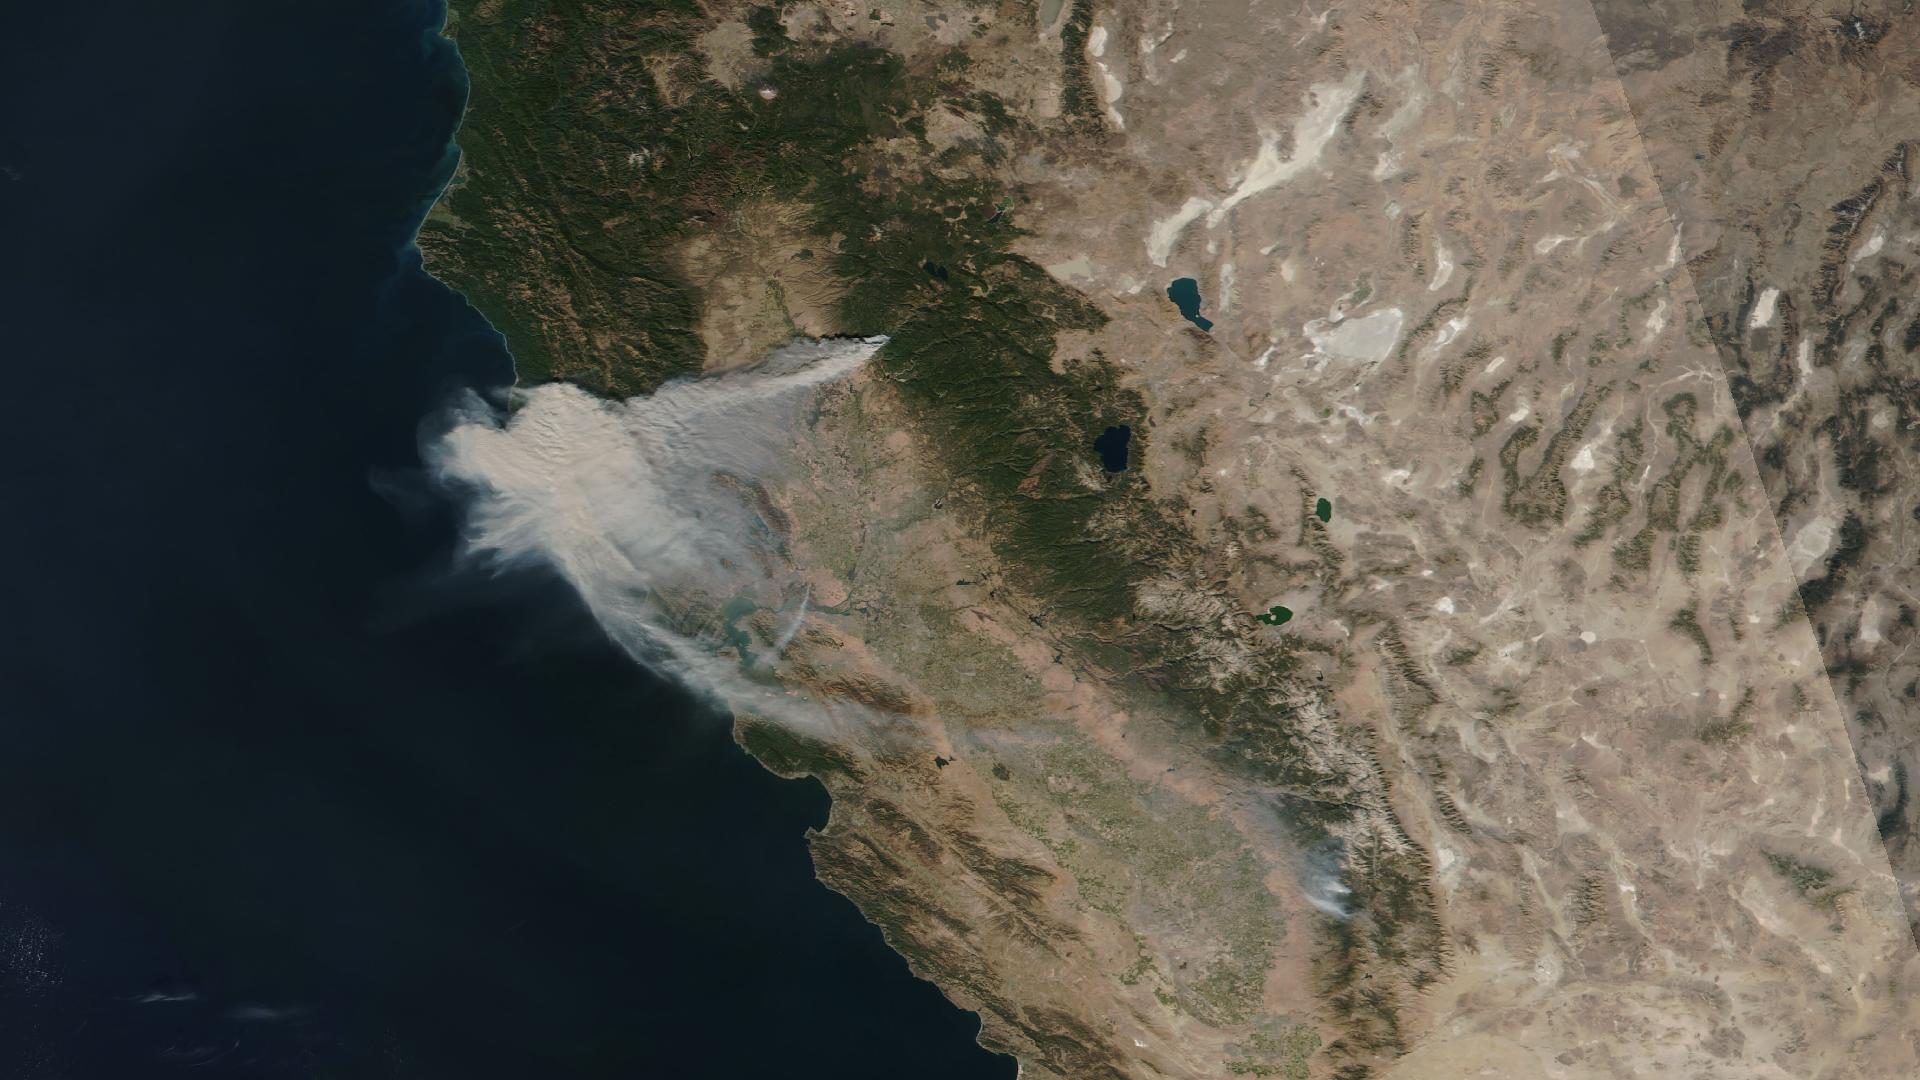
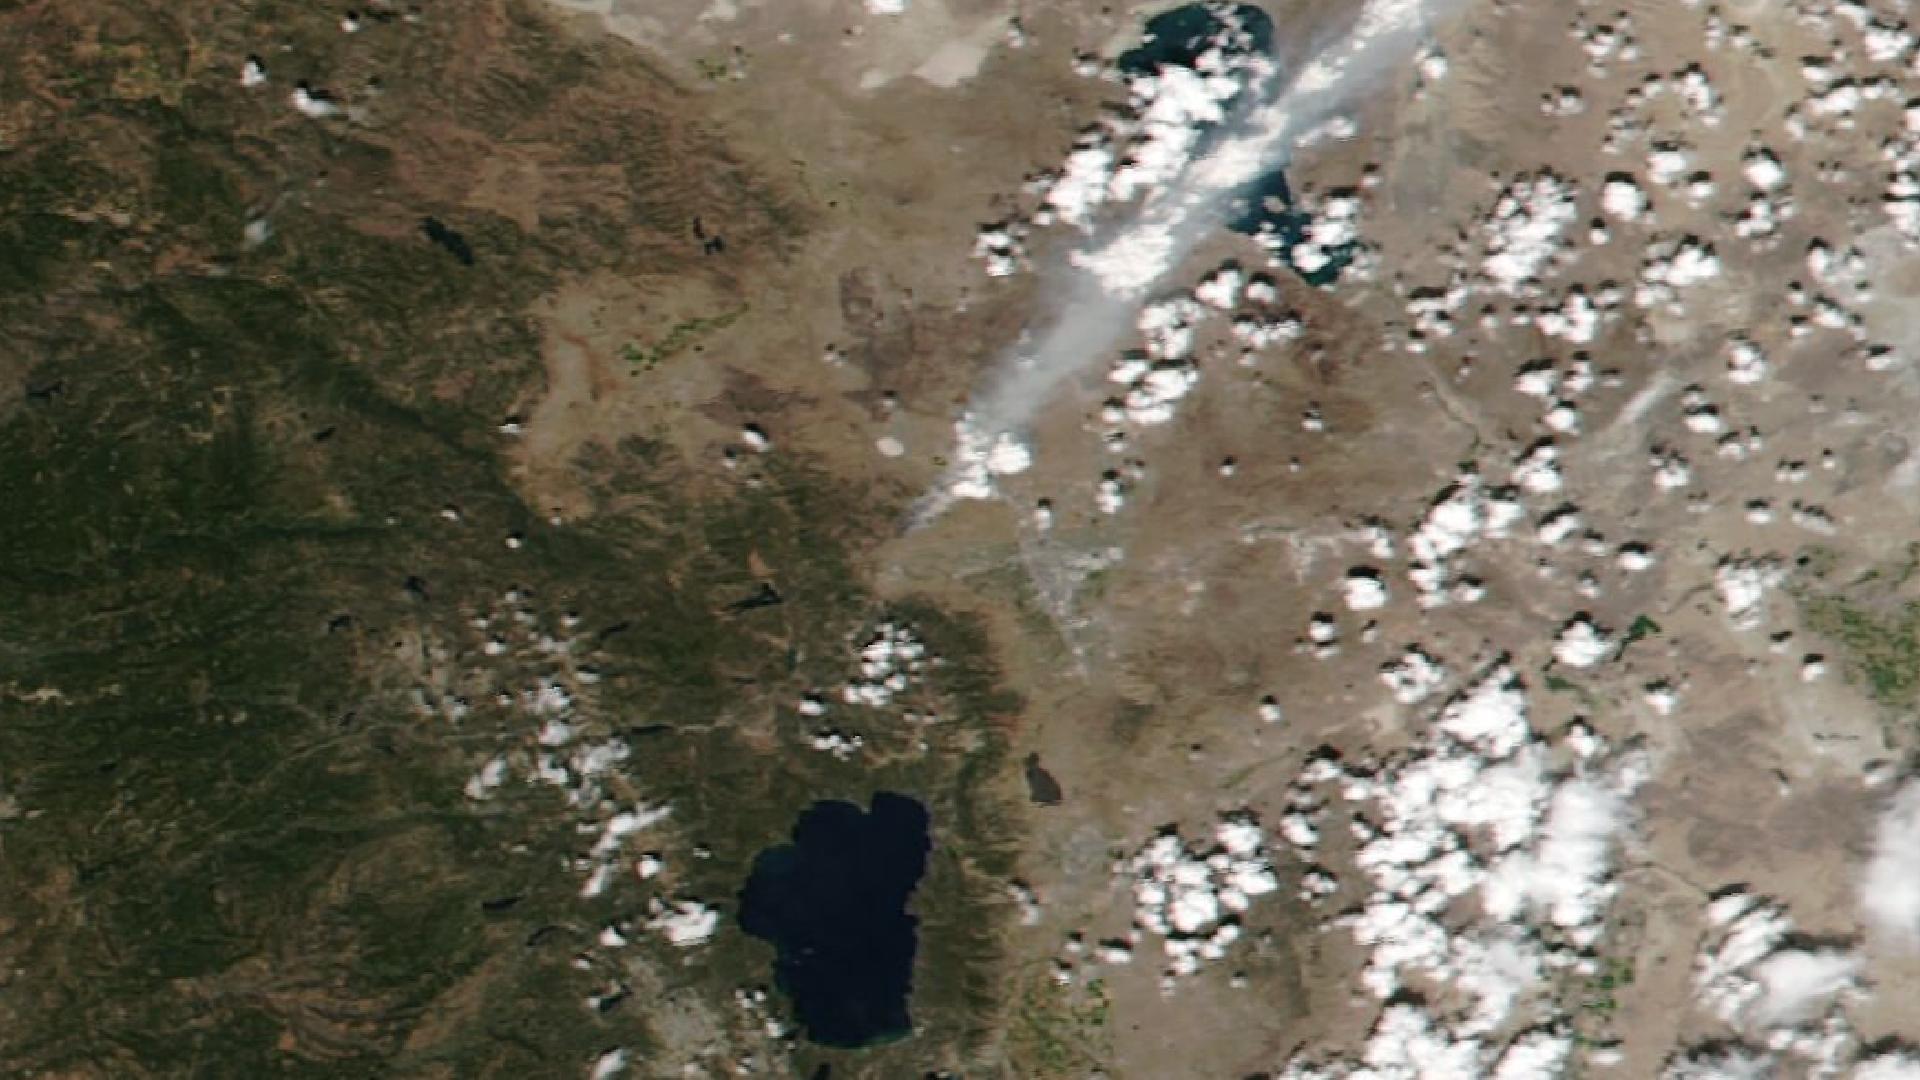
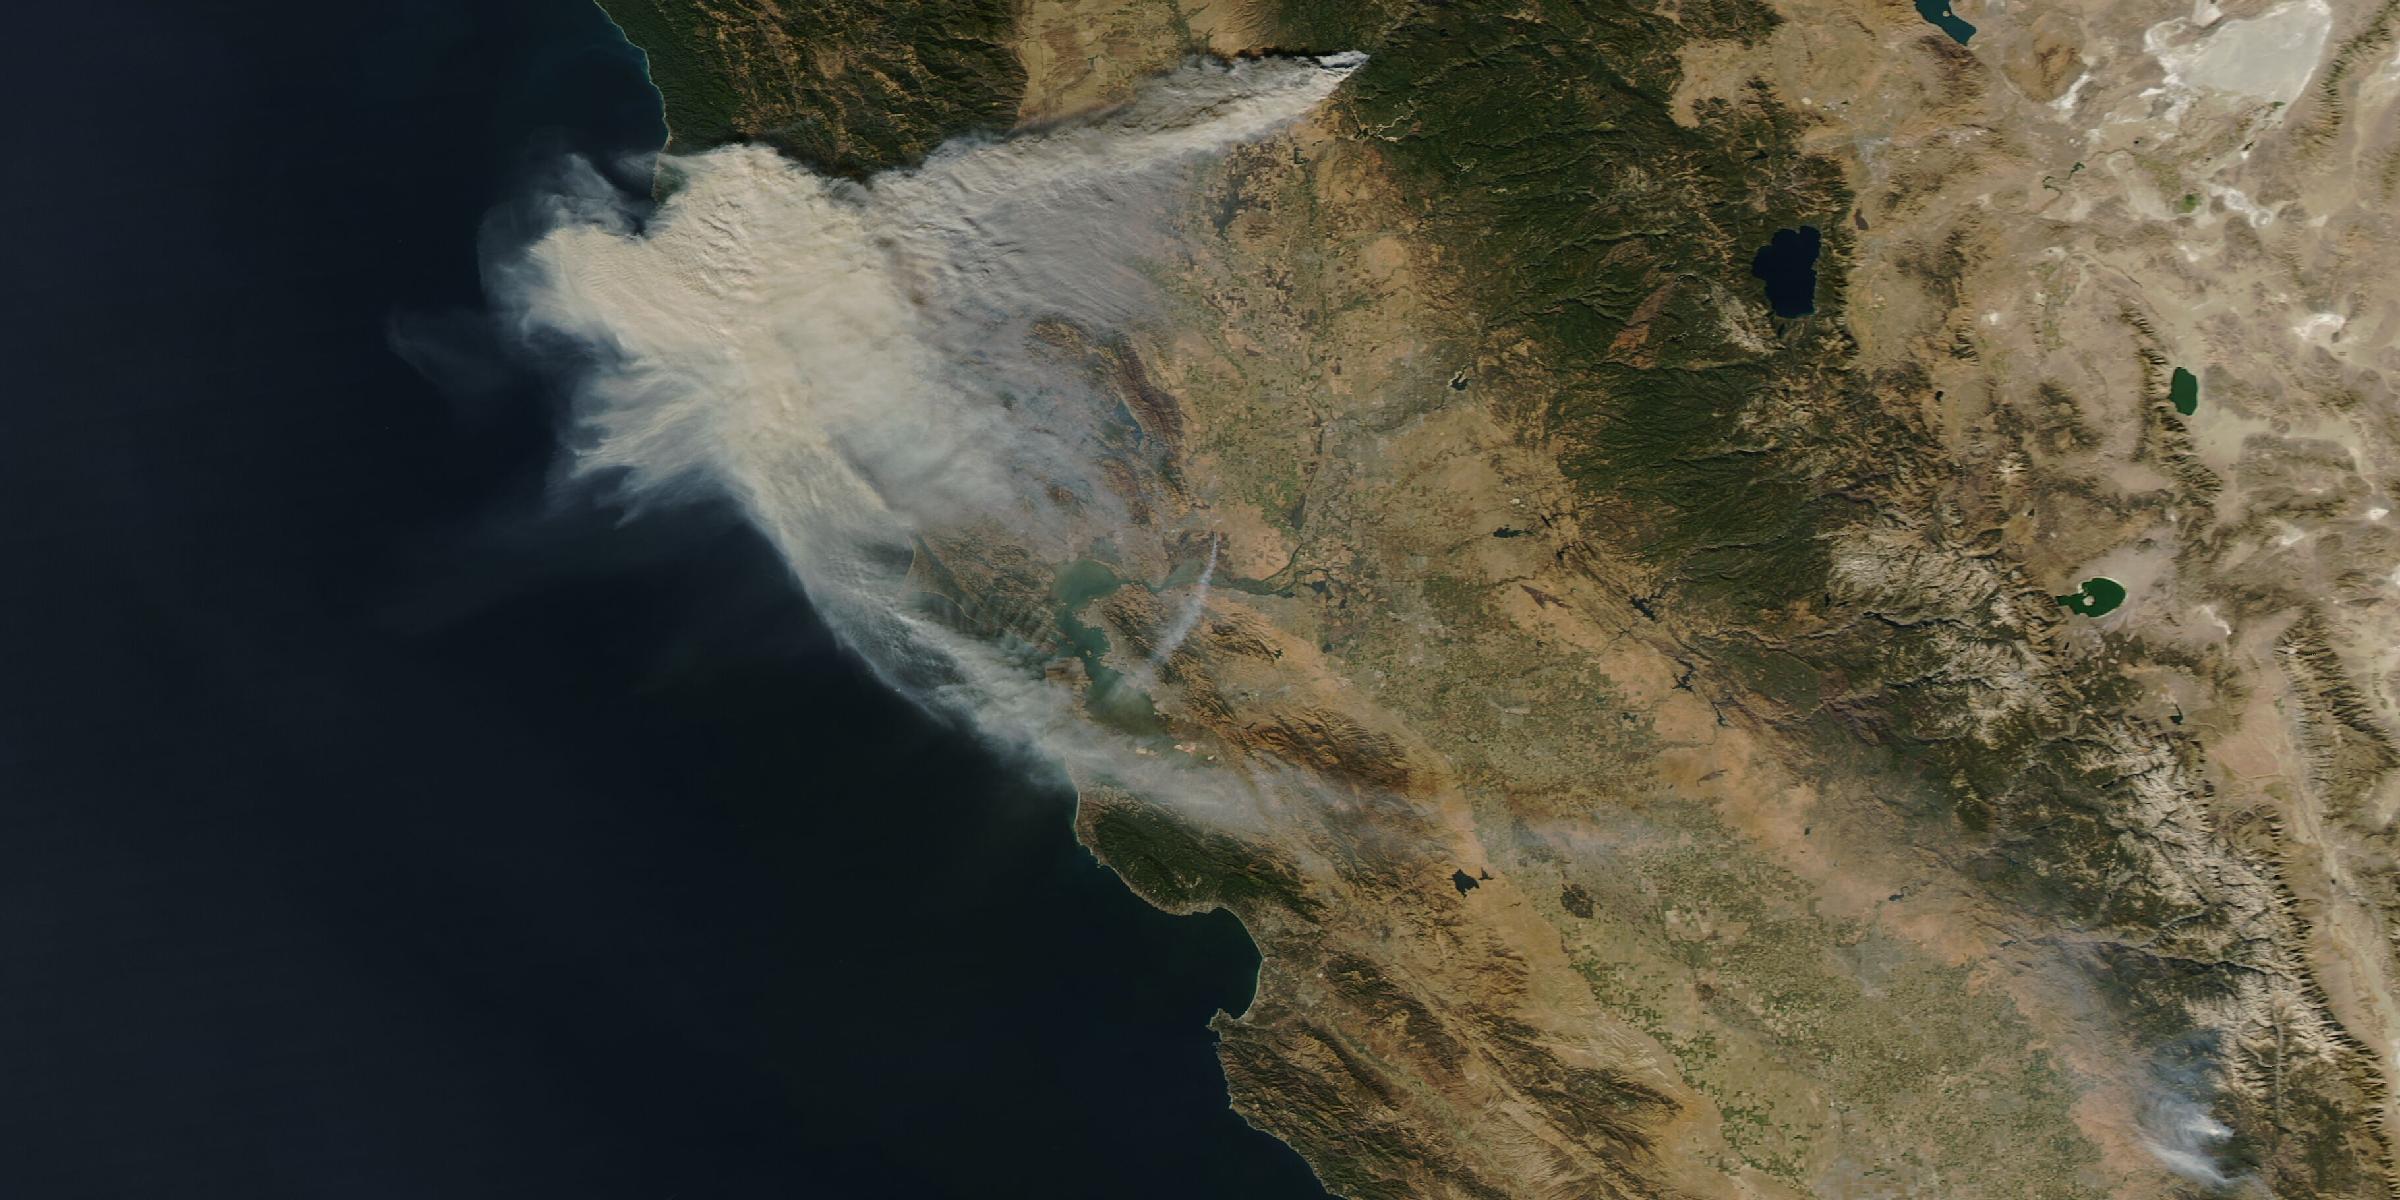
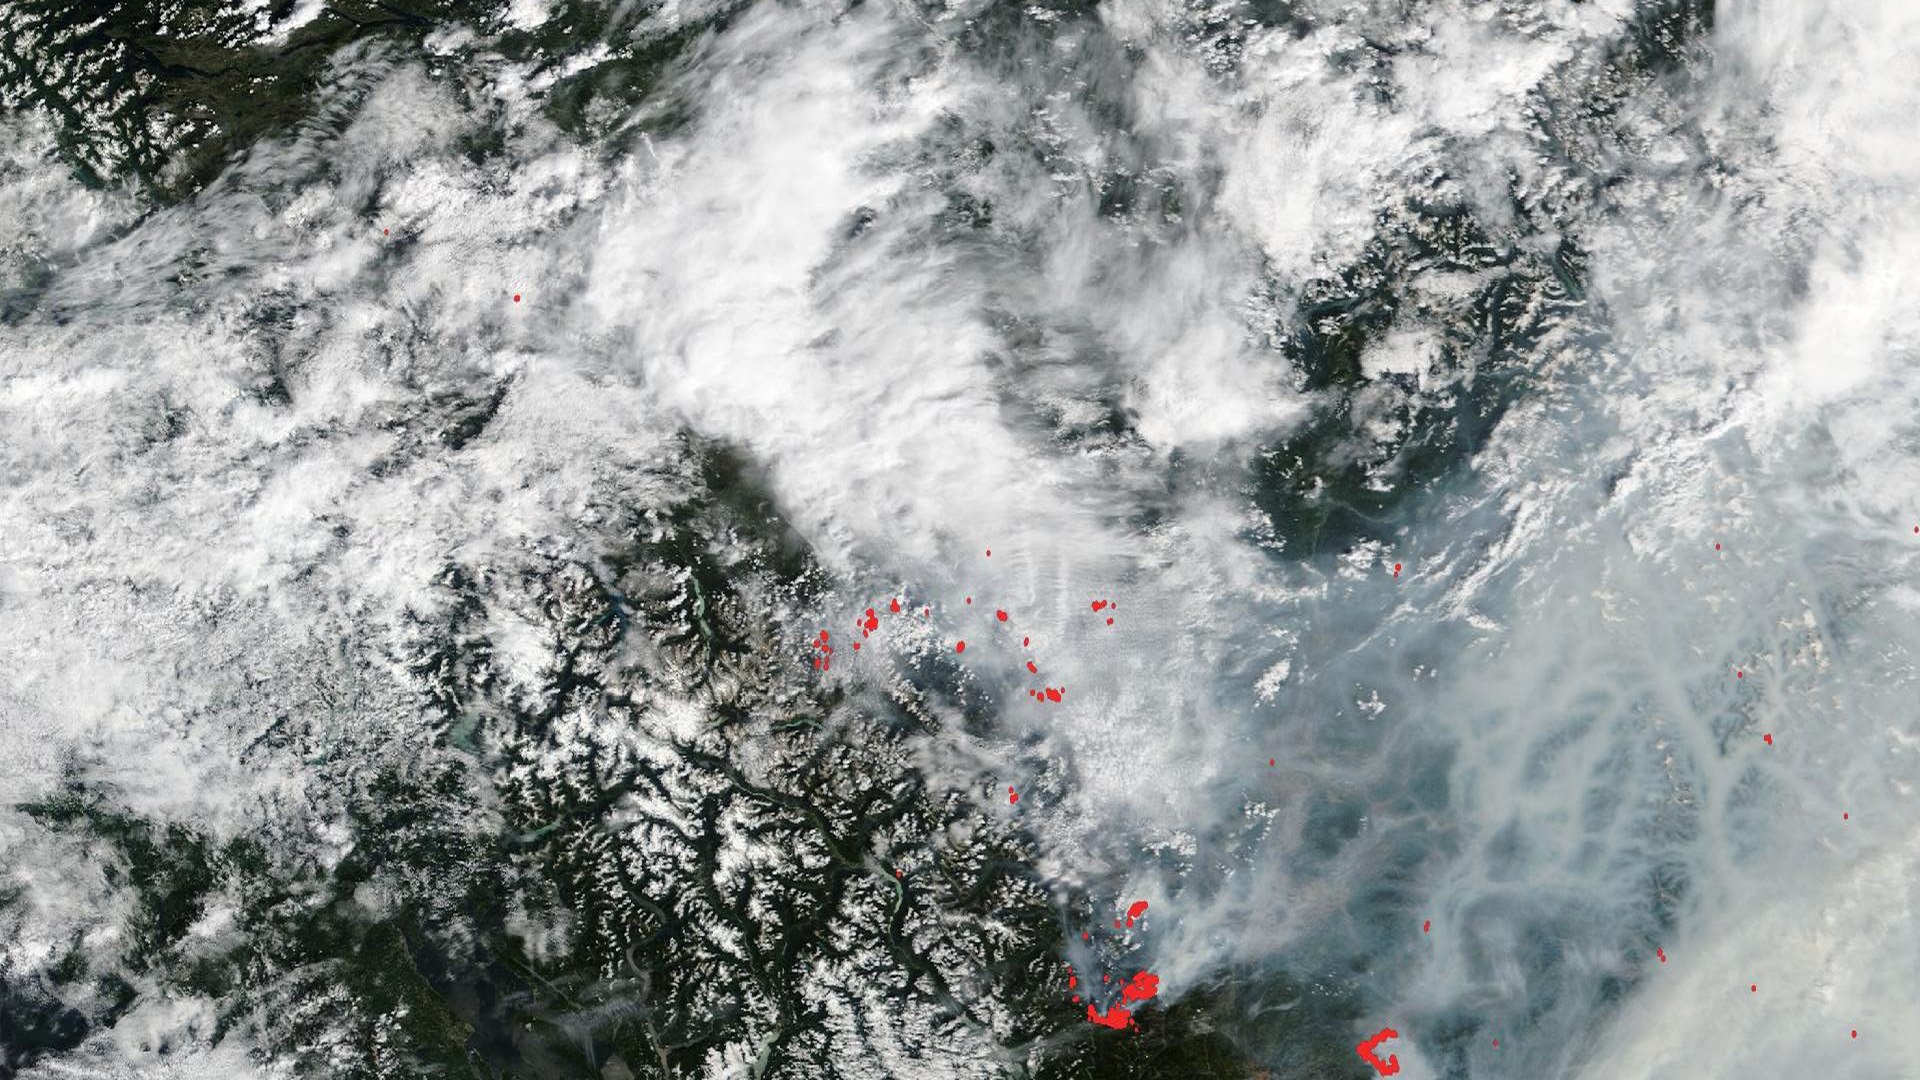
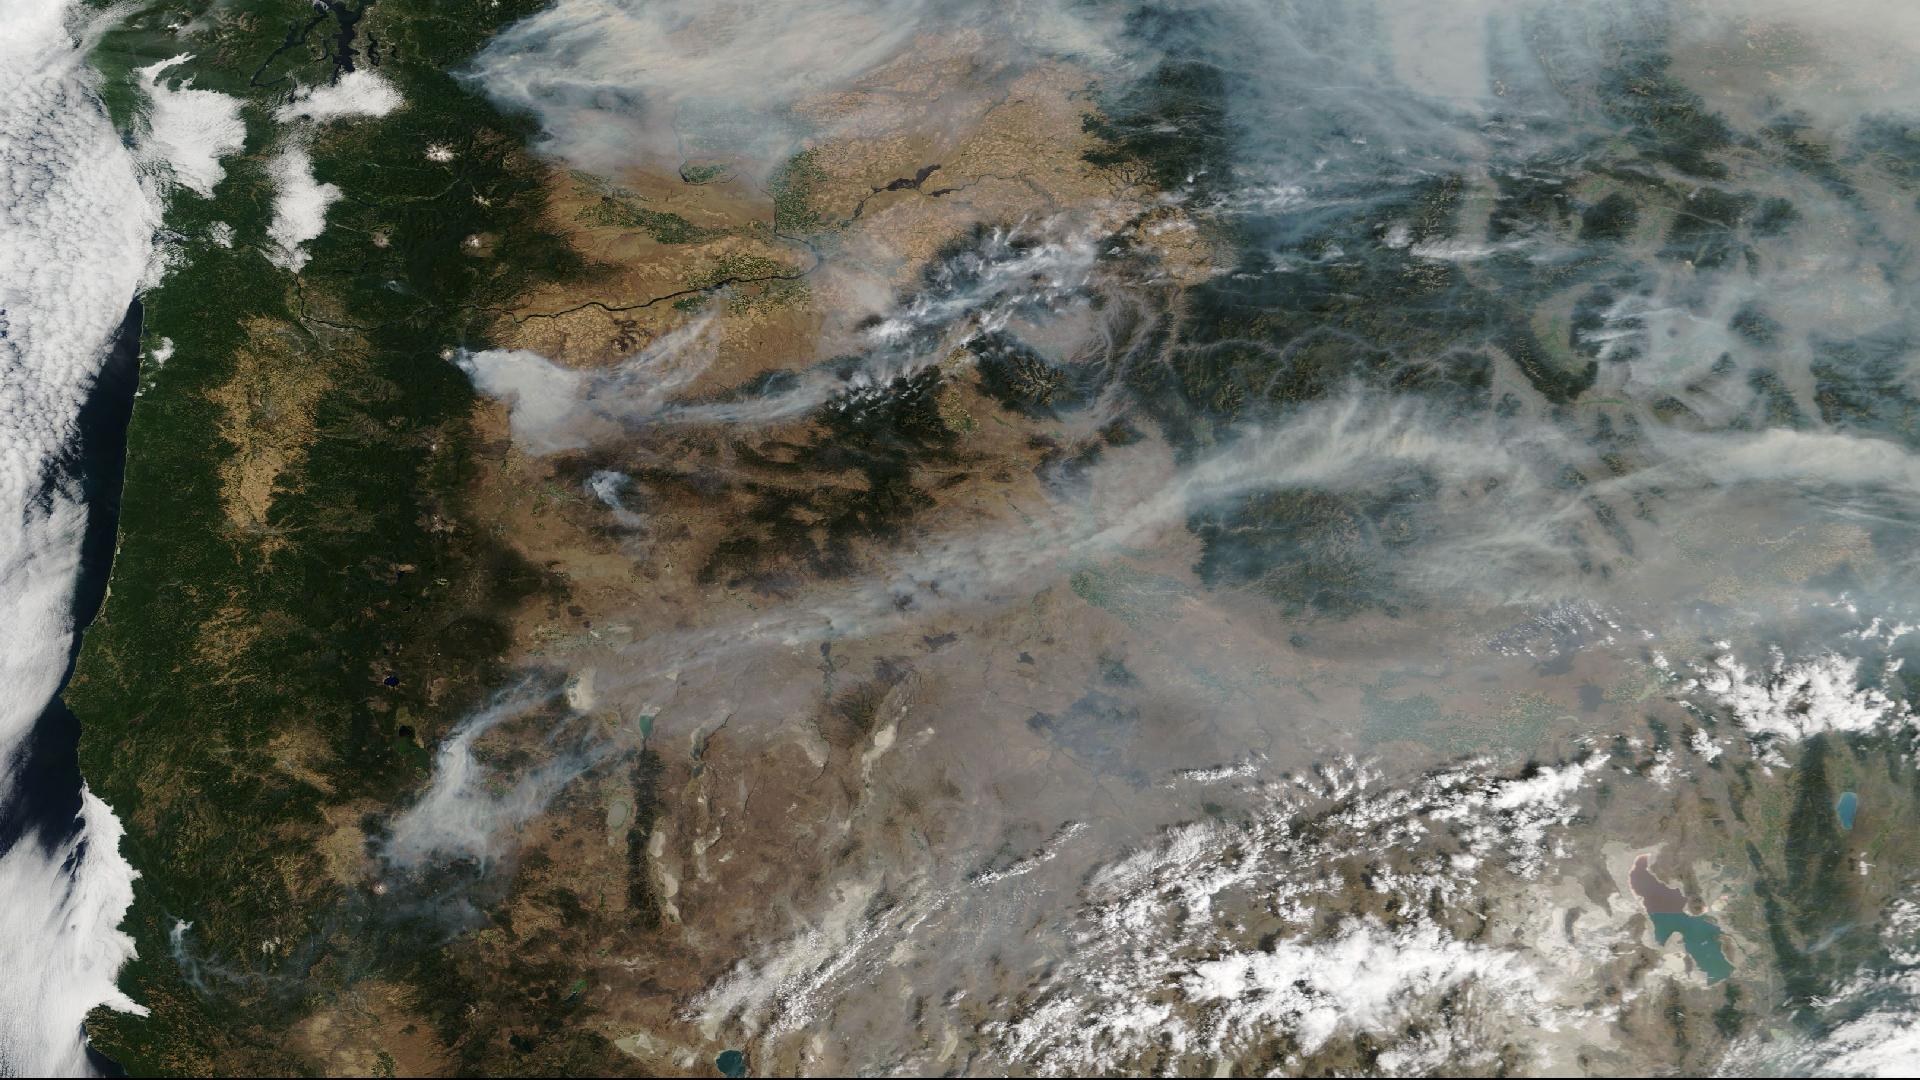
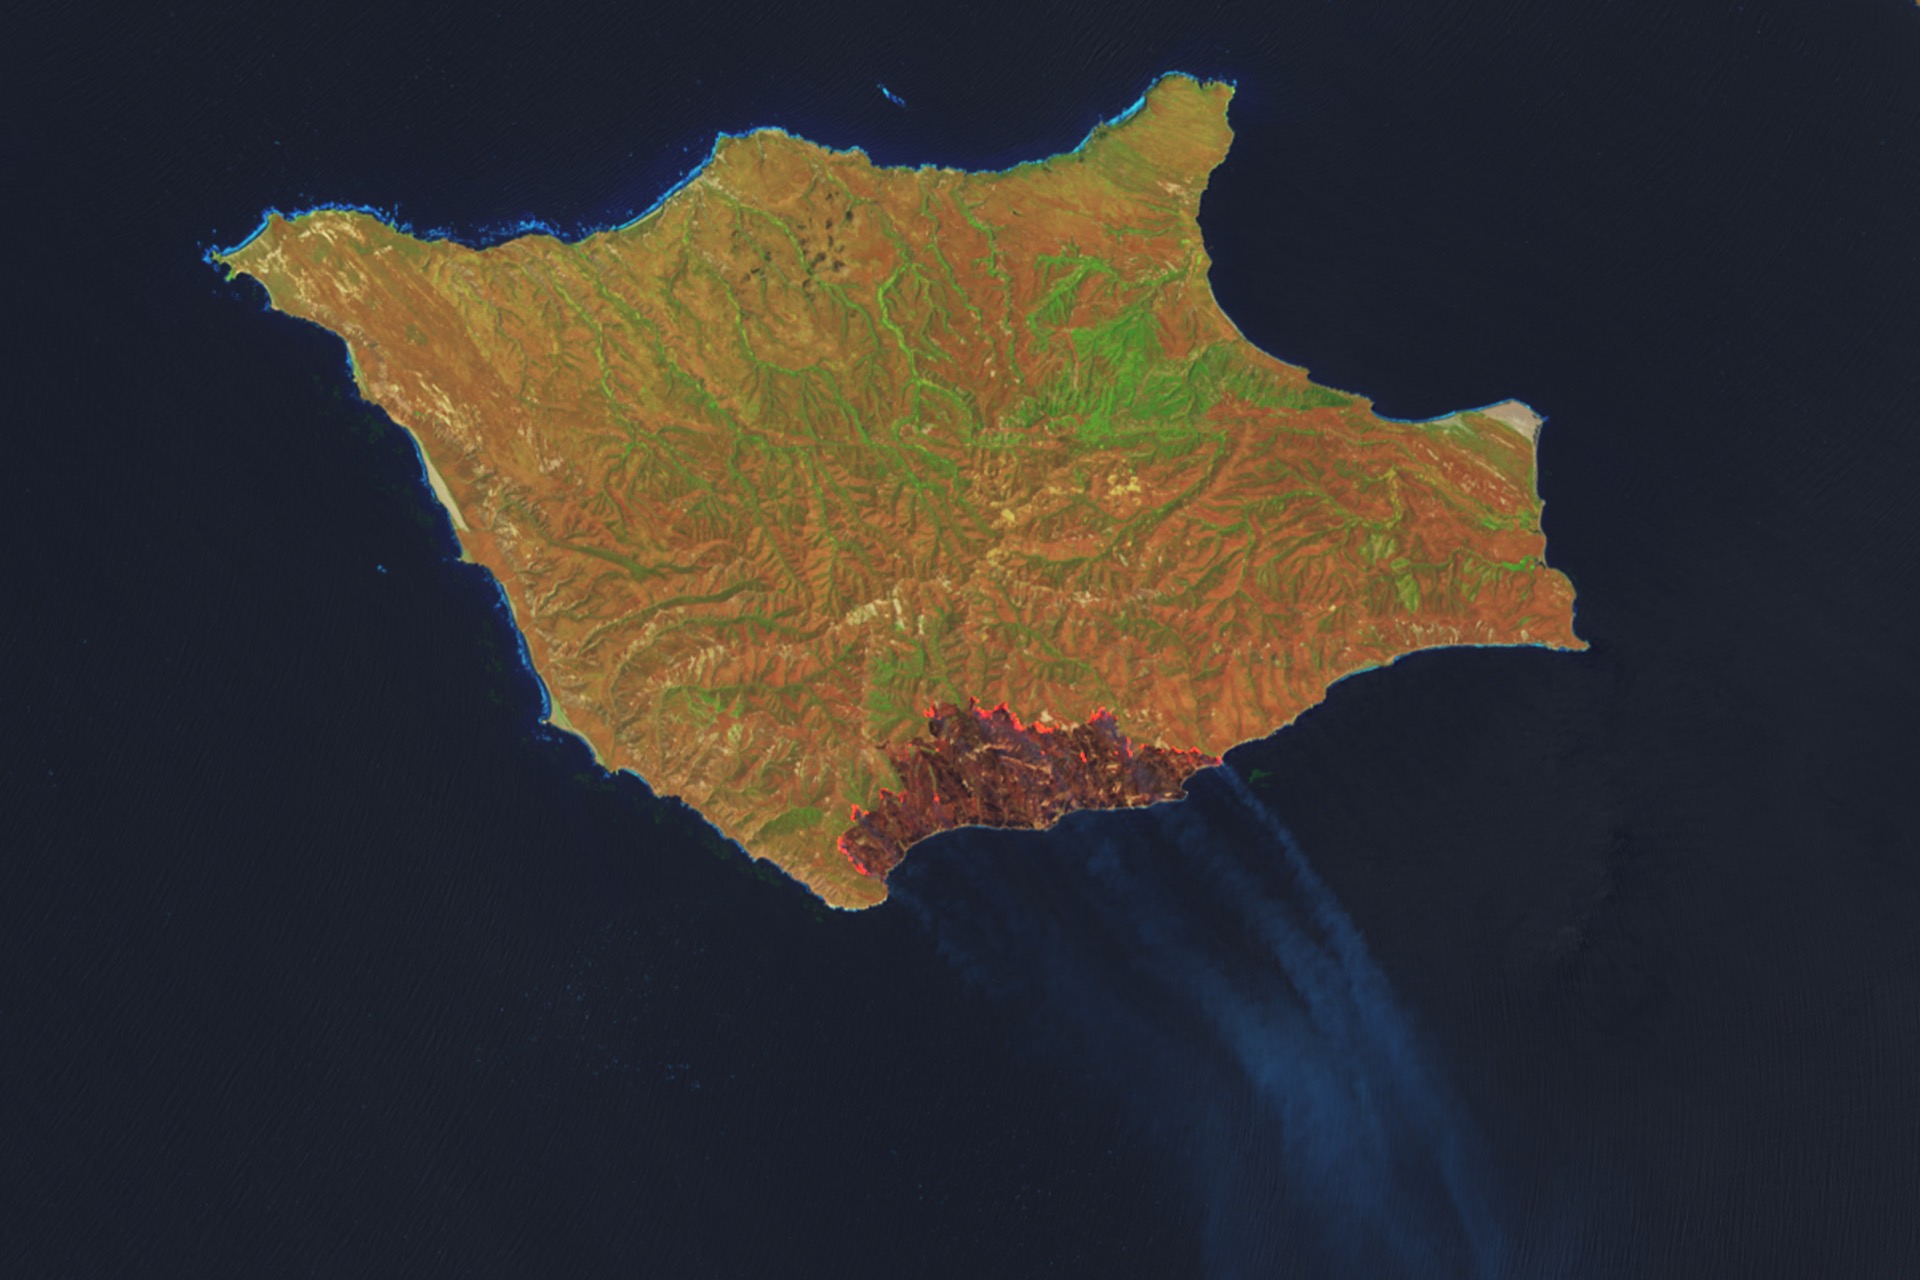
Wildfire footprints can change rapidly. An initial detected fire may cover a relatively small area before expanding significantly. Comparing the evolving perimeter against insured locations can help identify newly exposed properties and changing portfolio concentrations. For wildfire, additional intelligence such as detection time, perimeter progression, and official incident information can provide important context around the footprint.
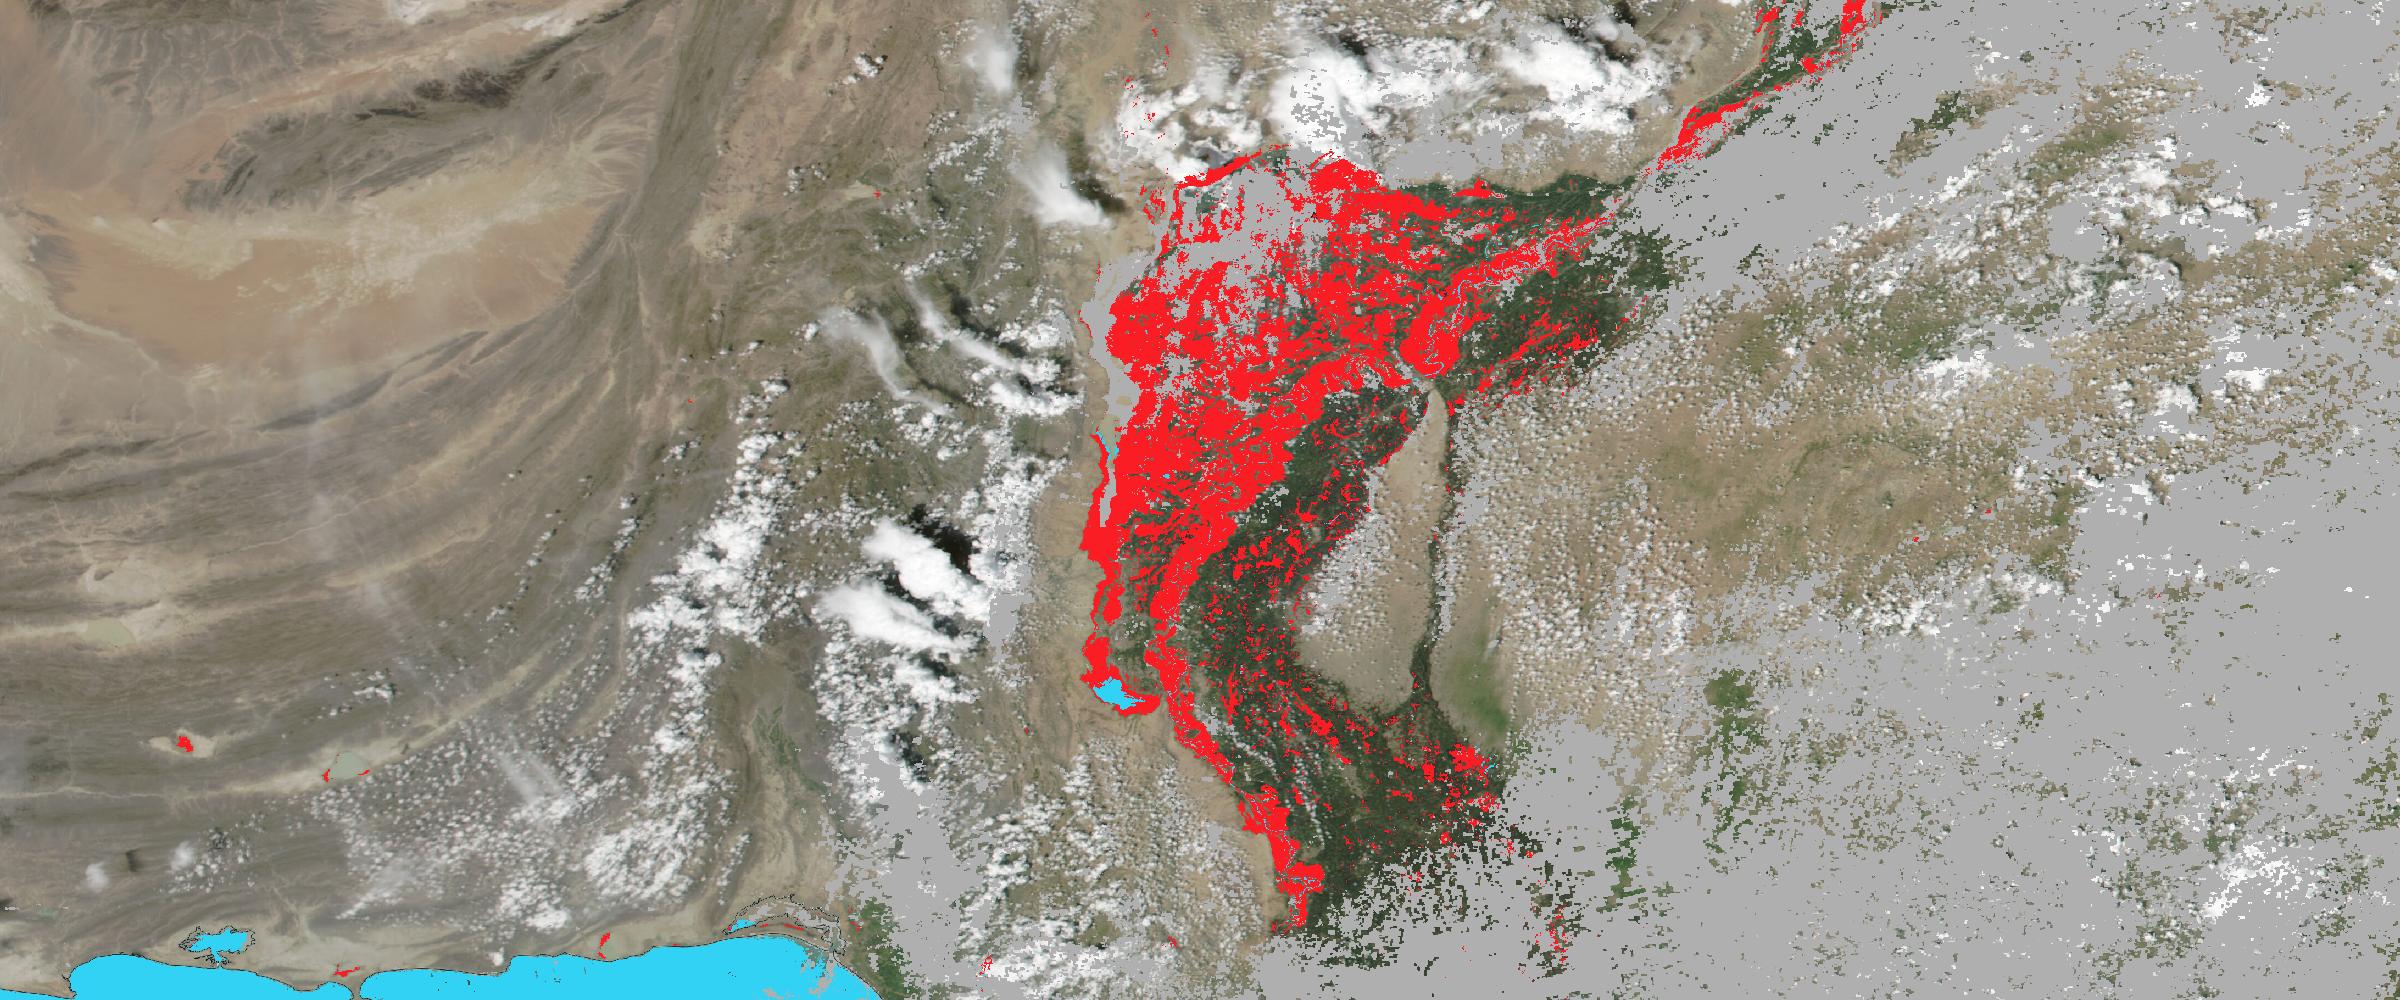
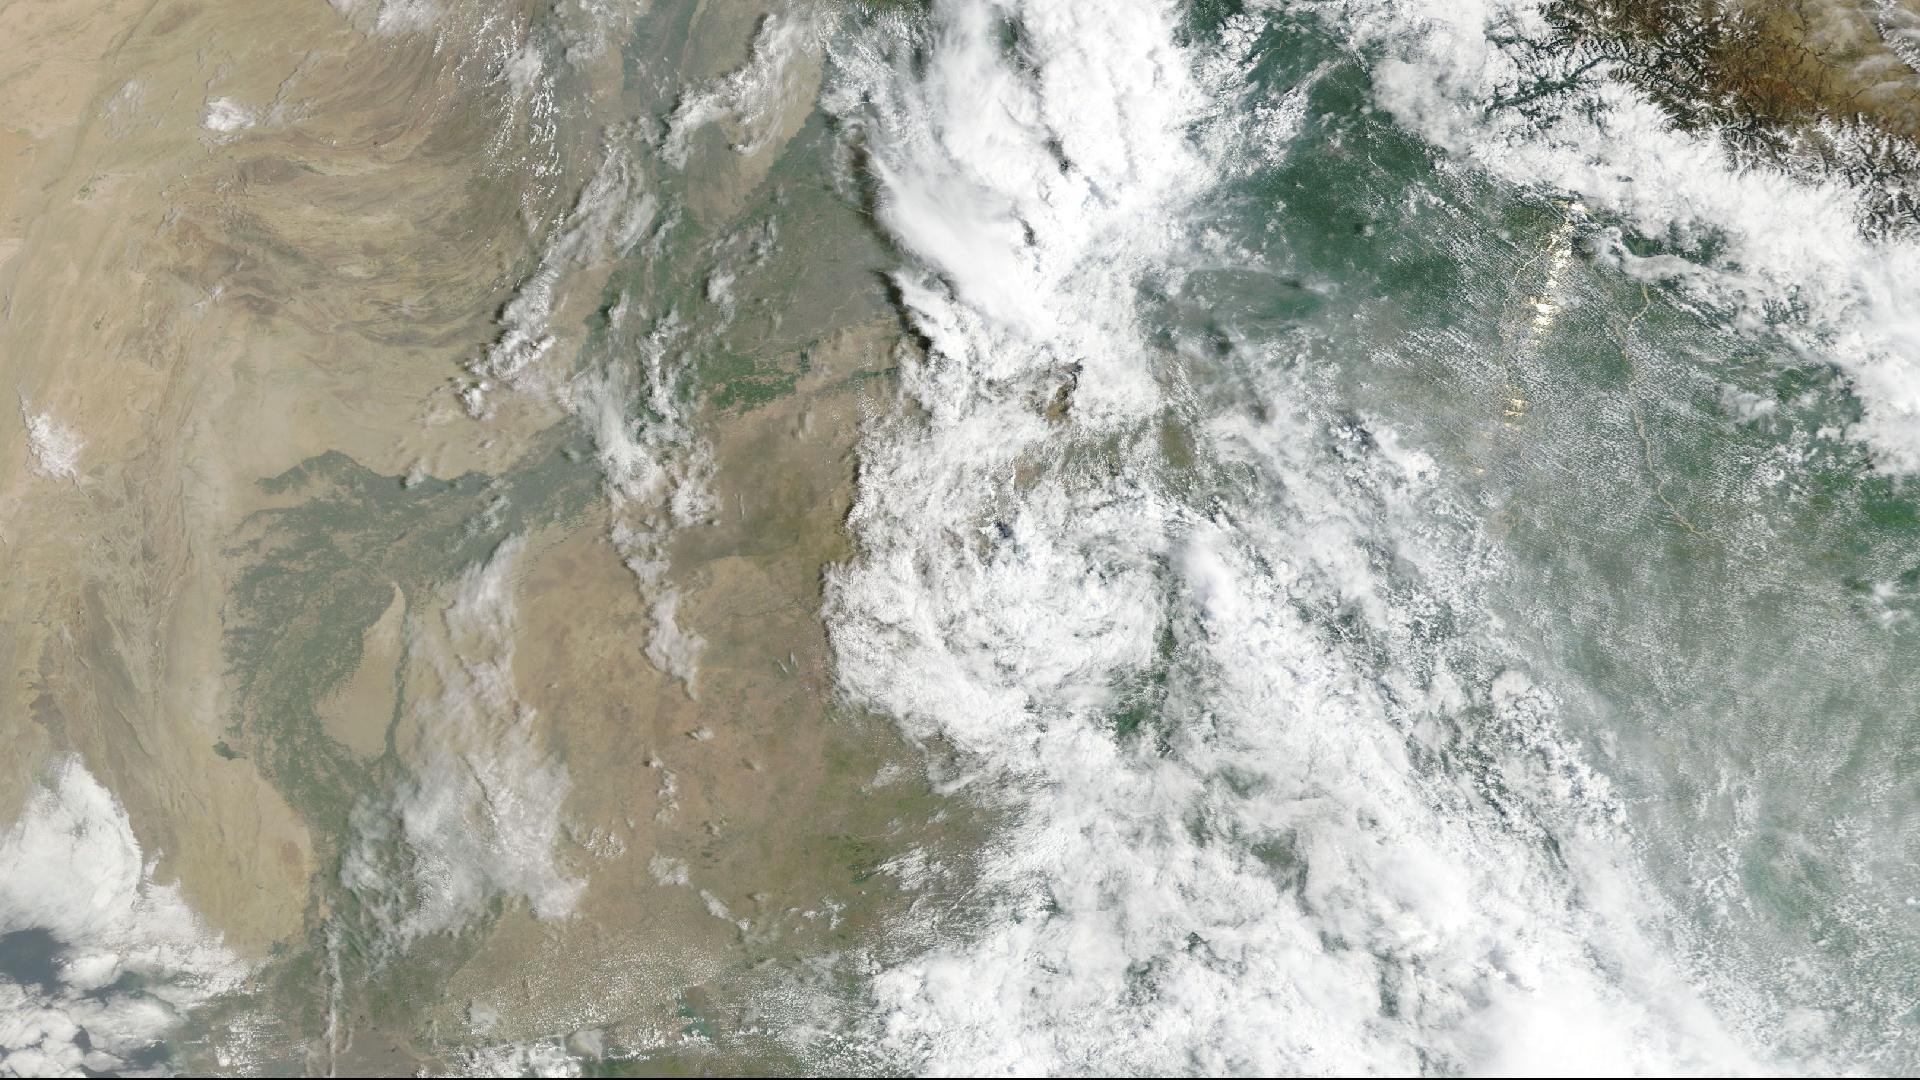
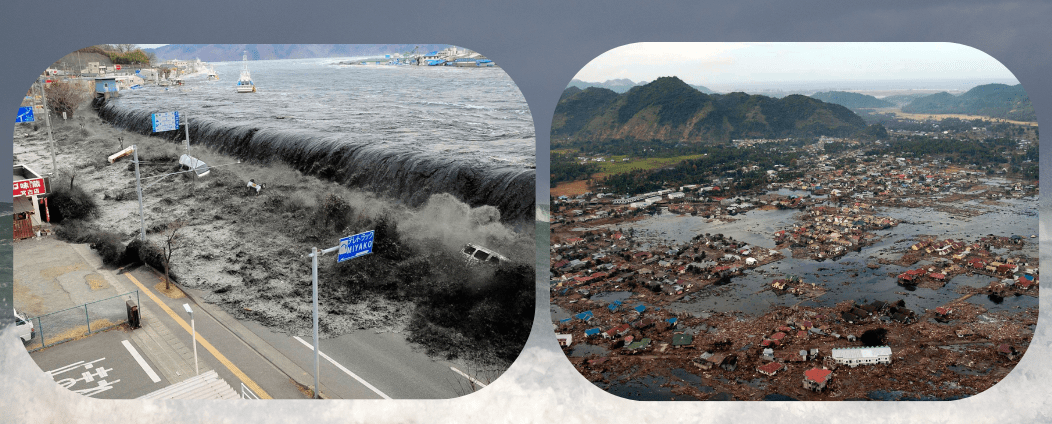
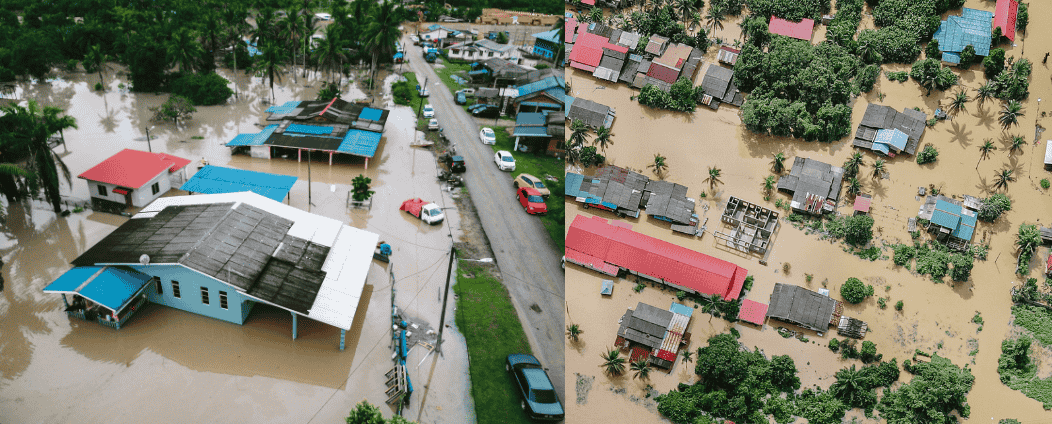
Flood footprints can help identify areas experiencing inundation and provide geographic context for potentially affected properties. Where available, information such as flood depth or extent can add another dimension to exposure analysis. A reinsurer can move beyond simply identifying properties in a geographic region to examining the relationship between the observed flood conditions and those properties.
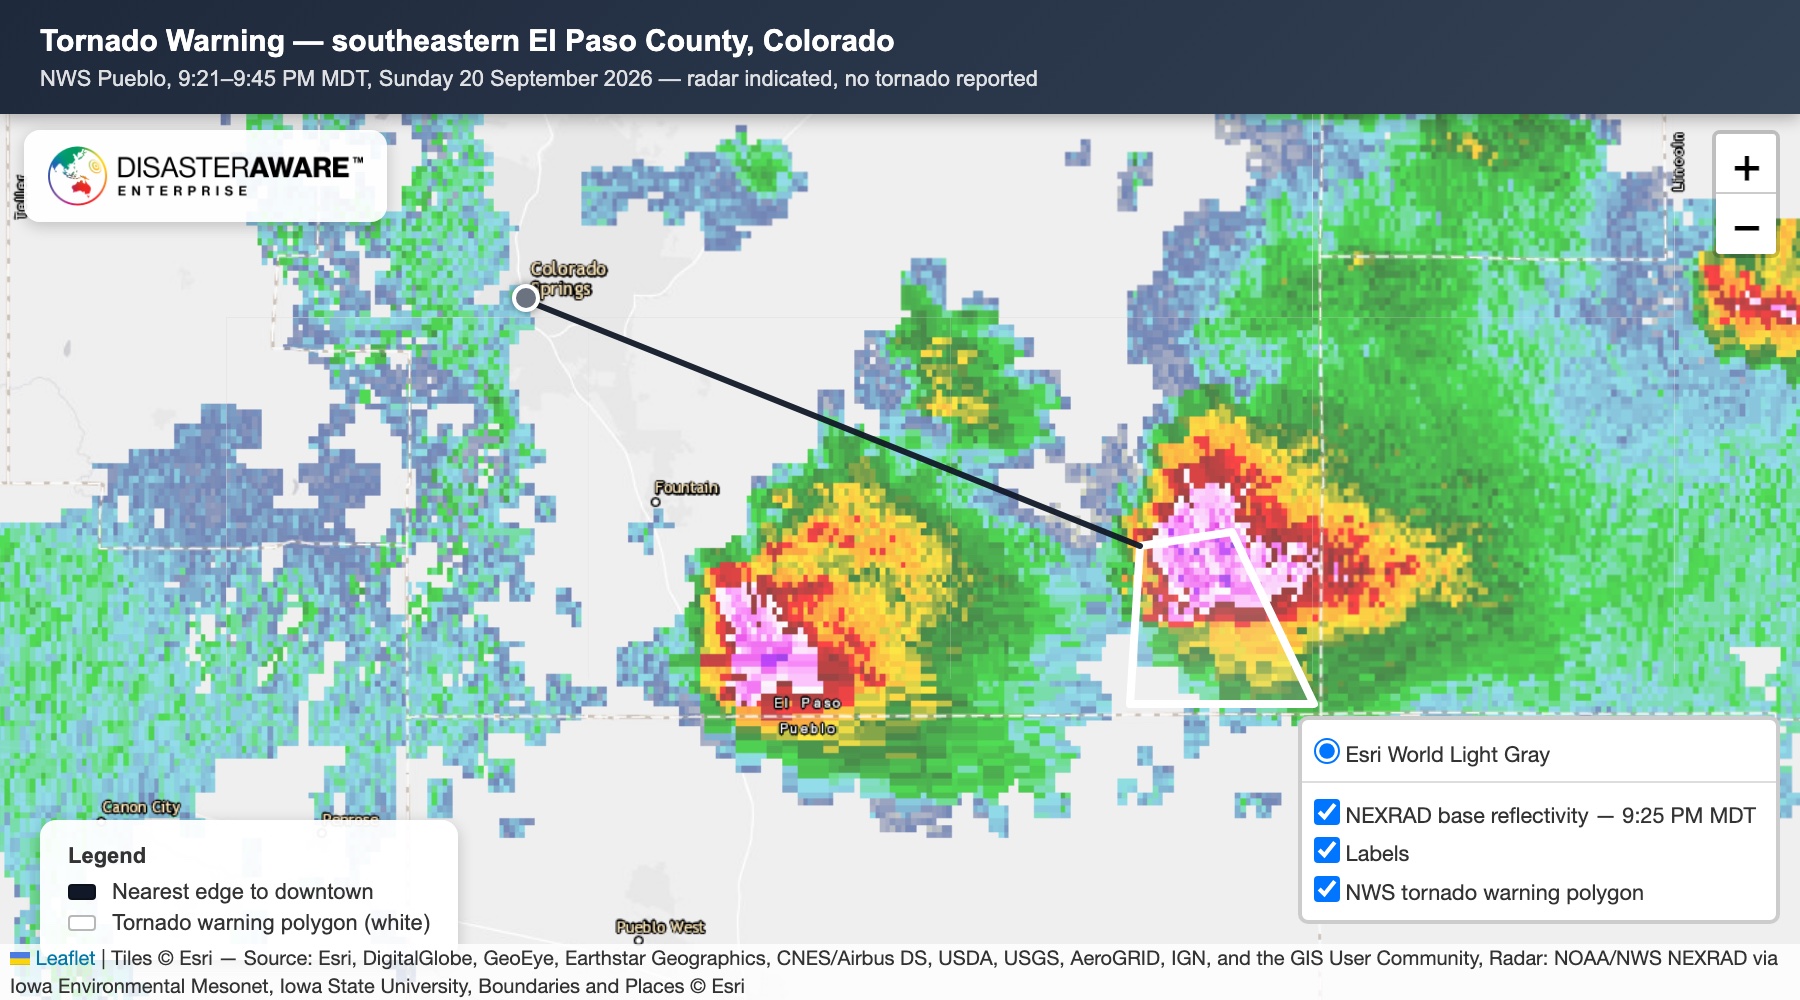
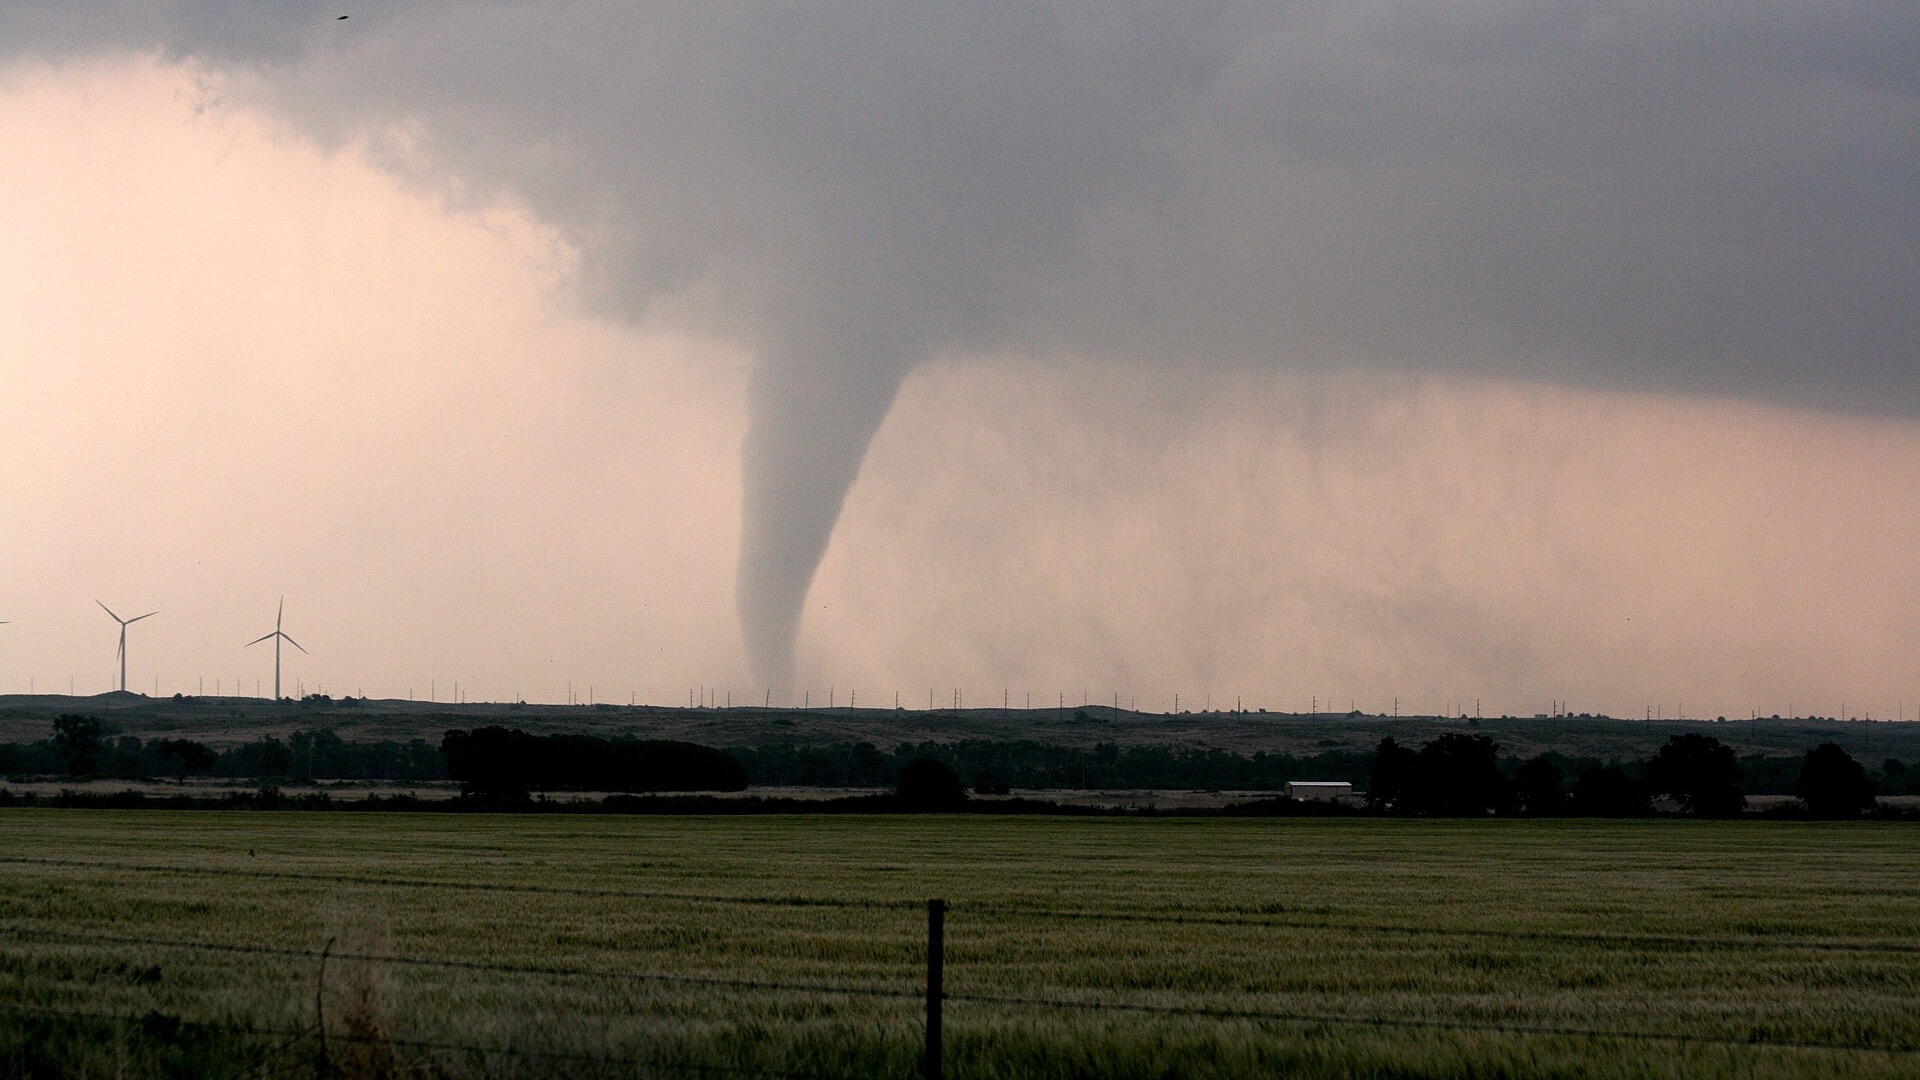
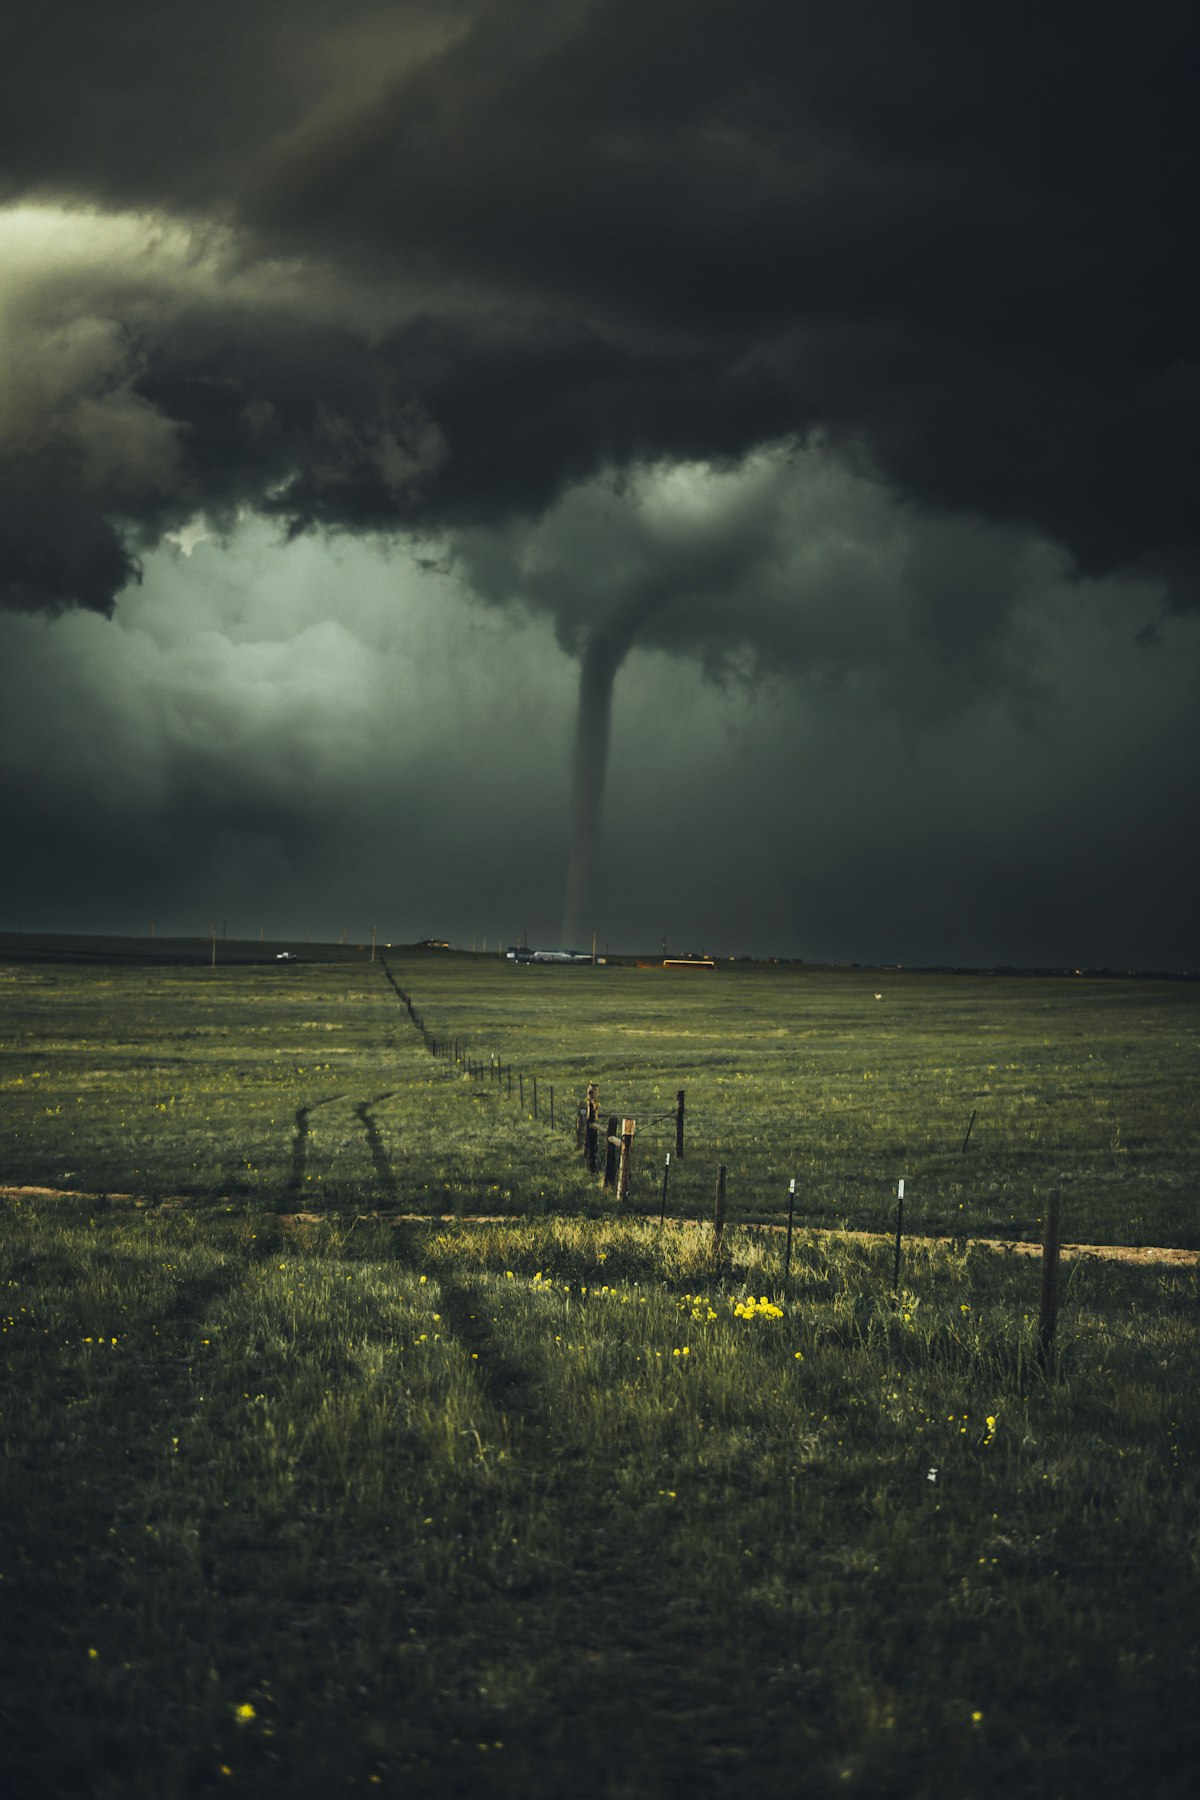
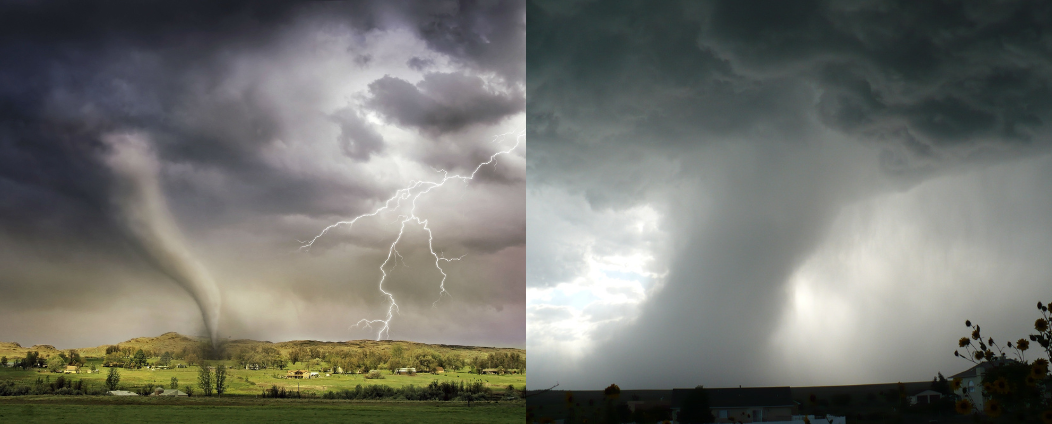
Tornadoes present a very different footprint problem. Rather than a large regional polygon, a tornado may produce a relatively narrow track. That makes geographic precision particularly important. A broad county-level designation could dramatically overstate the number of potentially affected locations compared with a more precise observed tornado path.
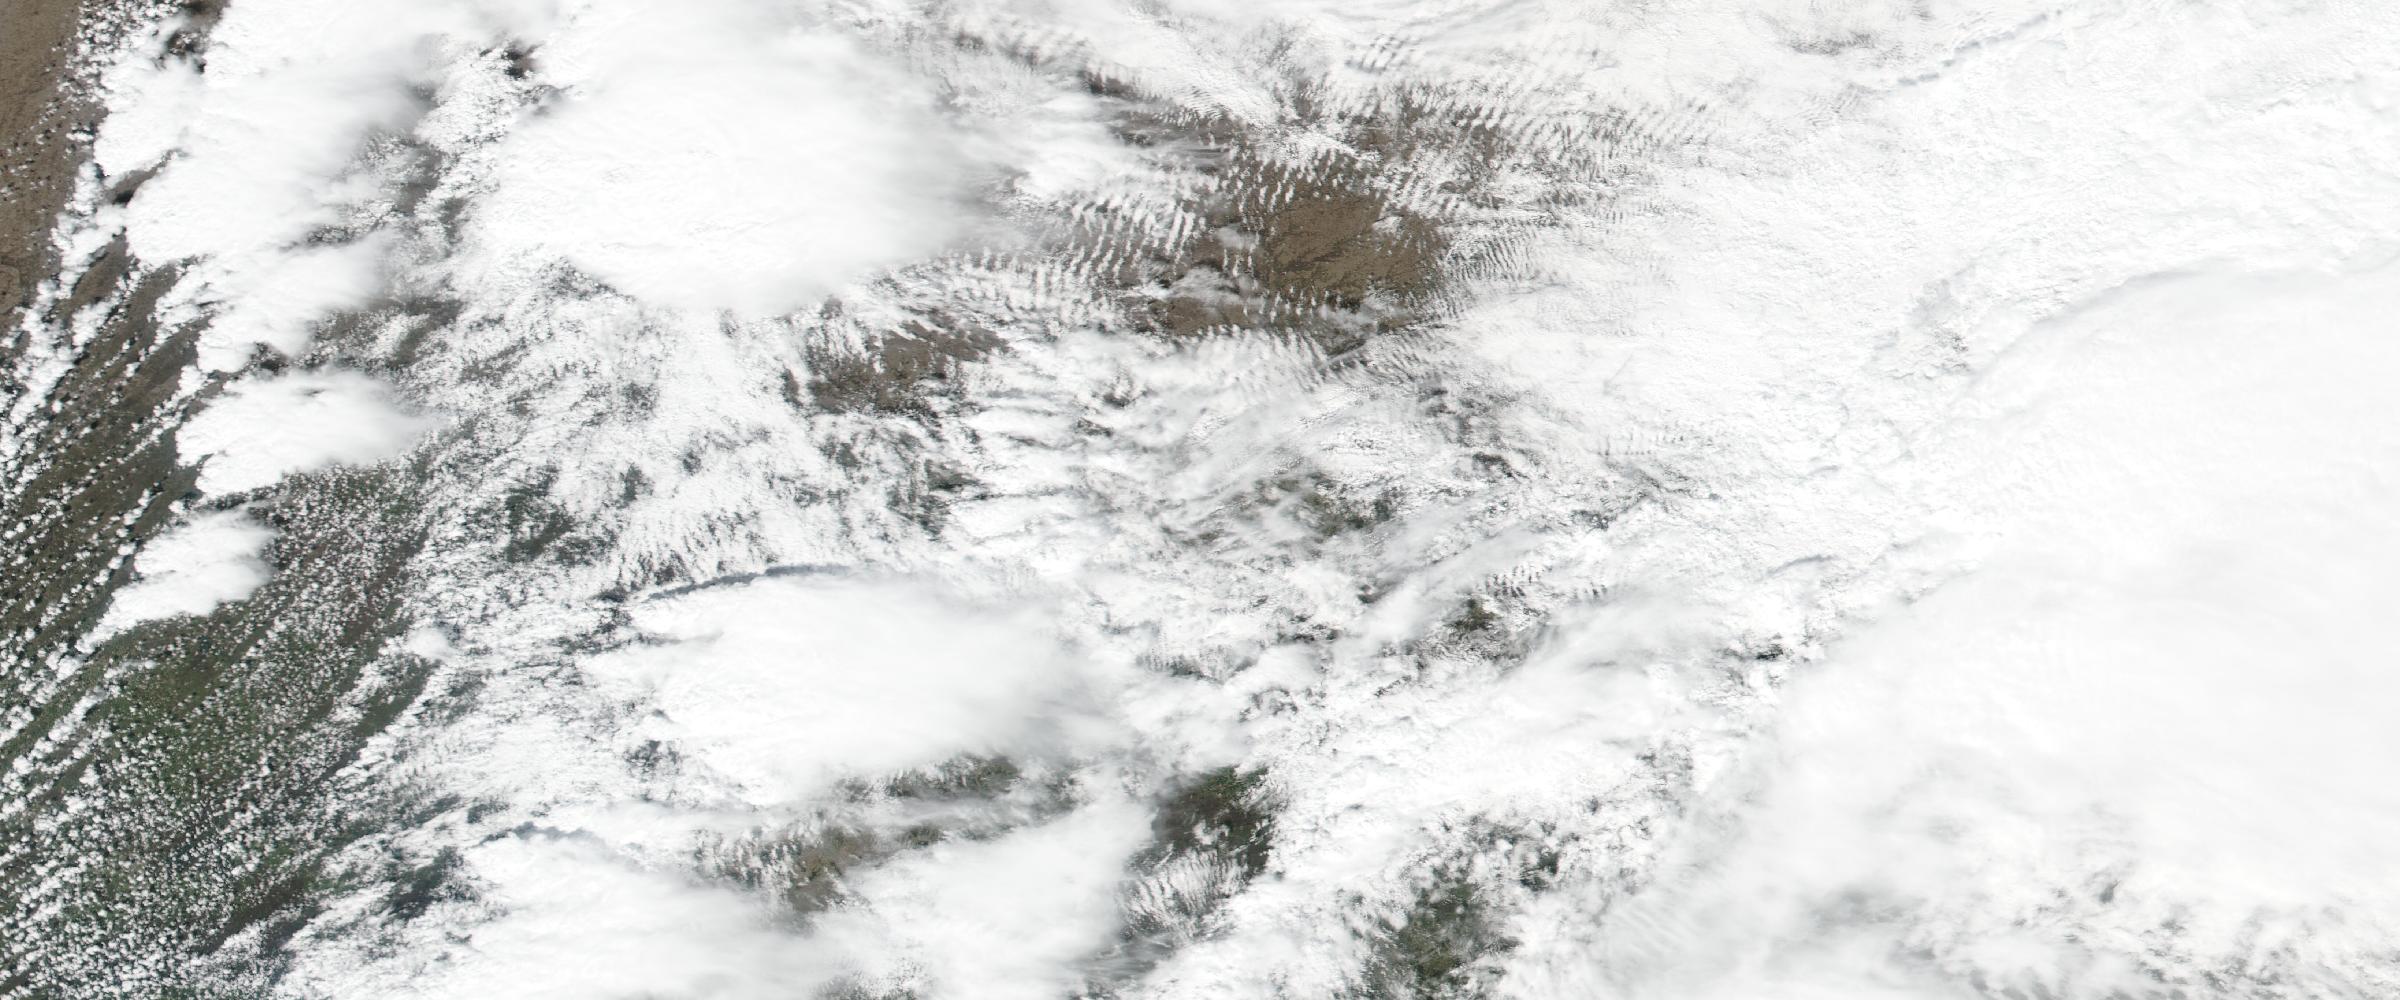
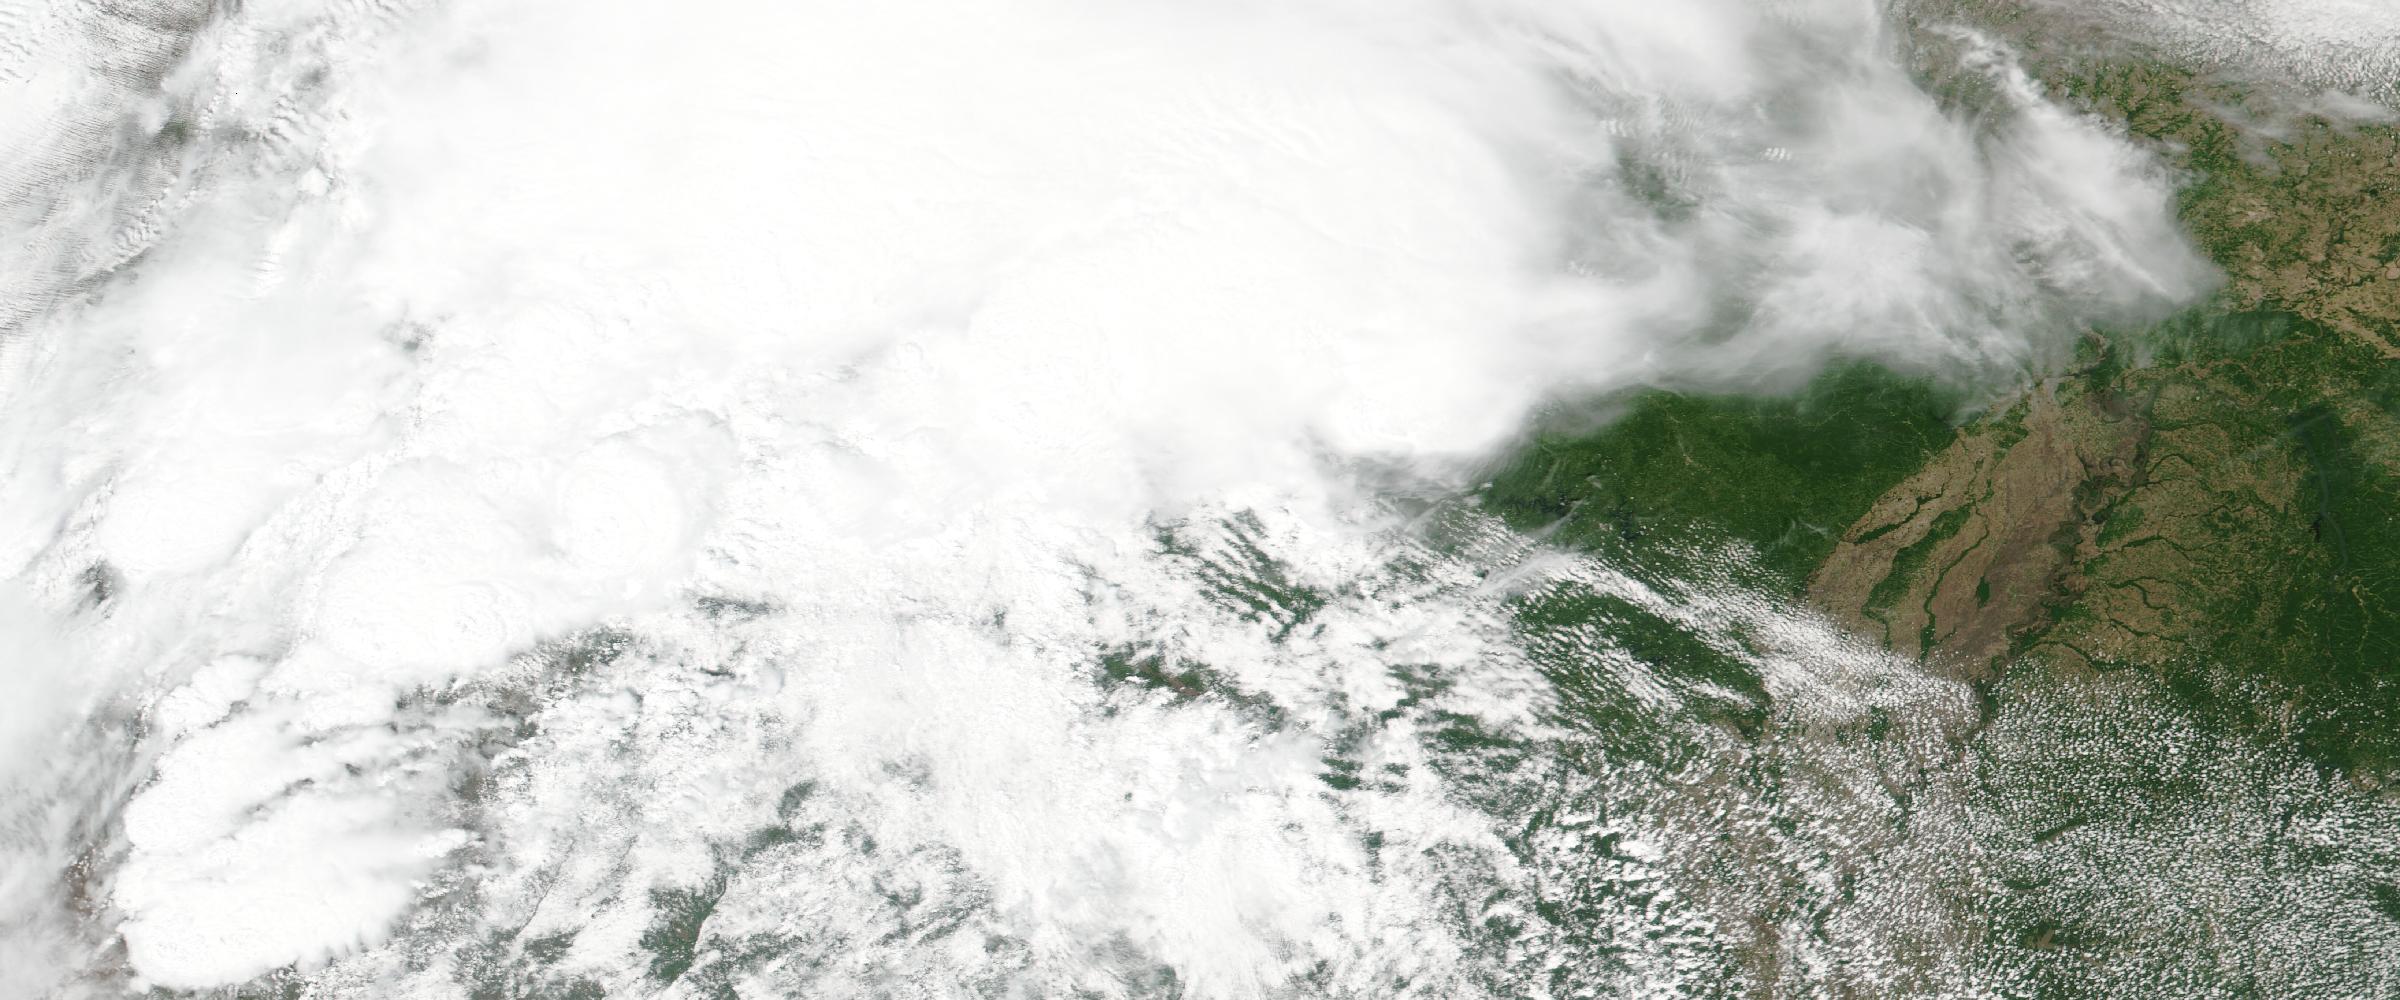
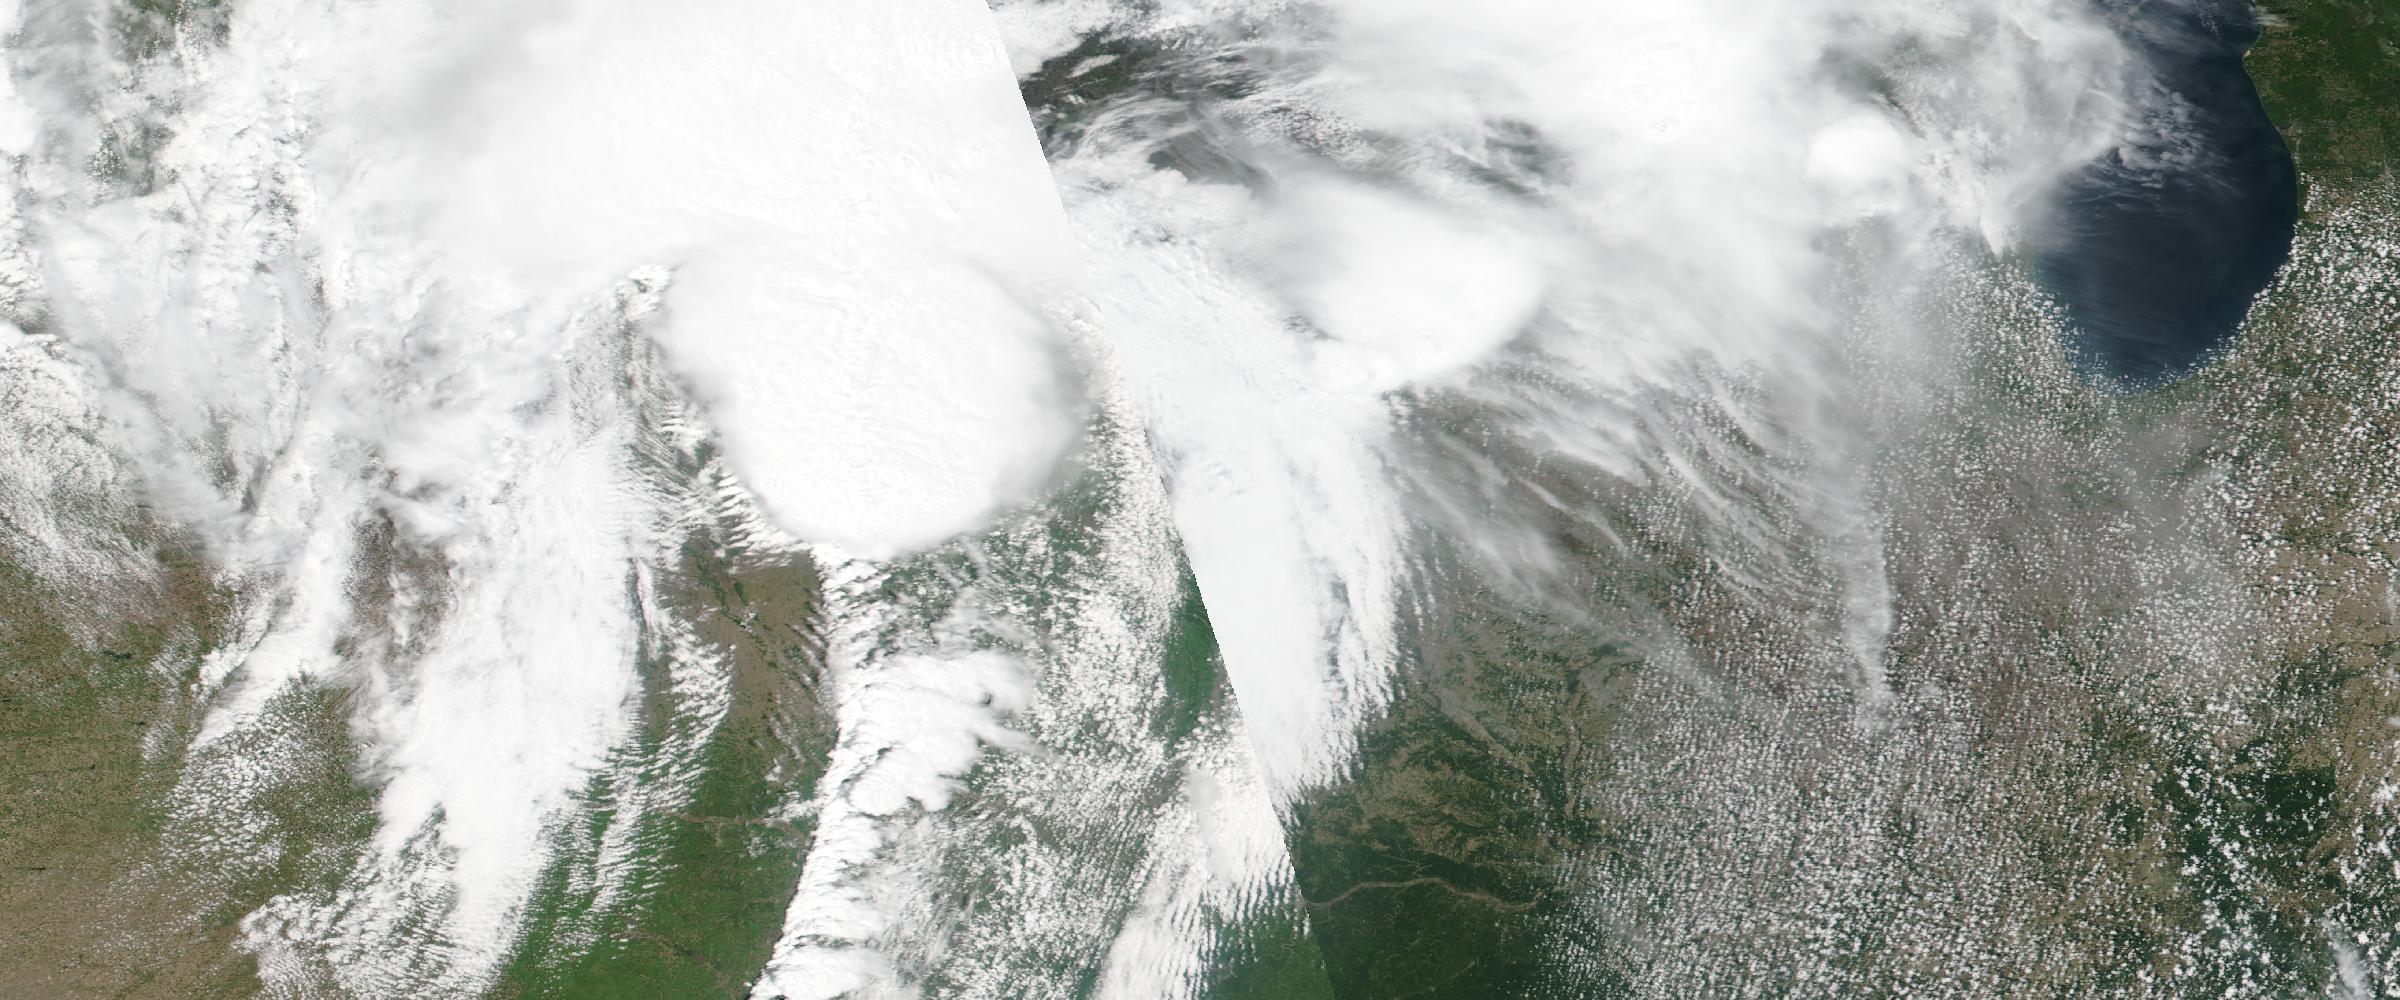
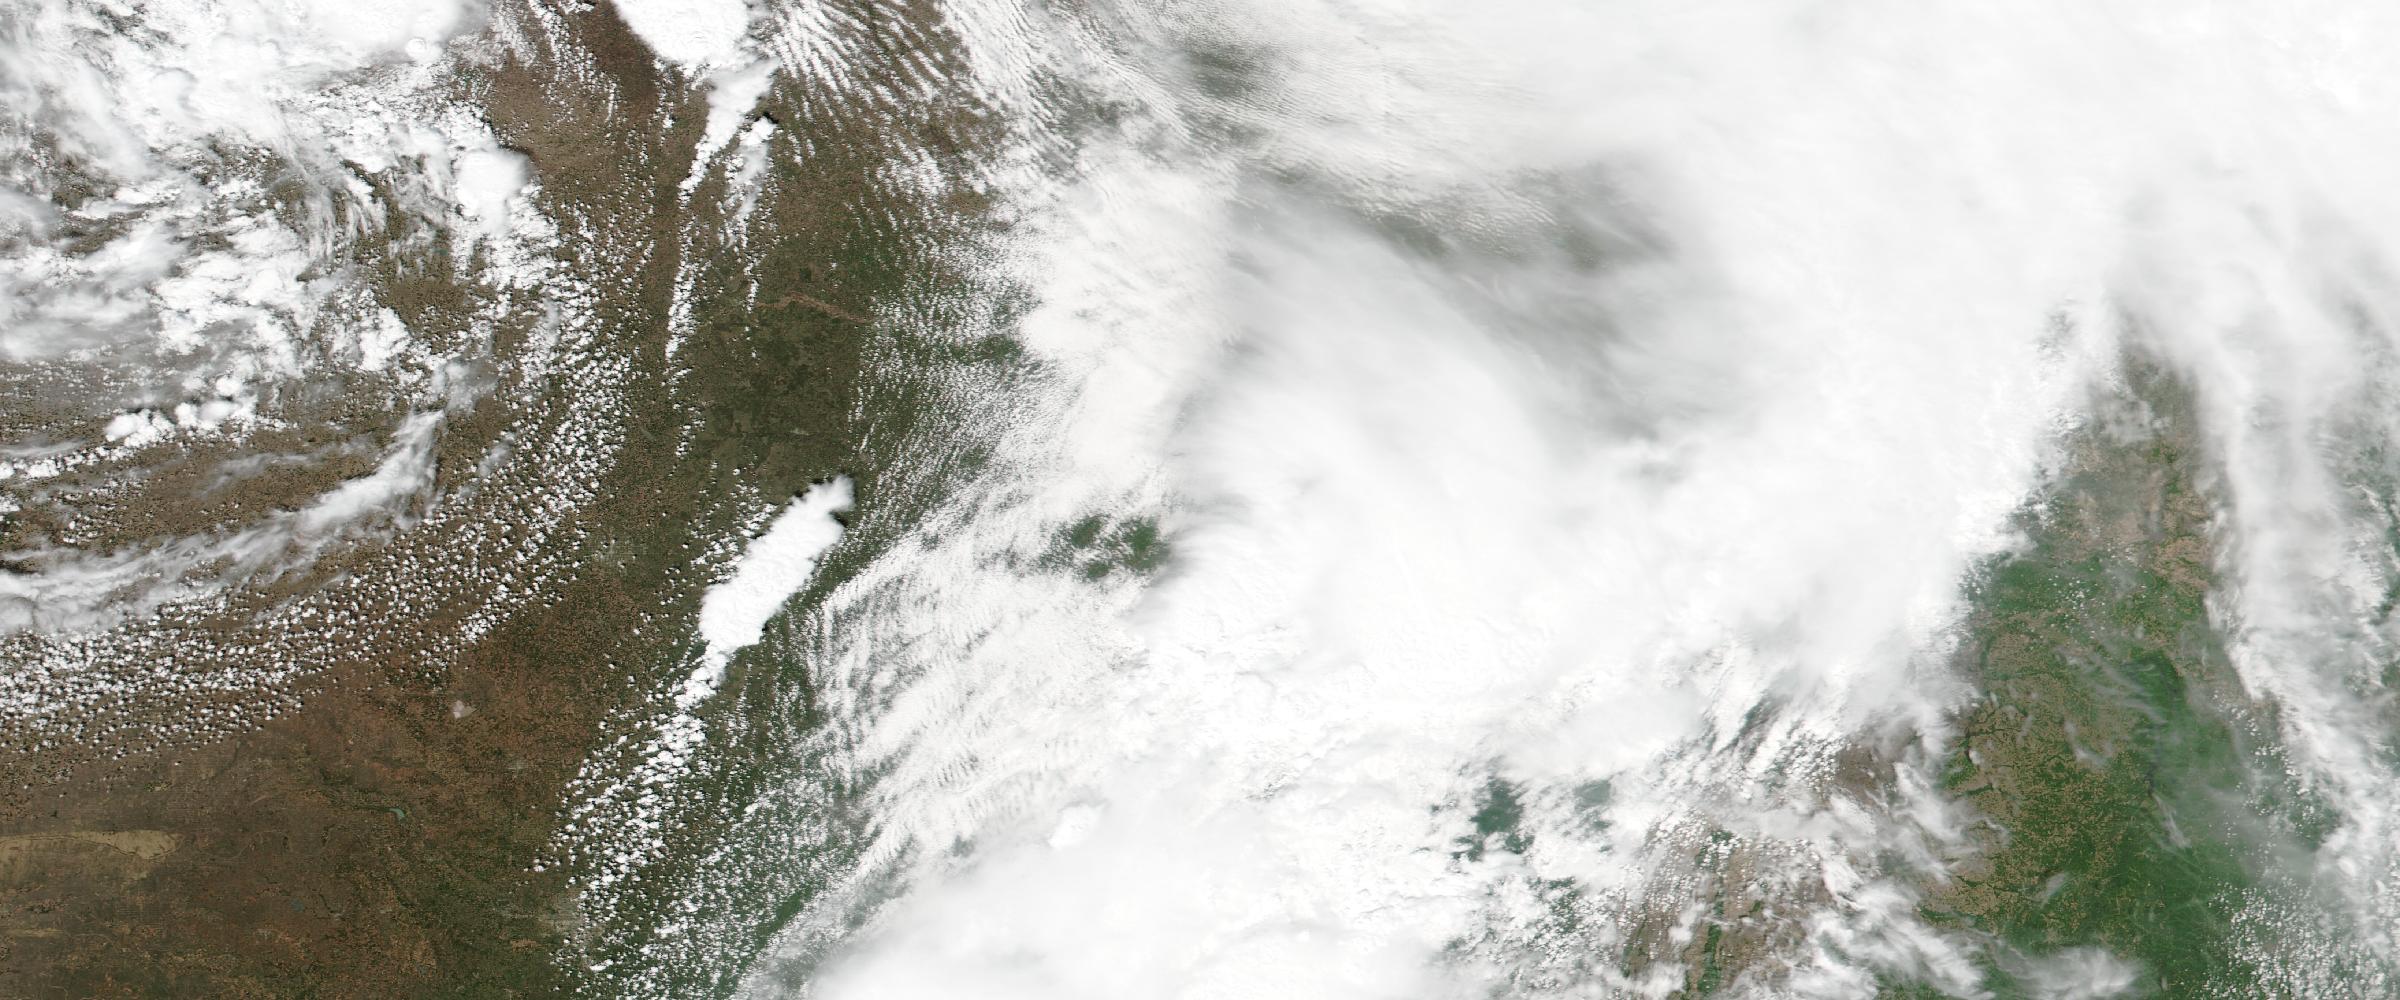
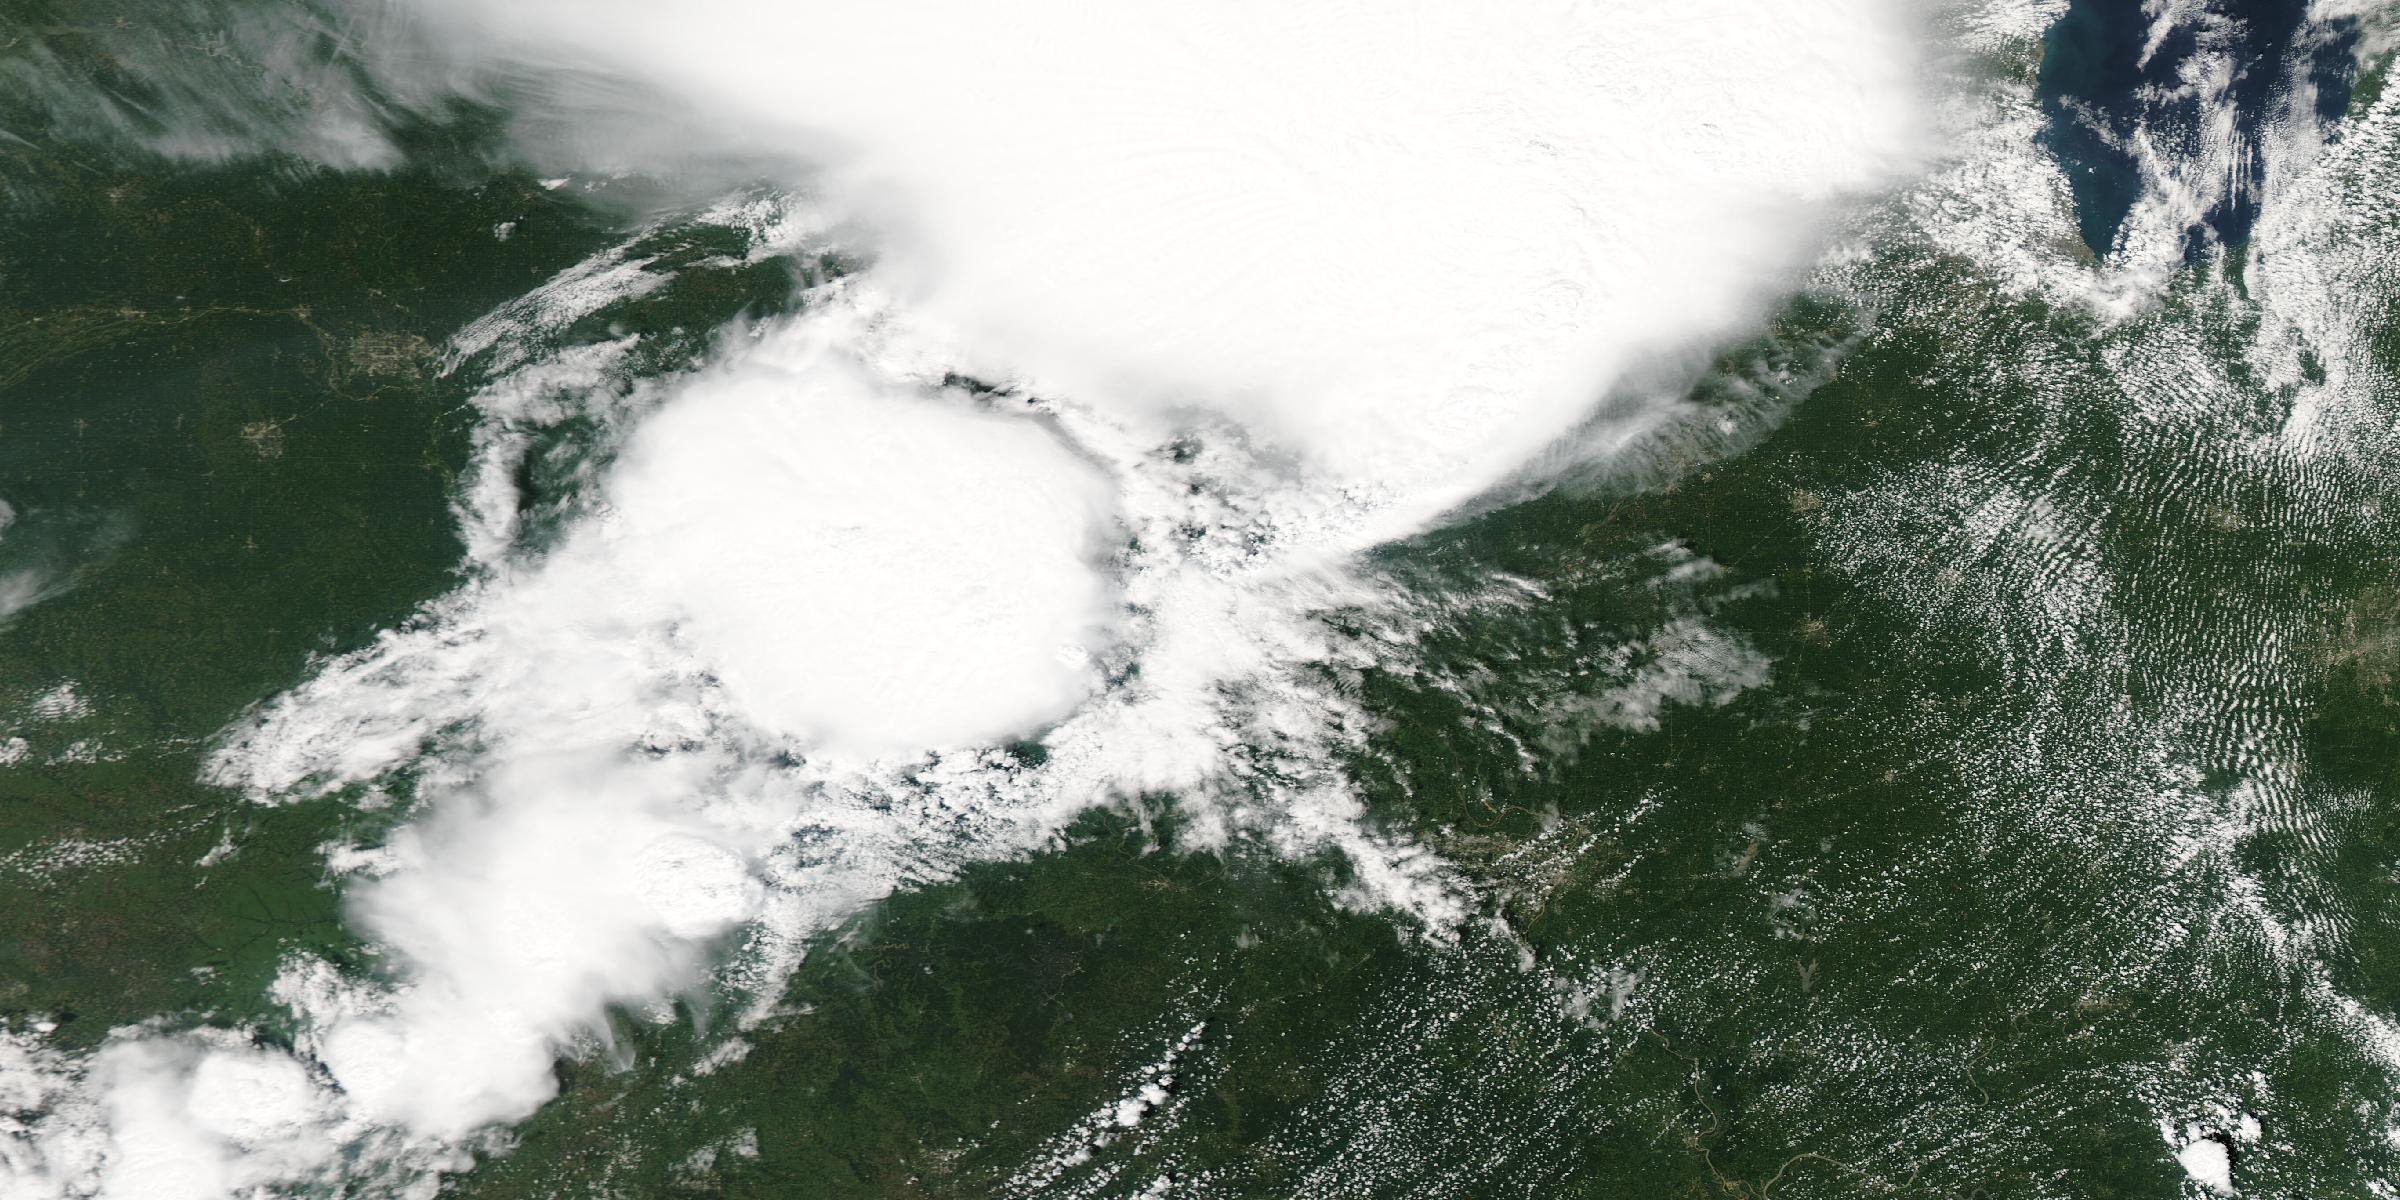
Hail can create another distinctive footprint. A storm may produce damaging hail across a broad and irregular area, with hail size and intensity varying across the storm. A hail footprint can therefore provide a more useful basis for identifying potentially affected property exposure than simply knowing that a severe thunderstorm occurred in a particular region.
Small differences in geographic precision can become significant when applied across a large reinsurance portfolio.
Imagine two ways of representing a wildfire:
Method 1: A county is identified as affected.
Method 2: The actual observed fire perimeter is mapped.
The first approach could capture thousands of locations that were nowhere near the fire. The second provides a much more targeted geographic reference for exposure analysis. This distinction becomes increasingly important as reinsurers analyze portfolios at finer geographic resolution.
The goal is not simply to identify a region associated with an event. It is to identify the portion of the portfolio that intersects with the actual hazard.
Hazard footprints can also provide a useful lens for accumulation analysis.
A reinsurer may have exposure spread across multiple cedents, programs, and lines of business. Individually, each exposure may appear manageable. When a single hazard footprint intersects multiple portfolios, however, the combined exposure can become more significant. A footprint can therefore act as a common geographic reference for analyzing accumulation across:
This is one reason event-level geographic intelligence can be useful alongside existing exposure management and accumulation systems.
The first description of a catastrophe is rarely the final one.
As additional observations become available, the understanding of the affected area can change. A wildfire expands. A storm changes direction. Flooding extends into additional areas. A tornado track is refined after additional observations.
For reinsurance teams, updated footprints can therefore provide a progressively more detailed representation of the event.
That can help teams revisit exposure calculations as the event develops rather than relying entirely on an initial assessment.
It is also important to distinguish between an observed hazard footprint and a modeled hazard area. A model may estimate where a hazard could occur or how a hypothetical event might affect an area. An observed footprint describes what was detected or measured during an actual event.
Both have important uses.
For portfolio management and risk assessment, modeled scenarios can help understand potential future exposure. For event response and post-event analysis, observed footprints provide a geographic record of the catastrophe that actually occurred.
The two can also be compared.
For example:
Modeled Scenario → Observed Event → Footprint Comparison → Portfolio Analysis
That comparison can provide additional context for understanding how an actual catastrophe differed from expectations.
Hazard footprints also become more valuable when they can be analyzed historically. A collection of historical footprints allows reinsurers to examine actual events rather than relying solely on event descriptions or point-based records. Teams can investigate questions such as:
This creates a historical geographic record of catastrophe activity that can support portfolio analysis, research, underwriting, and accumulation management.
The most important concept is simple:
A catastrophe does not create exposure simply because it occurs in a region. Exposure exists where the hazard intersects with insured locations.
That makes the hazard footprint a critical geographic bridge.
It connects:
Hazard → Footprint → Exposure → Accumulation → Potential Loss
The more precisely that bridge can be established, the more targeted the subsequent analysis can become.
For reinsurers managing complex portfolios, that distinction can make event information significantly more actionable.
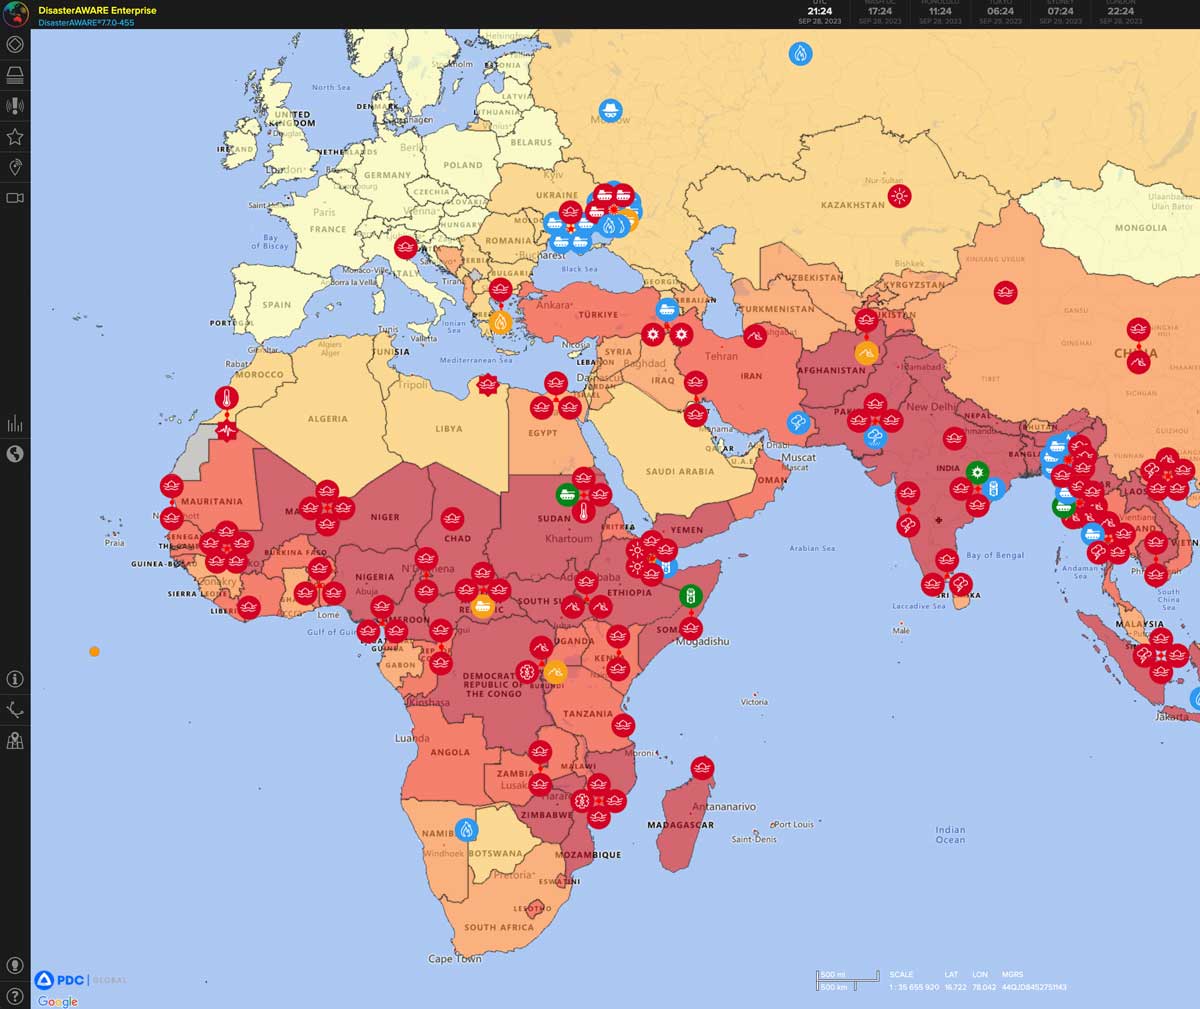
DisasterAWARE provides real-time and historical hazard intelligence that can help organizations understand the geographic characteristics of natural catastrophe events.
Its event intelligence can include observed hazard footprints and geospatial information across multiple peril types, providing an event-level geographic layer that can be used alongside exposure data, portfolio analytics, catastrophe models, and other reinsurance systems.
The objective is not simply to show where a catastrophe happened.
It is to provide the geospatial intelligence needed to understand how the event intersects with the exposures that matter.
Explore the historical record
Decades of reconstructed, verified catastrophes — browse the Historical Event Intelligence overview, or request sample data for your own portfolio.
What is a hazard footprint? A hazard footprint is a geographic representation of the area affected by a specific natural hazard event — a wildfire perimeter, a flood extent, a tornado track or a hail swath, depending on the peril. It can be compared against exposure data to show which insured locations may have been exposed.
Why do hazard footprints matter to reinsurers? Reinsurance portfolios hold very large numbers of locations across many geographies and cedents. A footprint lets a reinsurer move from a broad regional view to the specific exposure that intersected the event — and reveal accumulations that span multiple cedents or programs.
Is an observed footprint the same as a modeled hazard area? No. A model estimates where a hazard could occur or how a hypothetical event might affect an area. An observed footprint describes what was detected or measured during an actual event.









-min.png)
.png)
.png)



Decision-ready intelligence for understanding what's happening, what is impacted, and what to do next. Global hazard, severe weather, catastrophe, and physical risk intelligence trusted by governments, enterprises, insurers, humanitarian organizations, and technology platforms worldwide.
Request DemoContact Us

