Floods are one of the most disruptive natural disasters causing major economic damage each year. NOAA reported that billion-dollar disaster events have cost the U.S. around $2.95 trillion since 1980, and floods account for tens of billions annually. A study by the U.S. Senate Joint Economic Committee estimates the total economic burden of flooding in the U.S. ranges between $179.8 and $496.0 billion annually.
DisasterAWARE supports early action and faster decision-making through real-time global monitoring of all major flood types—riverine, coastal, and flash flooding. It combines authoritative data from national agencies with a NASA-backed global flood forecasting model, giving users a forward-looking view into flood risks and potential impacts.

Flood behavior is highly localized—shaped by terrain, drainage, and infrastructure. To provide timely insights, DisasterAWARE automatically generates flood reports whenever partner agencies update their forecasts. These include detailed, region-specific information such as flooded counties, river gauges, and severity estimates.
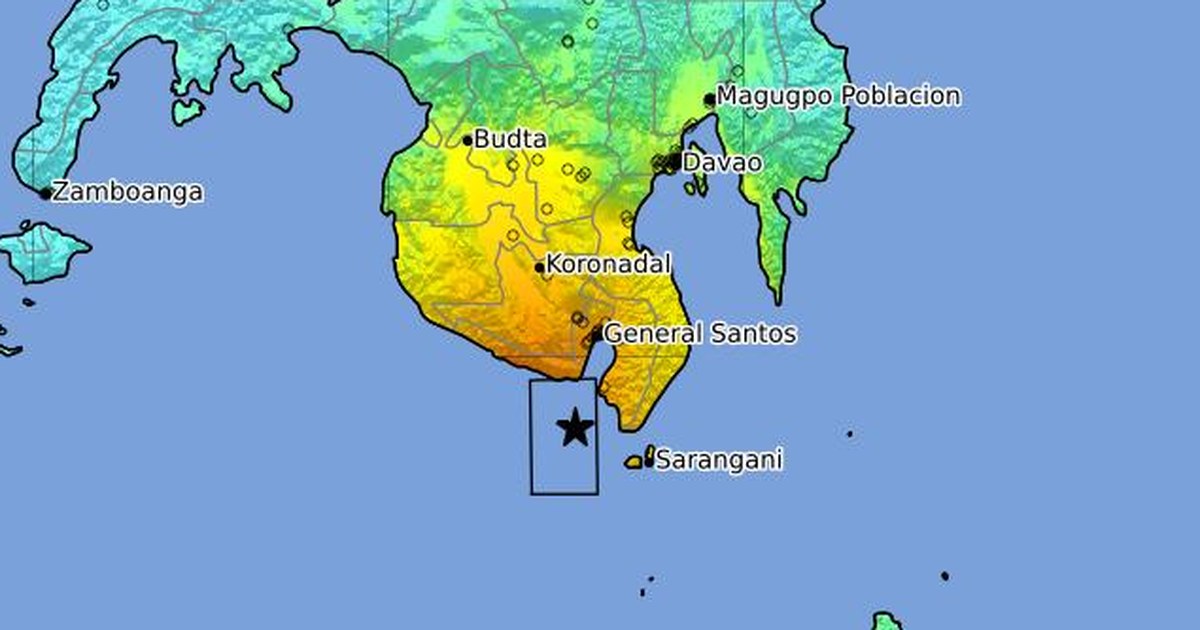
For international use cases, NASA-powered forecasts highlight at-risk watersheds and probabilities for riverine or coastal flooding. In critical events, curated updates from emergency agencies and field teams are also included to enhance situational awareness.
To help users prioritize response efforts, DisasterAWARE uses a standardized four-tier scale:
Local severity designations from national agencies are always preserved. For global coverage, DisasterAWARE applies NASA’s Model of Models to estimate severity based on historical risk, predictive indicators, and real-time observations—ideal for regions lacking local data.

DisasterAWARE distinguishes between areas directly affected by flooding (exposure areas) and nearby regions that need to be alerted (notification areas). It uses geographic definitions from local agencies like National Weather Service (NWS) wherever available, but also applies intelligent buffers or watershed contours for NASA-based forecasts—ensuring users receive alerts even where local definitions don’t exist.
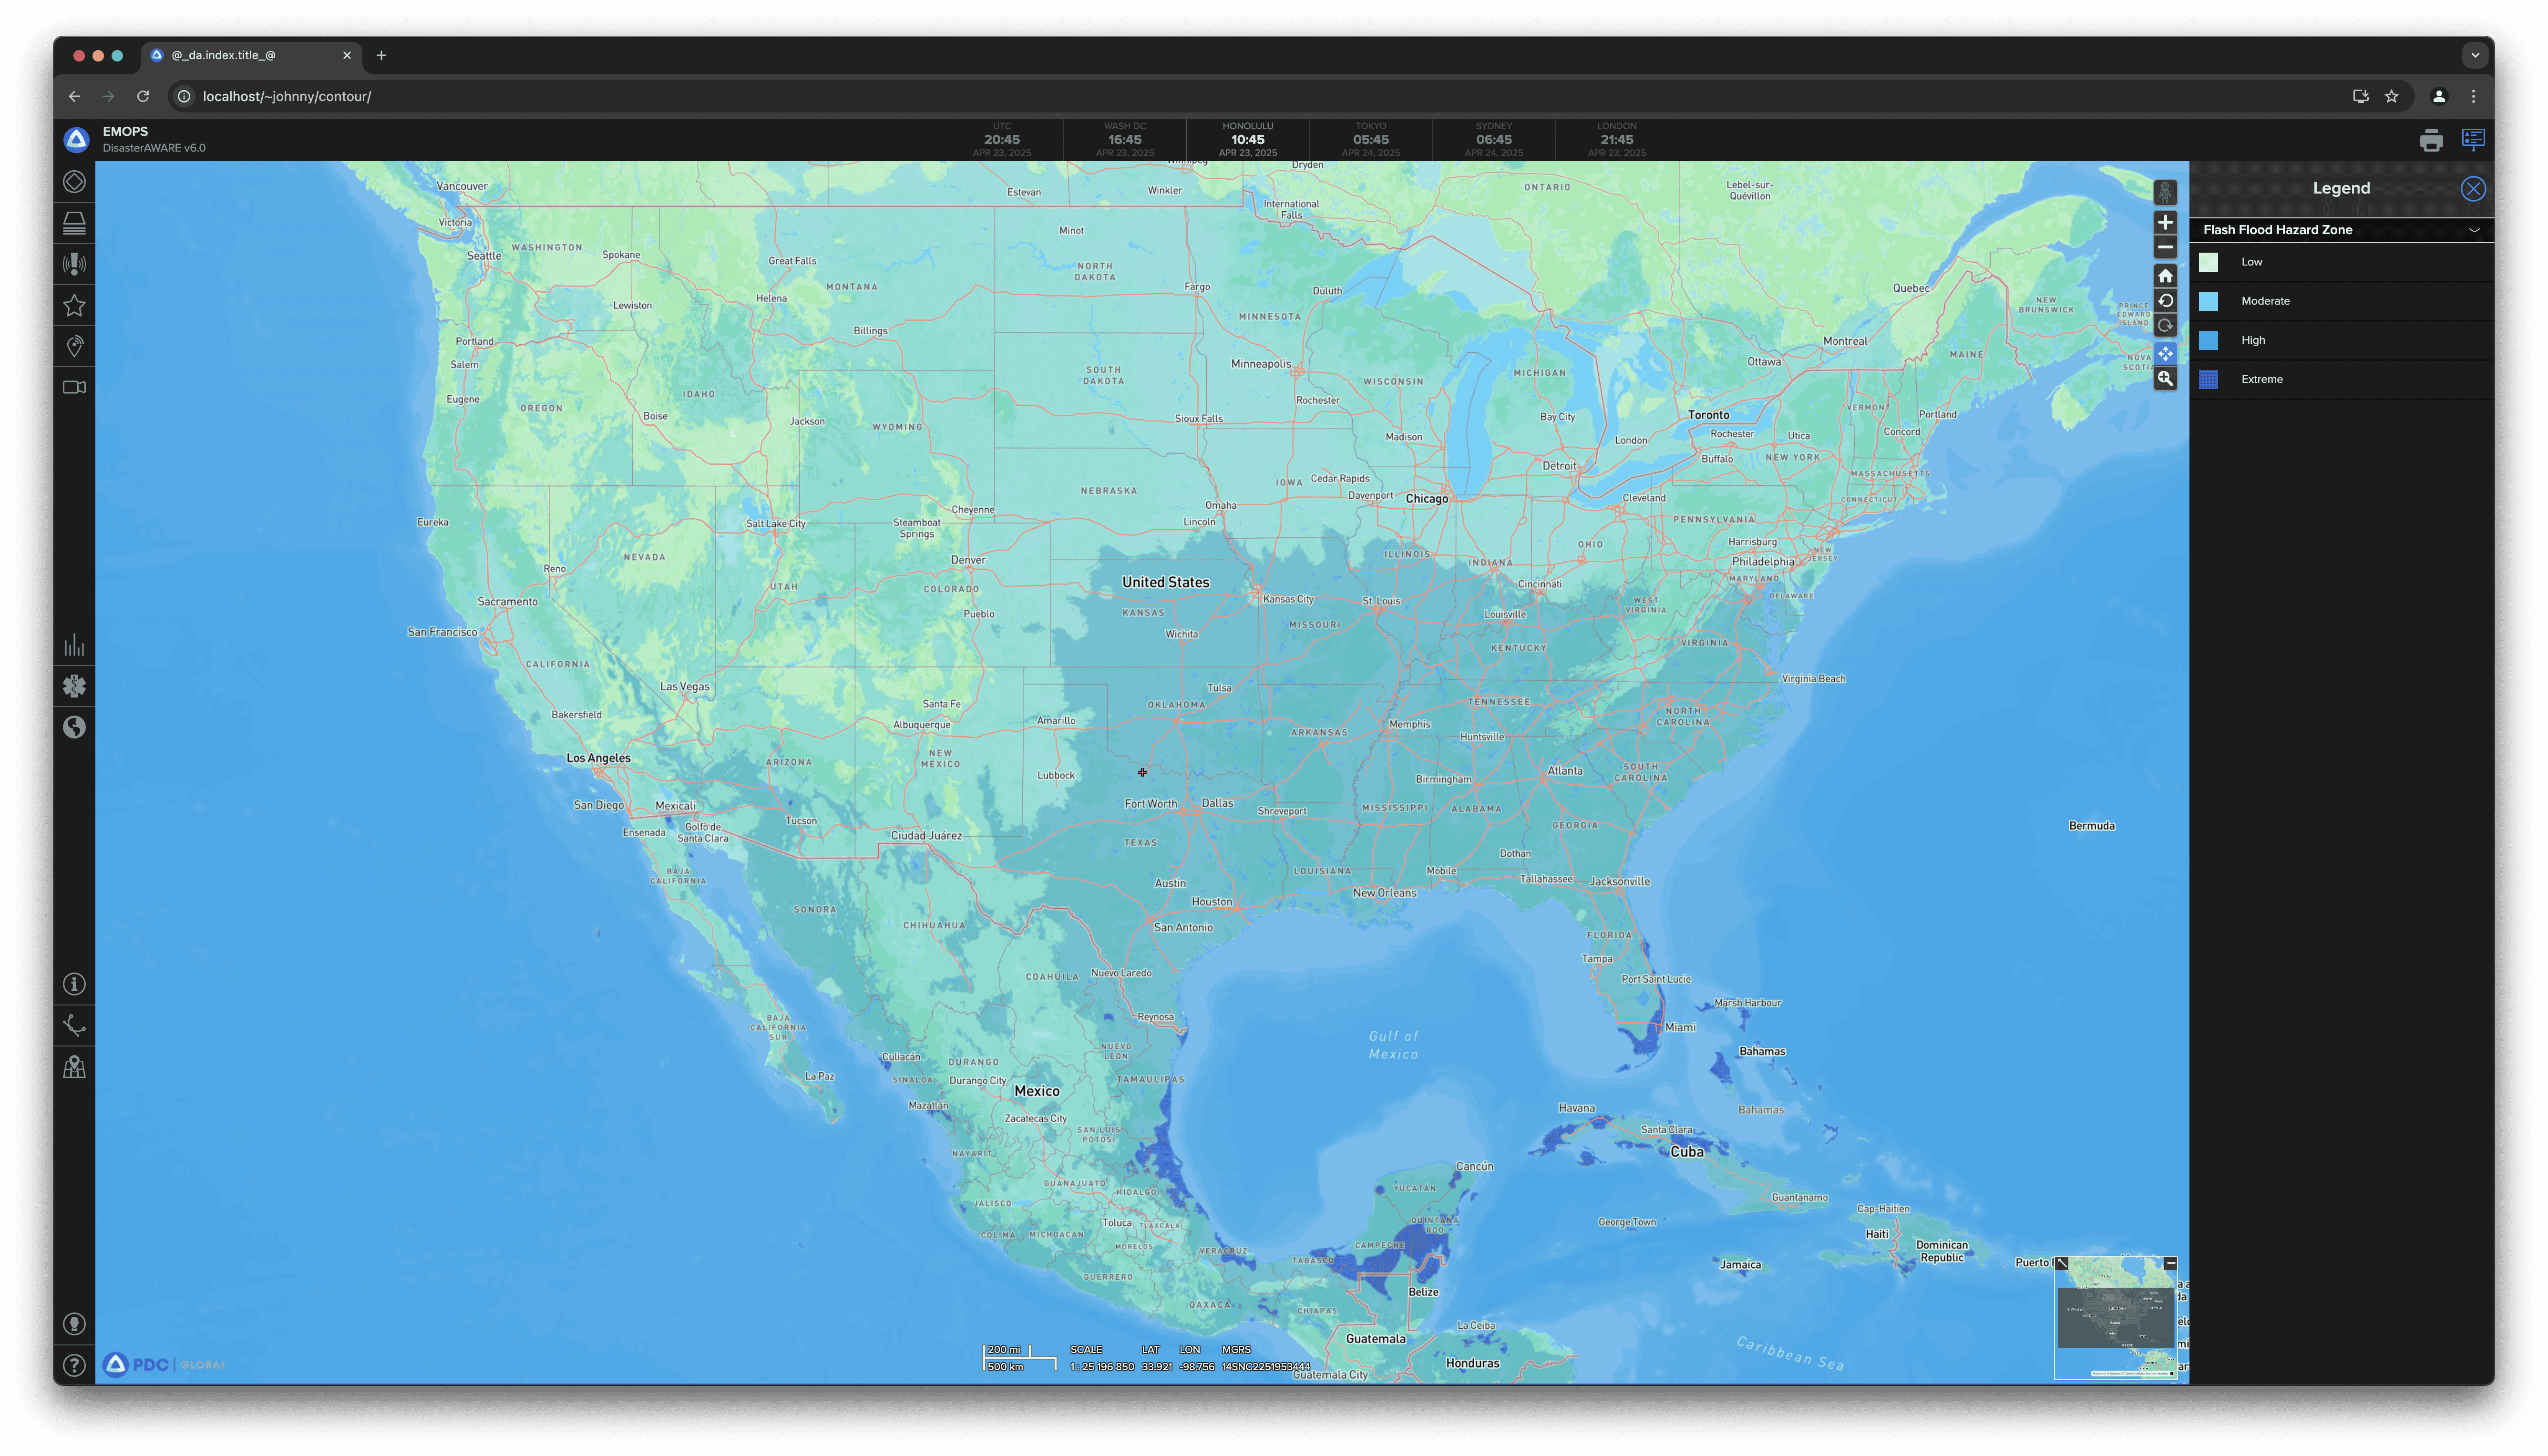
Flood monitoring in DisasterAWARE is backed by a powerful collection of map layers, combining real-time conditions, forecasts, hazard zones, and historical data:
These layers help users visualize flood risk in context with their infrastructure and assets, enabling faster, data-informed decisions.
Organizations can integrate asset data via ArcGIS services or secure API connections. DisasterAWARE allows for:
Asset Exposure Reports provide detailed summaries of affected assets, including types, exposure levels, and user-defined metrics such as employee counts or financial impact.
Organizations can integrate DisasterAWARE’s flood intelligence directly into their systems using our Natural Disaster API. The API delivers structured access to flood types, severity, alert zones, and Situational Awareness reports—fully attributed to trusted sources such as national weather agencies, our NASA model, or DisasterAWARE’s manual assessments.
This makes it easy to build internal dashboards or automate response workflows based on real-time flood intelligence.


-min.png)


.png)

.png)