.png)
We’re thrilled to unveil DisasterAWARE Version 9, the most significant upgrade to our platform to date. Designed to meet the growing demands of emergency managers, planners, and risk analysts, this release is not just an update — it’s a strategic leap forward in how geospatial intelligence is rendered, analyzed, and shared.

DisasterAWARE now runs on MapLibre, an open-source engine built for modern GIS applications. By transitioning away from Google Maps, we’ve unlocked the ability to directly integrate our global data holdings into the base map itself. This means contextual layers — roads, place names, terrain — now coexist harmoniously with real-time risk data. The result? A cleaner, faster, and more readable map experience across every view and overlay.
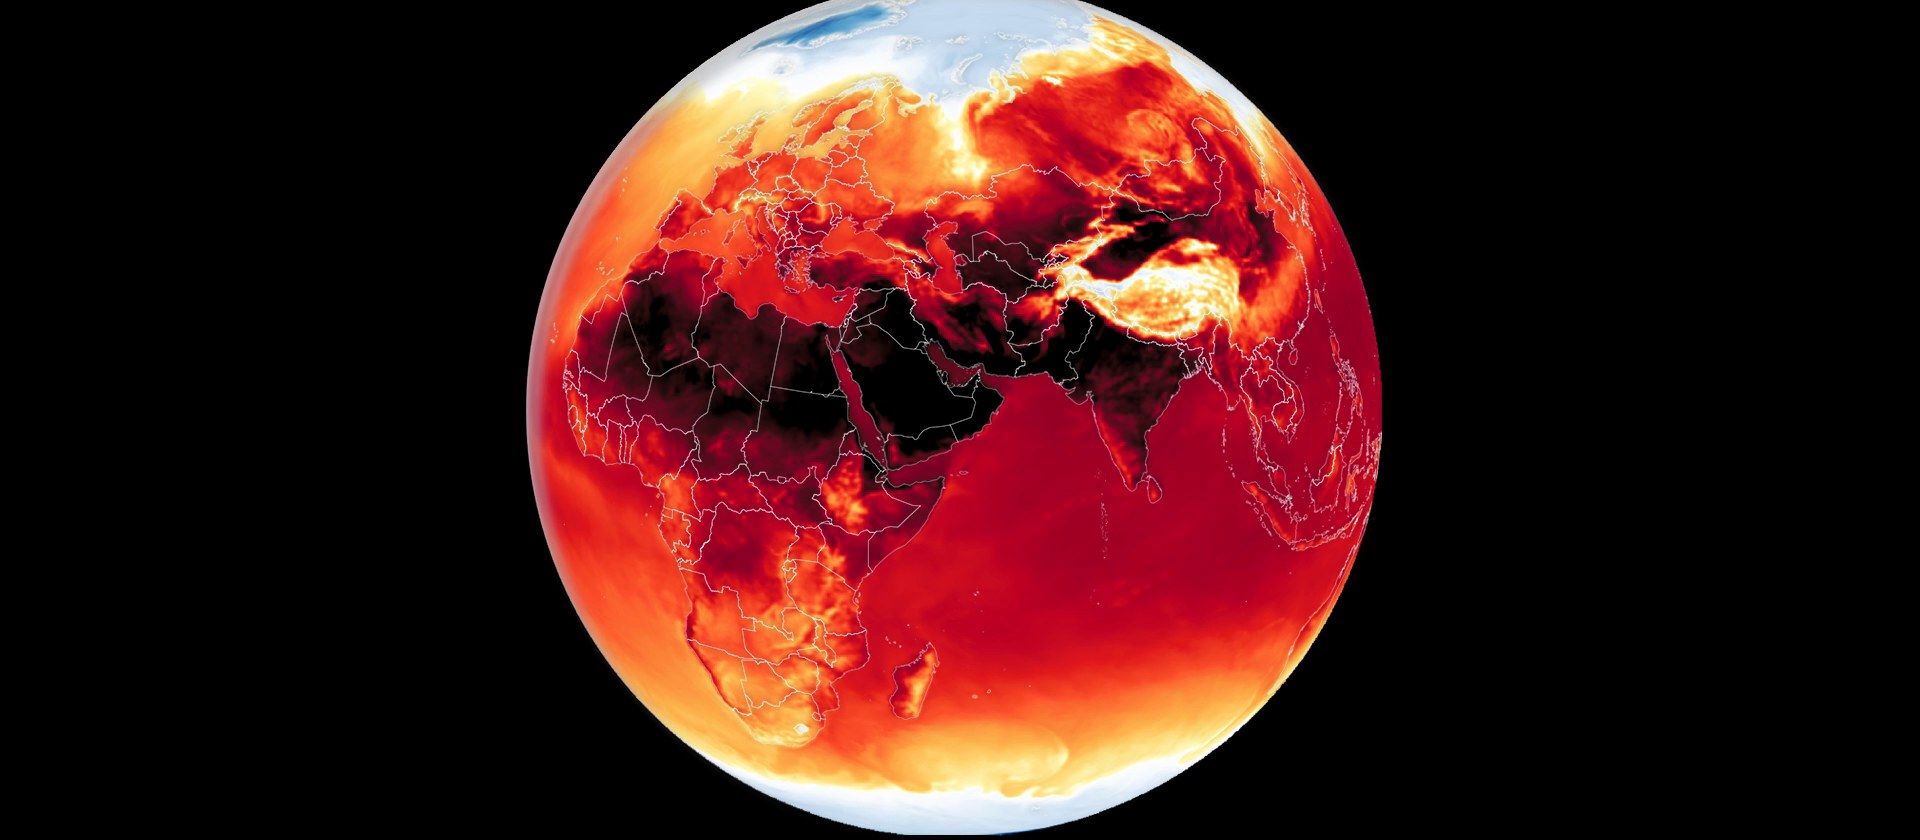
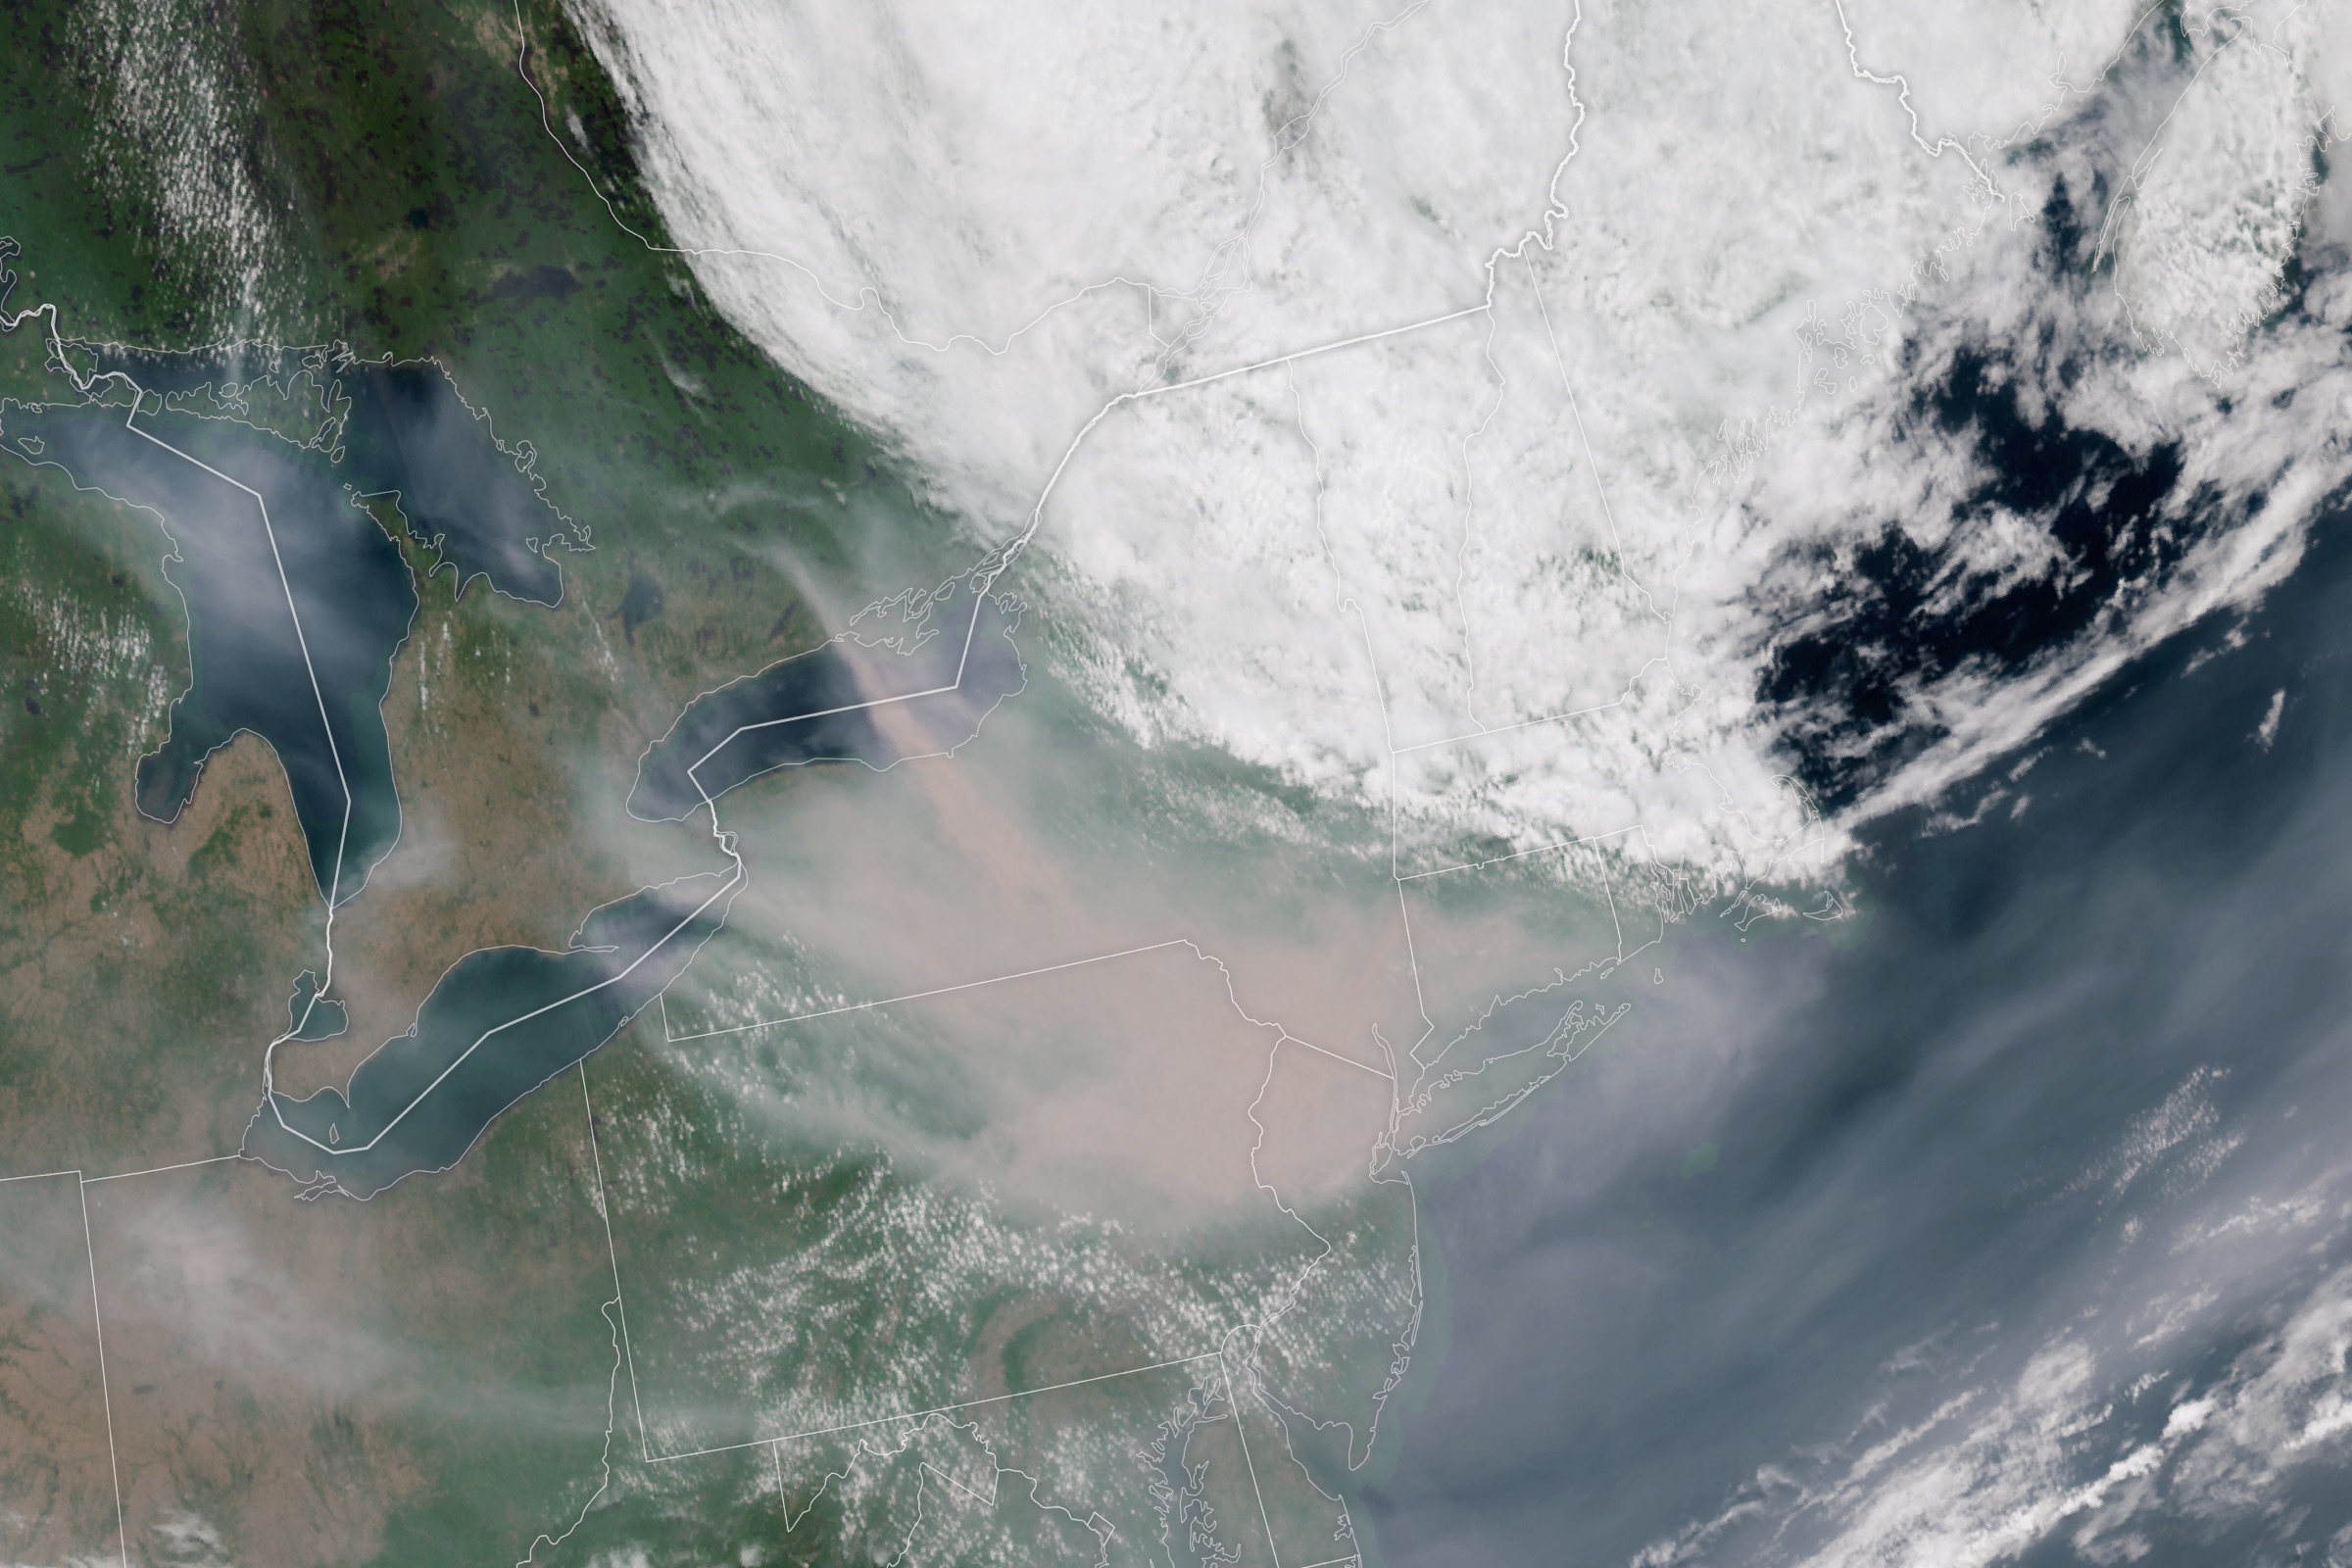
We’ve added a powerful new dimension to forecasting by integrating animated, WebGL-accelerated layers from NOAA’s Global Forecast System. Users can now visualize surface wind speeds, snow depth, and temperature outlooks across a five-day window — with higher speed, clarity, and mobile optimization. These layers make environmental monitoring more accessible and visually intuitive, and they’re only the beginning. More forecast types will be rolled out throughout the year to provide even richer situational awareness.
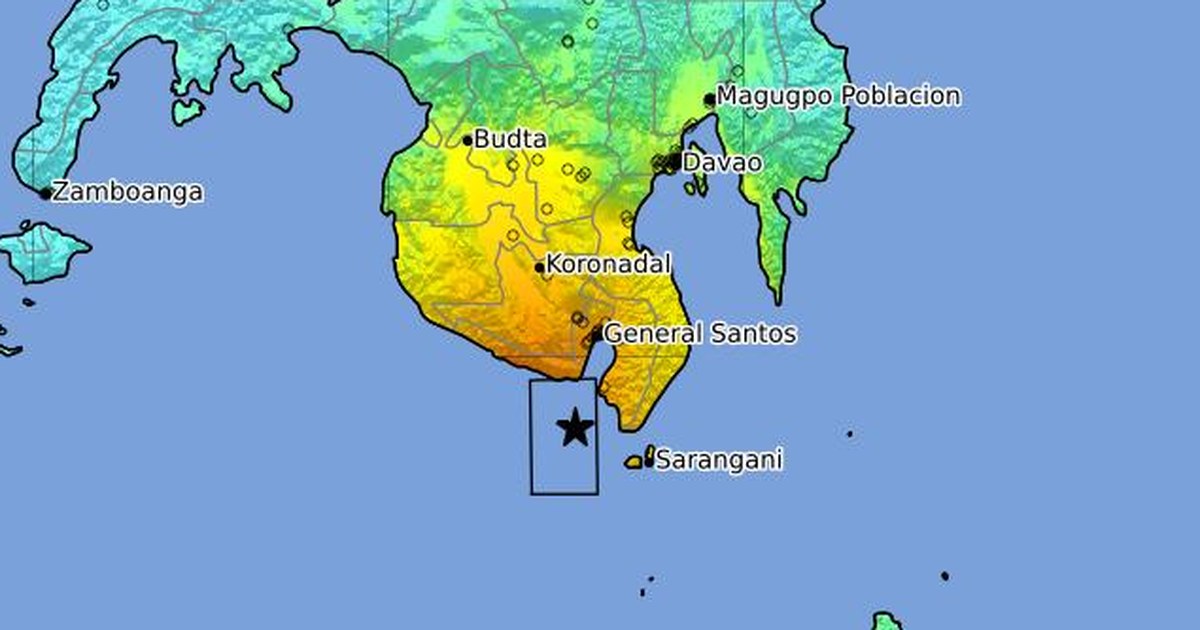
Traditional heatmaps are out. Version 9 introduces H3 hexagonal density mapping, offering cleaner spatial analysis and high-precision data rendering at any zoom level. Whether you're analyzing population exposure, infrastructure vulnerability, or climate risk thresholds, these new maps present data at a granular, cell-specific scale — without compromising performance or usability. It’s a leap forward in clarity, especially for large-scale or comparative risk analysis.
We’ve reengineered our map print function to better serve operational needs. Instead of rendering maps on a server, the system now captures them exactly as displayed on-screen — including styling, labels, legends, and visible data. Whether you’re creating briefings, reports, or field guides, you can now export visuals that reflect your live map view with full fidelity, ensuring everyone gets the same clear picture, regardless of platform access.

DisasterAWARE continues to support key formats like KML, GeoJSON, WKT, and Shapefiles, but Version 9 adds improved styling and data persistence. KML files now retain their custom visual attributes, while default styling for non-KML formats is cleaner and more intuitive. Admins can also manage uploaded files at the organization level, making it easier to share vetted data layers with entire teams.
We’re enhancing our platform with deeper weather insights, richer map data, and scalable monitoring tools to support proactive disaster response and planning.


-min.png)


.png)