Tsunamis are among the most devastating natural hazards, capable of causing catastrophic loss of life and widespread destruction to coastal communities. Although they occur less frequently than other hazard types, their impacts can be far more severe. Between 1998 and 2017, tsunamis were responsible for an estimated $280 billion in damage globally, according to a study by the United Nations Office for Disaster Risk Reduction (UNDRR). These rare but high-consequence events demand vigilant monitoring and rapid response.
DisasterAWARE continuously monitors tsunami threats in all of the world’s oceans—providing critical intelligence for governments, humanitarian organizations, and businesses alike. By integrating real-time data from authoritative sources with advanced modeling and decision support tools, DisasterAWARE helps users stay ahead of the threat, protect assets, and save lives.
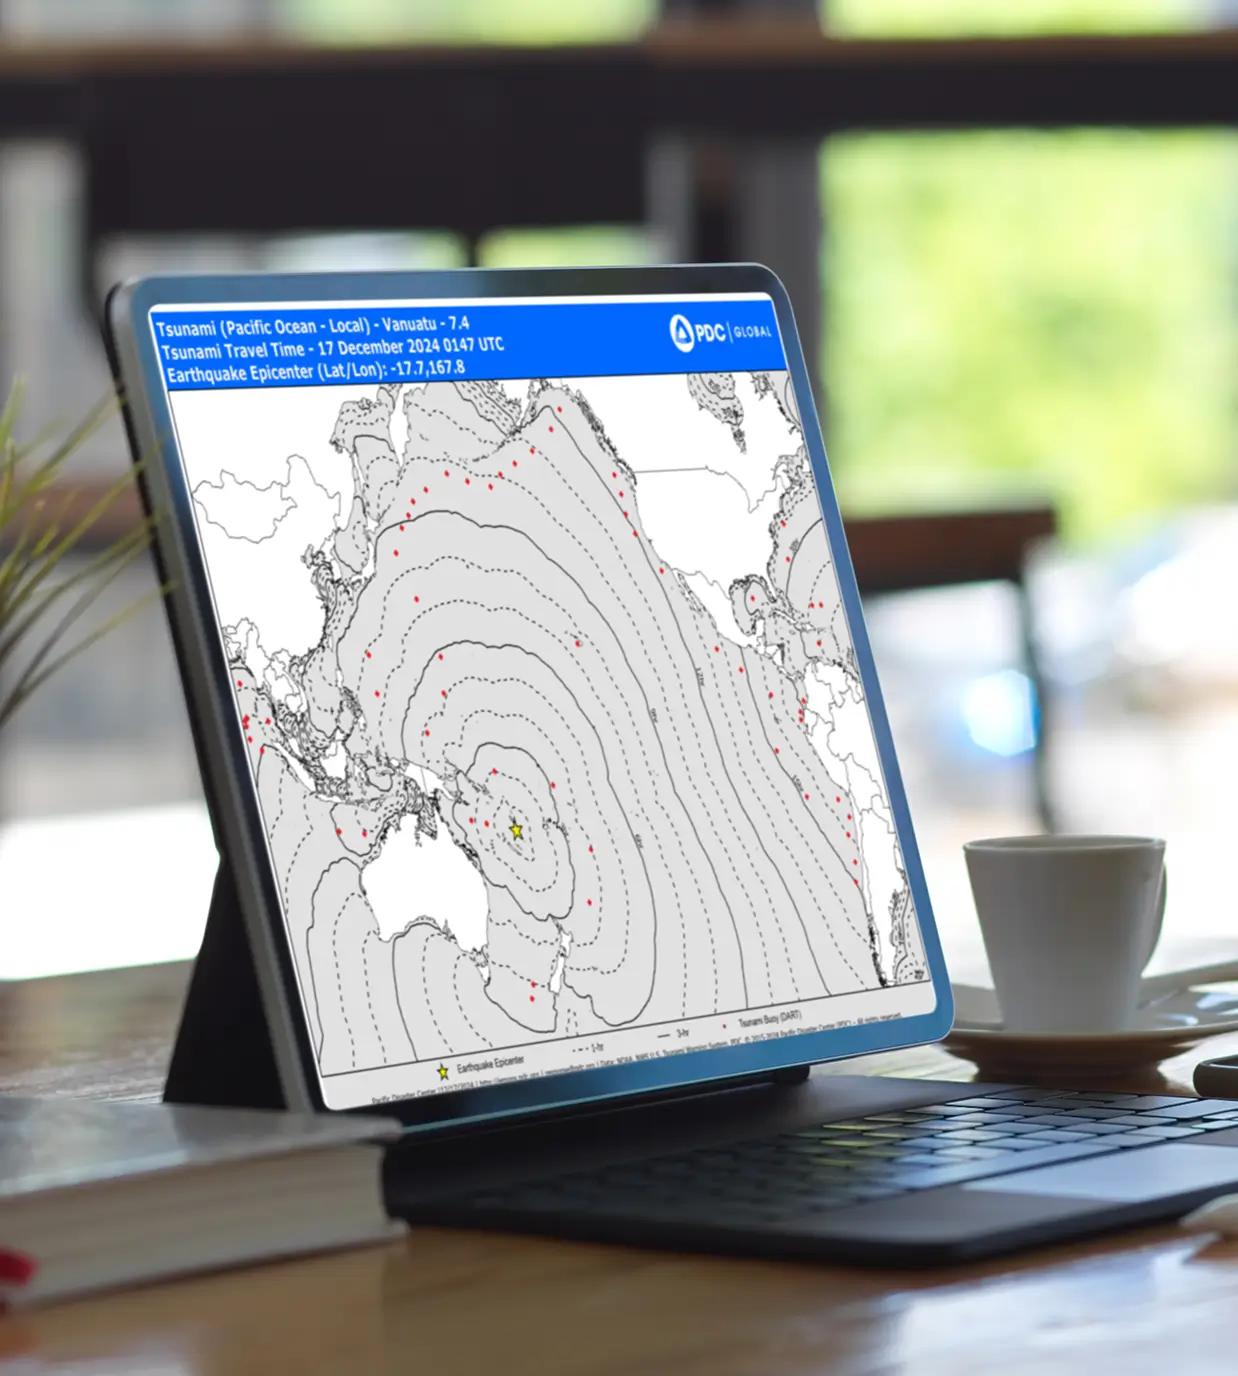
For every tsunami event, DisasterAWARE generates a situational awareness product that includes a detailed travel time map—a critical tool for understanding the projected movement of tsunami waves across the ocean. These maps display estimated wave arrival times using contour lines, helping decision-makers anticipate which regions may be affected and when. Depending on the event, the product may include multiple maps, such as ocean-wide overviews and more detailed regional perspectives.
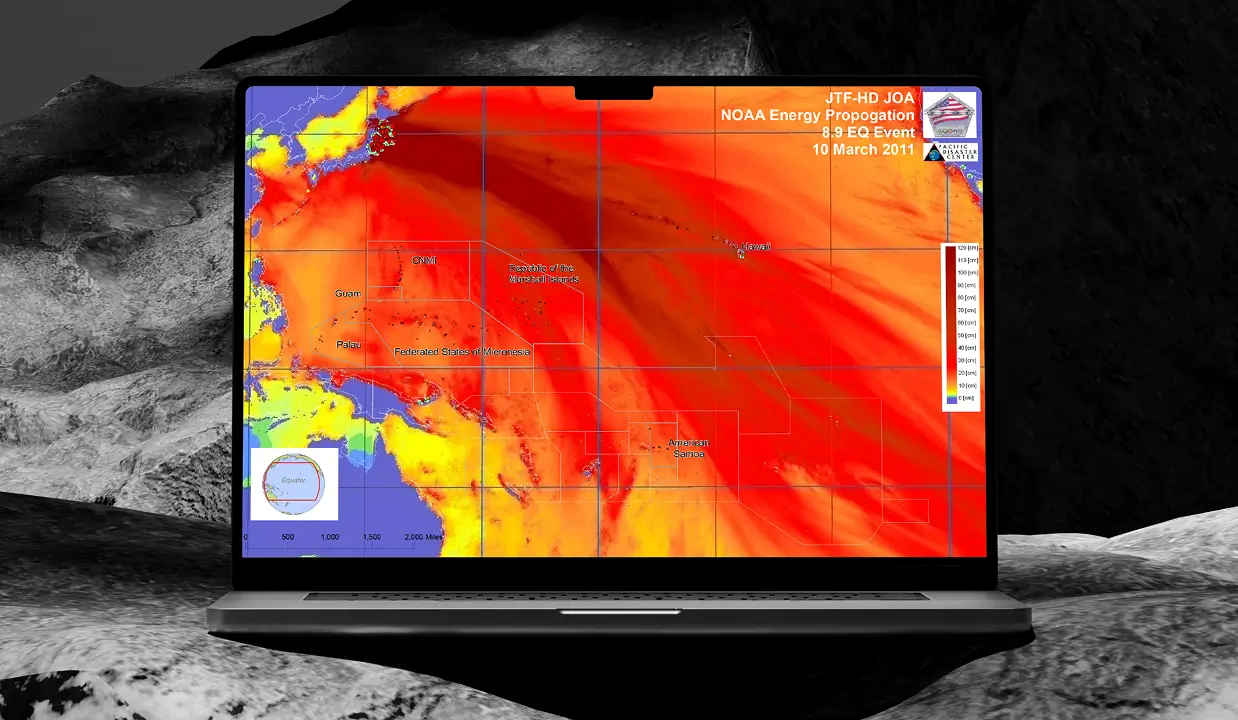
In major tsunami disasters—such as the 2011 Great East Japan Earthquake and Tsunami—our disaster response team curates additional situational awareness materials, including situation reports from international aid organizations, national governments, and regional emergency management agencies. These curated reports provide essential context on the humanitarian impact, response efforts, and emerging needs, supporting more informed and coordinated decisions during crisis situations.
DisasterAWARE classifies tsunami events based on real-time assessments of the threat level, helping users quickly understand the potential severity of each event. These severity levels follow standardized alert categories used by tsunami warning centers and reflect the likelihood and observation of tsunami waves:
Tsunami waves have been observed and pose an immediate threat. Urgent action is required.
Tsunami waves are possible based on the triggering event. Communities should stay alert and be prepared.
No tsunami waves are expected. The event does not pose a significant threat.
Tsunami waves may occur near the source, with limited regional impact expected.
These classifications help guide appropriate response actions and are integrated into DisasterAWARE’s real-time monitoring and alerting systems.
DisasterAWARE includes powerful Asset Protection tools that help organizations monitor how hazards—such as wildfires—affect the people, places, and infrastructure they care about most.
Once loaded, assets can be viewed in two ways: through the Notification Panel, or by enabling their associated map service layer under the User folder in the Layers Panel.Assets can be user-owned or shared at the organization level. Organizations with multiple teams can also set up Sub-Organizations, each with their own asset classes and notification rules—providing flexibility in how asset data is managed and accessed across departments.
For each asset class, users can define non-user contacts—such as building managers or emergency coordinators—who should receive notifications when a hazard threatens specific locations. These contacts receive email alerts with detailed hazard information, ensuring they stay informed even if they don’t actively use the platform.
These features help organizations stay ahead of emerging threats, understand the geographic relationship between hazards and their assets, and quantify their total exposure—supporting faster, more informed decisions during critical moments.
To help organizations assess their potential risk, DisasterAWARE automatically calculates exposure areas for each tsunami event. These areas represent coastal regions that may be affected by waves within three hours of the earthquake’s origin. Using advanced geospatial analysis, the system identifies coastlines likely to be impacted and applies precomputed buffer zones—extending 10 kilometers out to sea and 1 kilometer inland—to determine the at-risk zones. This calculation is performed once when the event is first detected, ensuring rapid situational awareness during the critical early stages of a potential tsunami.
Notification areas, known in DisasterAWARE as SmartAlert geographies, are used to drive automated alerts and vary depending on how the tsunami hazard is created. For automatically generated events, SmartAlert regions are based on pre-defined, ocean-specific zones maintained by regional tsunami warning centers. When a hazard is created manually, analysts can define custom notification areas to reflect more specific local conditions or response needs.
A single tsunami can trigger multiple hazard entries, each aligned with the regional warning centers responsible for different ocean basins—such as Hawaii, Alaska, the Caribbean, and the U.S. West Coast—ensuring that local authorities and stakeholders receive the most relevant and actionable information.

Together, these layers empower users to monitor, analyze, and plan for tsunami risk—both in real time and over the long term.
DisasterAWARE’s Natural Disaster API delivers comprehensive tsunami hazard data in real time, making it easy to integrate into internal systems, applications, or dashboards. Each tsunami hazard reported by the original source agency—such as a regional tsunami warning center—is included, along with enhanced insights generated by our internal algorithms.
These enhancements include exposure areas and notification zones that help organizations assess potential impacts more effectively. Additional datasets, such as estimated first wave arrival times, are also available upon request to support advanced risk analysis and custom workflows.
Whether you’re building alerts, visualizations, or reports, the DaaS API gives you access to reliable, actionable tsunami data when and where you need it most.
Decision-ready intelligence for understanding what's happening, what is impacted, and what to do next. Global hazard, severe weather, catastrophe, and physical risk intelligence trusted by governments, enterprises, insurers, humanitarian organizations, and technology platforms worldwide.
Request DemoContact Us