


Why a Hurricane Track Alone Doesn't Tell the Whole Story
Every hurricane leaves behind more than a track.
Ask someone to visualize a historic hurricane. Most people imagine a curved line crossing an ocean. A forecast cone. Perhaps a few dots showing where the storm was every six hours.
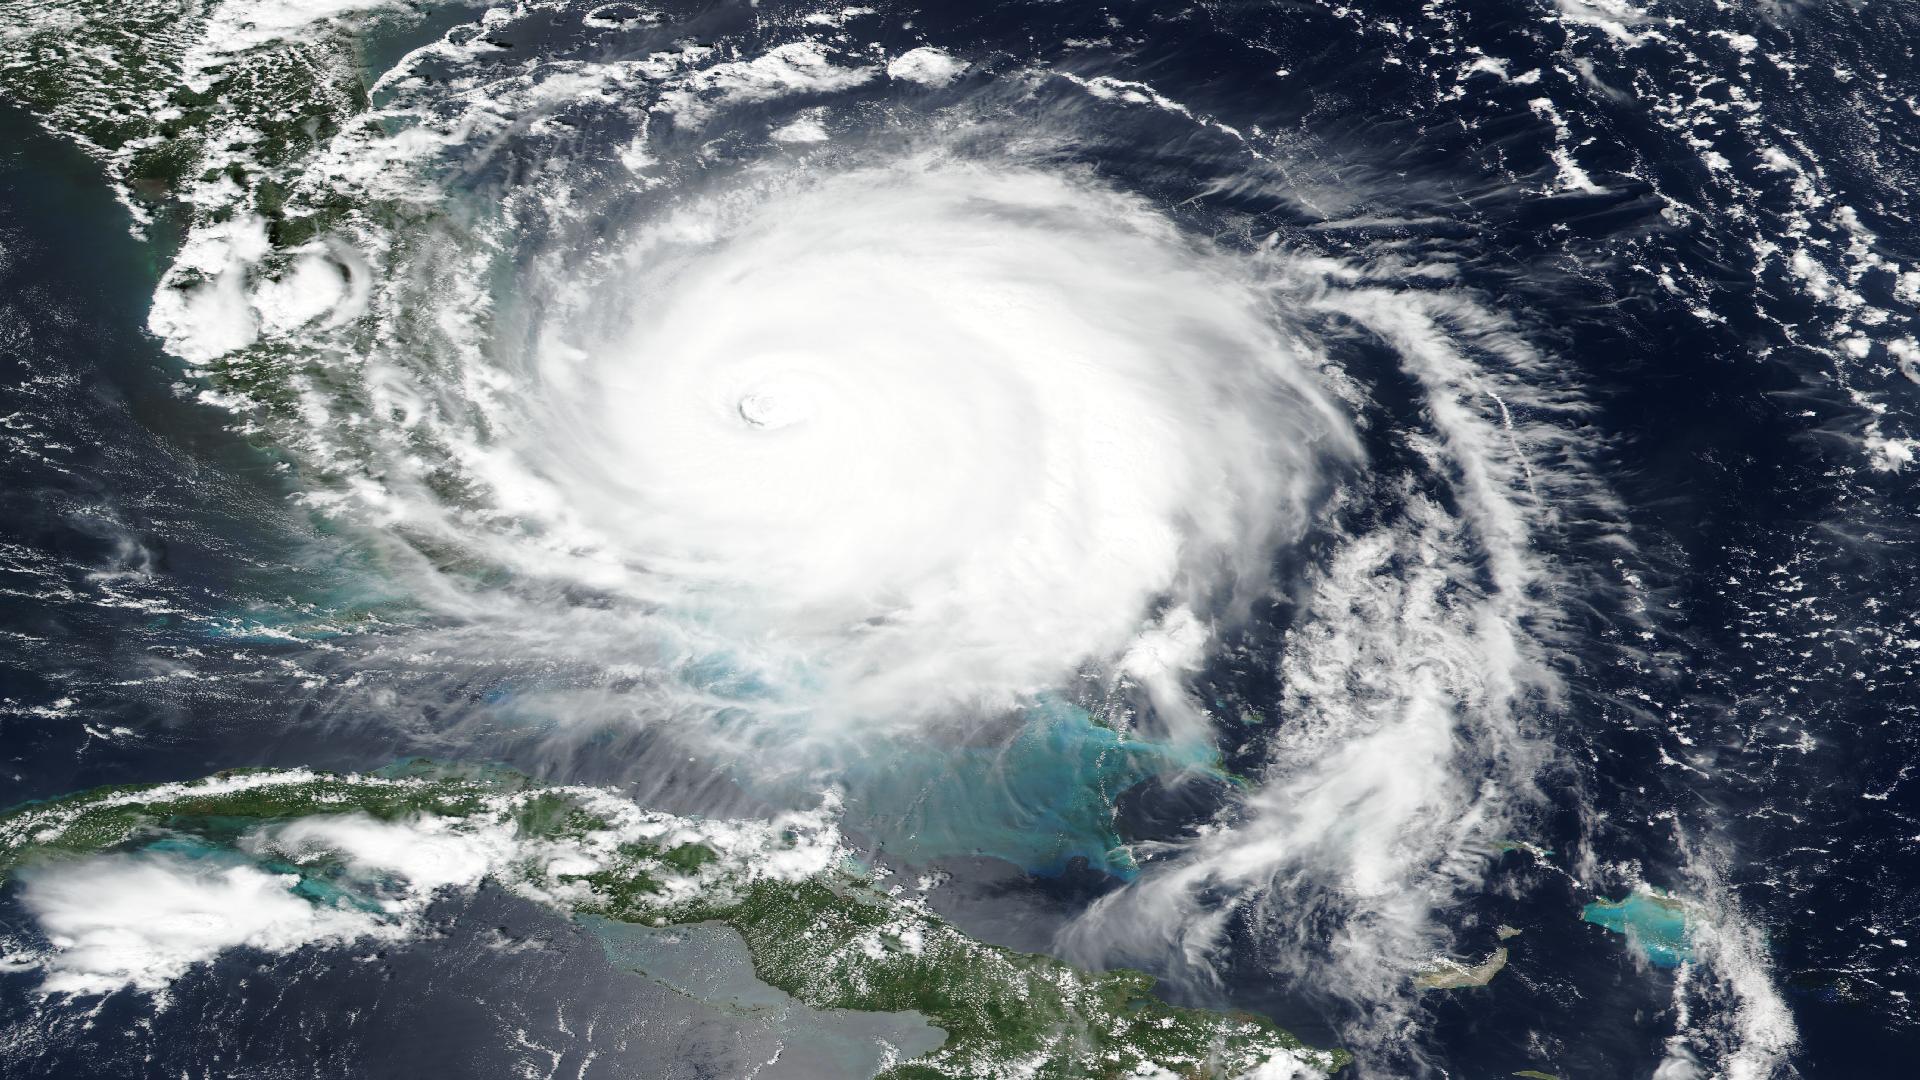
Banner: Hurricane Dorian stalled over the northwestern Bahamas, September 2, 2019 (NASA Worldview, VIIRS/Suomi NPP). The track barely moved for more than a day — the story of the storm is in everything the track doesn't show.
That's how hurricanes have traditionally been represented. It's simple. It's familiar. And it's incomplete.
A hurricane isn't a line. It's a living, evolving catastrophe that changes hour by hour. Its wind field expands. Its intensity fluctuates. Its pressure falls and rises. It changes direction. It strengthens. It weakens. It makes landfall. It spawns tornadoes. It produces flooding hundreds of miles from its center.
The track tells us where the center of the storm traveled. It tells us very little about how the catastrophe actually evolved.
Historical Catastrophe Intelligence changes that.
Imagine two hurricanes following nearly identical tracks. On a map, they appear almost identical. Operationally, they may be completely different.
One storm may rapidly intensify before landfall. Another may weaken. One may produce hurricane-force winds extending more than one hundred miles from its center. Another may have a much smaller wind field. One may produce multiple landfalls. Another may remain offshore. One may generate dozens of tornadoes. Another may produce catastrophic inland flooding.
The storm track doesn't capture any of those differences. Organizations need much richer intelligence.
For decades, historical hurricane analysis has focused primarily on the storm's center location. While important, the center tells only part of the story. Enterprise organizations are asking different questions.
Those questions require reconstructing the hurricane — not simply plotting its path.
DisasterAWARE rebuilds historic hurricanes using authoritative observations from NOAA's International Best Track Archive for Climate Stewardship (IBTrACS) — the world's most comprehensive archive of historical tropical cyclone information.
Rather than storing a simplified storm track, Historical Catastrophe Intelligence reconstructs each hurricane as a complete operational event. Every reconstructed hurricane includes a comprehensive assessment describing the storm's overall lifecycle together with detailed advisory information documenting how conditions evolved over time.
This transforms historical hurricanes from static records into living operational histories.
Hurricanes evolve continuously. Every advisory issued during the life of the storm captures another moment in that evolution. Rather than preserving only the final outcome, DisasterAWARE retains advisory-by-advisory information describing how the storm changed. This includes:
Viewed together, these observations tell the complete story of the hurricane. Organizations can understand not simply where the storm traveled — but how it changed throughout its life.
One of the most overlooked aspects of hurricane intelligence is the storm's wind field. People often focus on the eye. Operational impacts are determined by the winds surrounding it.
DisasterAWARE reconstructs historical hurricanes using the complete 34-, 50-, and 64-knot wind radii for each advisory. These measurements describe the geographic extent of tropical-storm-force winds, strong tropical storm winds, and hurricane-force winds in each quadrant of the storm.
Why does this matter?
Because damaging winds rarely occur only along the storm's centerline. A facility located many miles away from the eye may still experience significant impacts. Understanding the size and shape of the wind field provides a far more realistic picture of exposure than a storm track alone.
See historic hurricanes rebuilt, advisory by advisory
Complete reconstructed storms — 34-, 50-, and 64-knot wind radii, intensity evolution, landfalls, and duration — delivered through APIs, GIS services, and dashboards.
Every reconstructed hurricane documents how the storm evolved throughout its lifecycle. Historical Catastrophe Intelligence captures information such as:
Instead of searching multiple historical archives, organizations receive a complete operational summary of the storm.
Storm evolution often explains why two hurricanes with similar tracks produce dramatically different impacts.
Consider a rapidly intensifying hurricane. A facility may have been outside hurricane-force winds twelve hours before landfall. By landfall, those winds may have expanded significantly. Another storm may weaken before reaching the same location.
Looking only at the final track hides those differences. Understanding how the hurricane evolved helps organizations reconstruct historical exposure much more accurately.
Traditional hurricane archives answer questions such as:
Historical Catastrophe Intelligence answers much richer questions.
That additional context transforms historical information into operational intelligence — the shift we described in why historical weather data isn't enough.
Reconstructing the hurricane is only the beginning. Historical Catastrophe Intelligence becomes even more valuable when connected to enterprise assets. Organizations can evaluate:
Instead of studying storms in isolation, organizations understand how hurricanes affected their own operations. That is Historical Exposure Intelligence.
Historic hurricanes remain some of the world's most valuable resilience case studies. Every storm teaches lessons about:
Reconstructing the complete hurricane allows organizations to revisit those lessons years later using verified historical intelligence rather than fragmented records.
DisasterAWARE's hurricane reconstruction begins with one of the world's most trusted tropical cyclone datasets. But reconstruction is more than importing historical tracks.
Historical Catastrophe Intelligence organizes, enriches, and structures those observations into enterprise-ready intelligence records that can be searched, visualized, analyzed, and connected to real-world assets. Rather than replacing authoritative science, DisasterAWARE makes it operational.
For decades, hurricane history has often been represented by a single line across a map.
That line is important. But it tells only part of the story.
The real story is contained within the evolution of the storm. Its changing intensity. Its expanding wind field. Its landfalls. Its duration. Its operational impacts.
Historical Catastrophe Intelligence preserves that story. Because understanding where a hurricane traveled is useful. Understanding how it evolved is transformational.
Explore the historical record
Decades of reconstructed, verified catastrophes — browse the Historical Event Intelligence overview, or request sample data for your own portfolio.
What data does DisasterAWARE use to reconstruct historic hurricanes? Reconstruction begins with NOAA's International Best Track Archive for Climate Stewardship (IBTrACS), the most comprehensive archive of historical tropical cyclone information. Those observations are then organized, enriched, and structured into enterprise-ready records that can be searched, visualized, analyzed, and connected to real assets.
Why are wind radii more useful than the storm track? Damaging winds rarely occur only along the centerline. The 34-, 50-, and 64-knot wind radii describe how far tropical-storm-force, strong tropical storm, and hurricane-force winds extended in each quadrant, for every advisory. A facility far from the eye can still take significant impacts — the wind field shows that; the track does not.
What does a reconstructed hurricane record include? A lifecycle assessment plus advisory-by-advisory detail: storm position, date and time, maximum sustained winds, central pressure, classification, distance to land, and wind field evolution. Summary attributes include peak Saffir-Simpson category, minimum central pressure, hurricane-force and major hurricane duration, track length, advisory count, landfalls, basin, and season.
How does this help with enterprise exposure? Once a storm is reconstructed as an evolving event, it can be intersected with real assets: which facilities experienced hurricane-force winds, which suppliers were exposed, which insured properties fell inside the evolving wind field, which locations have been hit repeatedly, and how exposure has changed across multiple hurricane seasons.




Decision-ready intelligence for understanding what's happening, what is impacted, and what to do next. Global hazard, severe weather, catastrophe, and physical risk intelligence trusted by governments, enterprises, insurers, humanitarian organizations, and technology platforms worldwide.
Request DemoContact Us

