


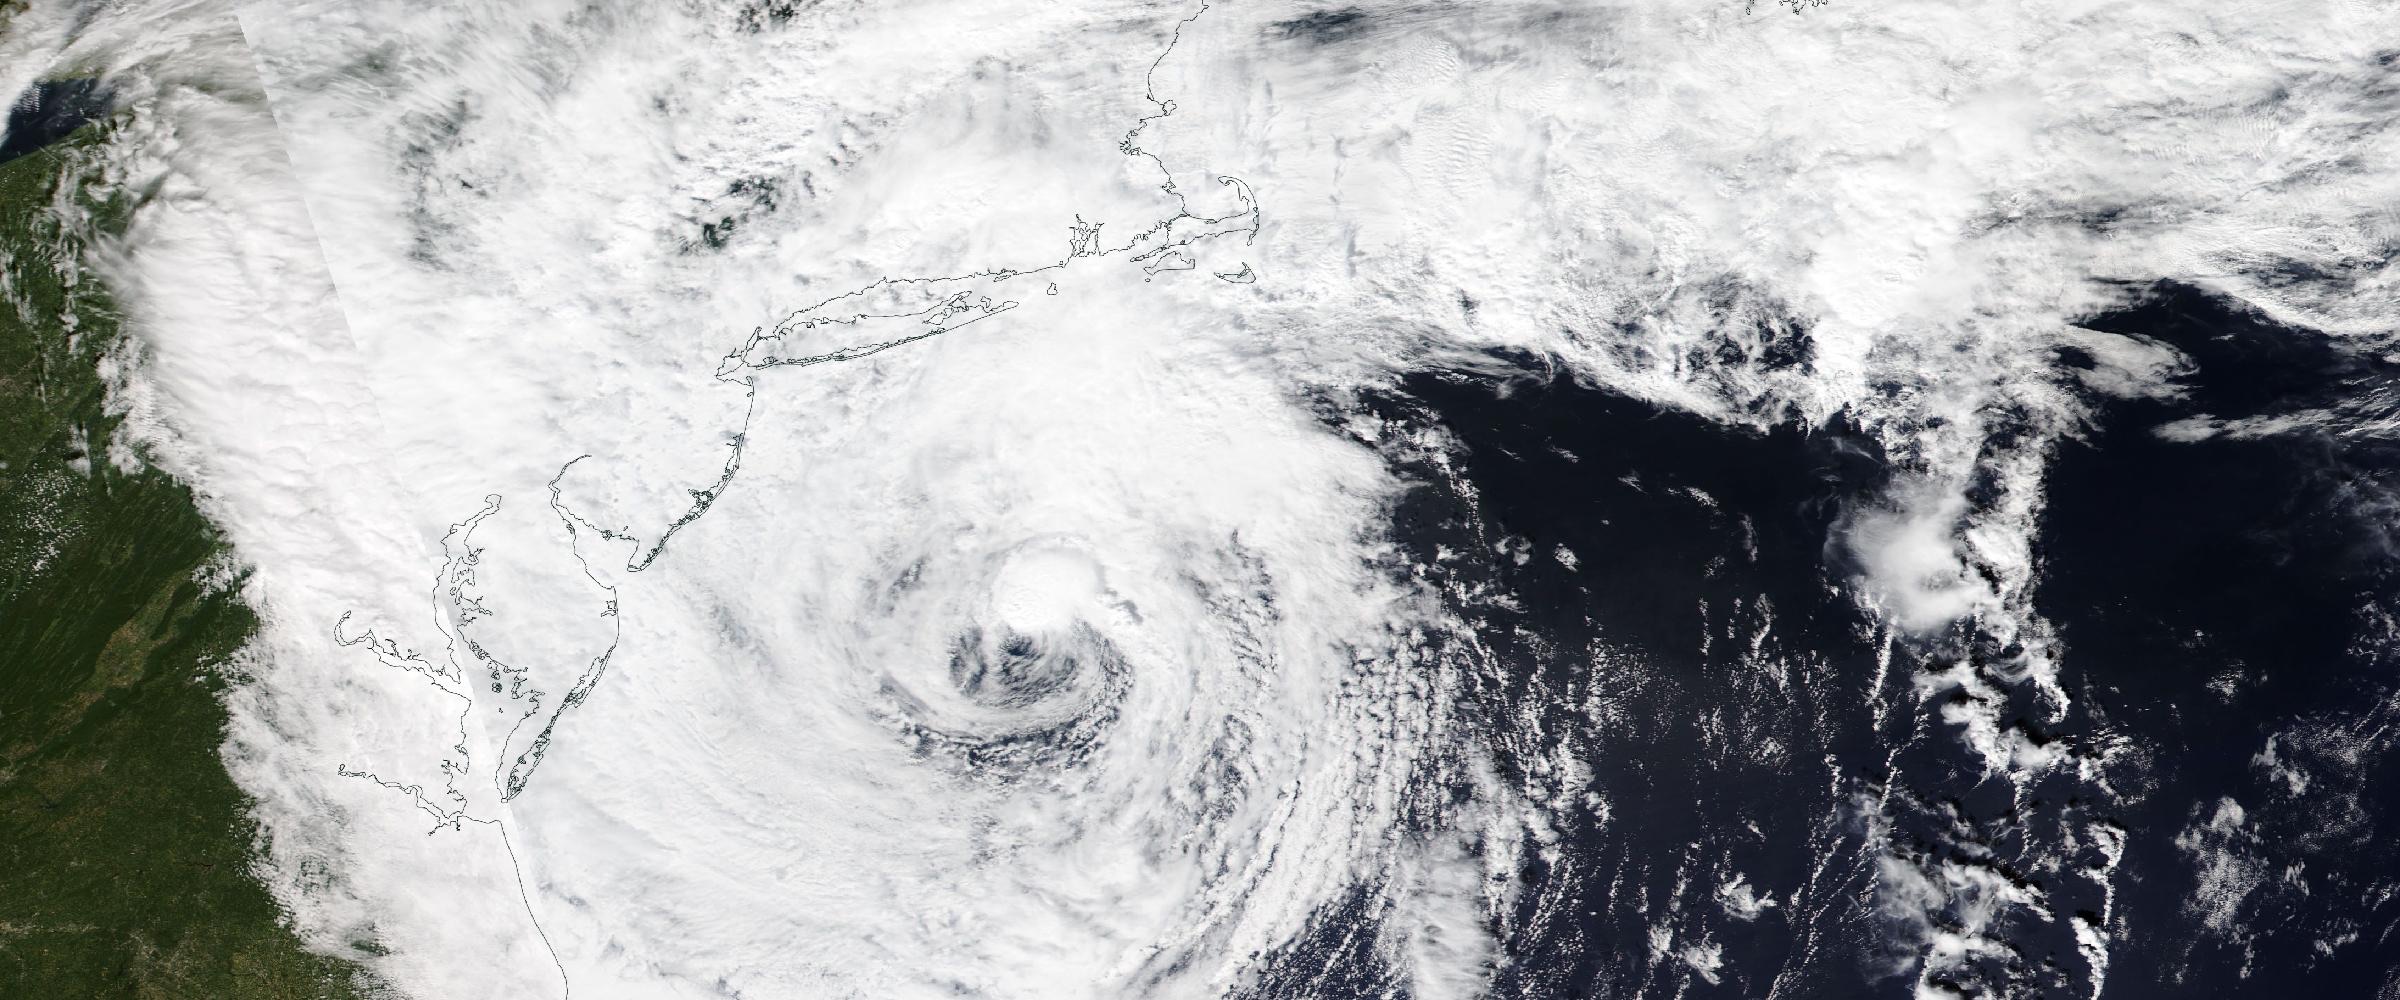
DisasterAWARE Weekly Intelligence Brief — the nor'easter of September 22 to 28, 2026
At 9:18 on Saturday morning, September 26, the NOAA tide gauge at Kiptopeke, Virginia, near the southern tip of the Delmarva Peninsula, read 3.10 feet above the average high-tide line: major flooding, and the highest water there since Hurricane Sandy in October 2012. Half an hour earlier, Ocean City Inlet, Maryland had peaked at 2.77 ft, also its highest since Sandy. Atlantic City reached 3.26 ft, its highest since January 2016, when it hit 3.42 ft. Lewes, Delaware peaked at 3.62 ft, its highest since January 2016 and over the National Weather Service's major-flood threshold. In all, 30 of the 51 NOAA tide gauges between Virginia and Maine reached flood stage: 5 major, 12 moderate and 13 minor.
Then we asked the question this brief is built around: did the warnings match the water? Every one of the 17 gauges that reached moderate or major flooding was inside an NWS Coastal Flood Warning at the moment it peaked. All 30 gauges that flooded had either a warning or an advisory in force. The misses were all in the other direction: three Massachusetts gauges, Woods Hole, Boston and Chatham, were under a warning and stayed below flood stage.
How to read every number in this brief. We keep two kinds of numbers apart. Alert-tier numbers are products the National Weather Service issued (warnings, advisories and watches): forecasts with a defined area. Observed-tier numbers are measurements and reports: tide-gauge peaks from NOAA's 6-minute water-level record, NWS Local Storm Reports, and the wind and rain totals in NWS post-storm statements. The blue flood-depth shading on our map is a third kind, modeled: NOAA's inundation data at the water level the gauges measured. It is an estimate, not a survey of what flooded. We label each figure by its tier.
Observed tier (measurements and reports):
Alert tier (issued products):
Open map full screen in a new tab ↗
Gauge colours show the NWS flood category each gauge's peak reached (observed). Red and amber outlines are NWS Coastal Flood Warning and Advisory zones (alert). Zoom in on any flooded stretch of coast to see the blue modeled flood depth.
The flooding came from a storm that sat offshore for days, not one sharp surge. The NWS offices in Wakefield and Mount Holly issued their first Coastal Flood Warnings on the afternoon of September 22, and both warnings stayed in force until after the last peaks in their areas on September 27. New York and Boston issued theirs on September 25.
The water rose first in the bays. The tidal Delaware River gauges at Delaware City, Marcus Hook, Philadelphia and Bridesburg peaked late on September 23 and just after midnight on the 24th; upriver, Burlington, NJ peaked early on September 27. In Virginia, Dahlgren on the Potomac peaked early on the 24th, Lewisetta at midday, and Sewells Point, Money Point and Windmill Point (major) on the evening high tide of September 24.
Then the wind arrived. On the night of September 25, Surf City, NJ, on Long Beach Island, gusted to 74 mph. At 4 a.m. on the 26th, Montauk Point gusted to 81 mph and Block Island to 71 mph. The ocean coast peaked with the Saturday-morning high tide on September 26: between 8:06 and 11:42 a.m. EDT, 15 of the flooded gauges, from the lower Chesapeake to Long Island Sound, reached their peaks, including Lewes, Kiptopeke and the Chesapeake Bay Bridge-Tunnel at major flood stage. Bishops Head (major) and Cambridge on the Eastern Shore of the Chesapeake peaked on the afternoon of September 27, and Annapolis at 6 p.m. that day, the last of the 30 flooded gauges to peak.
To find the last time each gauge was this high, we compared every storm peak with the highest 6-minute water level NOAA recorded at that gauge in each month, from October 2012 through August 2026. Two gauges had no month in that record at or above their September 26 peak except October 2012, the month of Sandy:
Atlantic City, NJ came close. Its 3.26 ft peak (moderate flooding) was its highest since January 2016, when the gauge reached 3.42 ft; Sandy reached 4.29 ft there.
Lewes, DE had the highest peak of the 51 gauges, 3.62 ft, 0.27 ft over its major threshold. Its record has been that high only twice since 2012: Sandy and January 2016. Cape May, NJ (3.16 ft) was also last this high in January 2016. In Virginia and Maryland, 11 gauges peaked at their highest since October 2025, including Wachapreague (3.47 ft), Money Point (3.32 ft) and Sewells Point (3.25 ft) in Norfolk, Windmill Point (2.71 ft, major) and the Chesapeake Bay Bridge-Tunnel (3.06 ft, major).
One caveat. "Highest since Sandy" compares a gauge to itself; it does not compare this storm with Sandy. Sandy remains higher at both of these gauges.
The table lists all 51 gauges, sorted by peak, including the 21 that stayed below flood stage.
| Tide gauge | Peak (ft above MHHW) | Peak time (EDT) | NWS flood category reached | NWS product in force at peak | Last time this high |
|---|---|---|---|---|---|
| Lewes, DE | 3.62 | Sep 26 08:54 | Major | Warning | Jan 2016 |
| Wachapreague, VA | 3.47 | Sep 26 08:54 | Moderate | Warning | Oct 2025 |
| Sandy Hook, NJ | 3.44 | Sep 26 08:36 | Moderate | Warning | Dec 2022 |
| Kings Point, NY | 3.38 | Sep 26 11:42 | Moderate | Warning | Apr 2024 |
| Money Point, VA | 3.32 | Sep 24 21:18 | Moderate | Warning | Oct 2025 |
| Atlantic City, NJ | 3.26 | Sep 26 08:06 | Moderate | Warning | Jan 2016 |
| The Battery, NY | 3.26 | Sep 26 09:36 | Minor | Warning | Jan 2024 |
| Sewells Point, VA | 3.25 | Sep 24 20:42 | Moderate | Warning | Oct 2025 |
| Cape May, NJ | 3.16 | Sep 26 09:18 | Moderate | Warning | Jan 2016 |
| Kiptopeke, VA | 3.10 | Sep 26 09:18 | Major | Warning | Sandy (Oct 2012) |
| CBBT, Chesapeake Channel, VA | 3.06 | Sep 26 08:48 | Major | Warning | Oct 2025 |
| Bridgeport, CT | 2.95 | Sep 26 11:24 | Minor | Warning | Jan 2024 |
| Yorktown USCG Training Center, VA | 2.92 | Sep 26 10:12 | Moderate | Warning | Oct 2025 |
| Brandywine Shoal Light, DE | 2.88 | Sep 26 09:36 | No NWS thresholds | Warning | Sep 2018 |
| Montauk, NY | 2.77 | Sep 26 08:42 | Minor | Warning | Jan 2024 |
| Ocean City Inlet, MD | 2.77 | Sep 26 08:48 | Moderate | Warning | Sandy (Oct 2012) |
| Windmill Point, VA | 2.71 | Sep 24 21:54 | Major | Warning | Oct 2025 |
| New Haven, CT | 2.65 | Sep 26 11:06 | Moderate | Warning | Jan 2024 |
| New London, CT | 2.55 | Sep 26 09:36 | Minor | Advisory | Apr 2024 |
| Lewisetta, VA | 2.46 | Sep 24 12:06 | Moderate | Warning | Oct 2025 |
| Dahlgren, VA | 2.24 | Sep 24 01:06 | Minor | Advisory | Oct 2025 |
| Bishops Head, MD | 2.19 | Sep 27 14:36 | Major | Warning | Oct 2025 |
| Ship John Shoal, NJ | 2.15 | Sep 26 22:48 | No NWS thresholds | Warning | Jun 2026 |
| Newport, RI | 2.11 | Sep 26 07:42 | Below flood stage | Advisory | Nov 2024 |
| Cambridge, MD | 2.11 | Sep 27 16:36 | Moderate | Warning | Oct 2025 |
| Woods Hole, MA | 2.10 | Sep 26 08:18 | Below flood stage | Warning | Nov 2024 |
| Solomons Island, MD | 2.06 | Sep 25 01:48 | Minor | Advisory | Oct 2025 |
| Turkey Point Hudson River NERRS, NY | 2.04 | Sep 26 13:54 | No NWS thresholds | None | Jul 2026 |
| Boston, MA | 2.03 | Sep 27 12:12 | Below flood stage | Warning | Aug 2026 |
| New Bedford Harbor, MA | 2.02 | Sep 28 09:30 | No NWS thresholds | None | Highest in record (since Feb 2023) |
| Chatham, MA | 2.01 | Sep 27 00:36 | Below flood stage | Warning | Aug 2026 |
| Eastport, ME | 1.88 | Sep 28 12:00 † | Below flood stage | None | Aug 2026 |
| Marcus Hook, PA | 1.88 | Sep 23 23:24 | Minor | Advisory | Jun 2026 |
| Fall River, MA | 1.87 | Sep 28 09:42 | Below flood stage | None | Jun 2026 |
| Conimicut Light, RI | 1.85 | Sep 28 09:42 | Below flood stage | None | Jun 2026 |
| Philadelphia, PA | 1.85 | Sep 24 00:42 | Minor | Advisory | Jun 2026 |
| Cutler Farris Wharf, ME | 1.84 | Sep 28 12:00 † | Below flood stage | None | Aug 2026 |
| Providence, RI | 1.79 | Sep 28 09:42 | Below flood stage | None | Jun 2026 |
| Bridesburg, PA | 1.77 | Sep 24 00:48 | Minor | Advisory | Jun 2026 |
| Delaware City, DE | 1.76 | Sep 23 22:42 | Minor | Advisory | Jun 2026 |
| Annapolis, MD | 1.72 | Sep 27 18:00 | Minor | Advisory | Apr 2026 |
| Burlington, Delaware River, NJ | 1.65 | Sep 27 03:36 | Minor | Advisory | Jun 2026 |
| Newbold, PA | 1.63 | Sep 27 03:54 | Below flood stage | Advisory | Jun 2026 |
| Bar Harbor, ME | 1.61 | Sep 28 12:00 † | Below flood stage | None | Aug 2026 |
| Coxsackie, Hudson River, NY | 1.52 | Sep 26 16:18 | No NWS thresholds | None | Jul 2026 |
| Nantucket Island, MA | 1.51 | Sep 26 00:00 | Minor | Warning | Aug 2026 |
| Portland, ME | 1.48 | Sep 28 12:00 † | Below flood stage | None | Aug 2026 |
| Chesapeake City, MD | 1.48 | Sep 24 22:00 | Below flood stage | None | Aug 2026 |
| Tolchester Beach, MD | 1.44 | Sep 27 20:12 | Below flood stage | None | Aug 2026 |
| Baltimore, MD | 1.40 | Sep 24 18:00 | Below flood stage | None | Aug 2026 |
| Seavey Island, ME | 1.39 | Sep 27 12:30 | Below flood stage | Advisory | Aug 2026 |
Peaks are in feet above mean higher high water (MHHW), the average of each day's higher high tide, from NOAA CO-OPS 6-minute data, September 22 at 12:00 to September 28 at 12:00 local time. The window starts on the day the first Coastal Flood Warnings were issued (Wakefield and Mount Holly, afternoon of September 22). Flood categories use each gauge's NWS minor, moderate and major thresholds, converted from station datum to MHHW. "NWS product in force at peak" is the strongest coastal flood product valid for the gauge's nearest land forecast zone at its peak time. "Last time this high" is the most recent earlier month, October 2012 through August 2026, whose highest 6-minute water level (NOAA CO-OPS, every month checked) reached the storm peak. September 2026 is left out because the storm itself raised water levels from September 22. Values for 2026 months are NOAA preliminary data. † Peak falls at the end of the analysis window, so it may be a normal tide and not the storm. Solomons Island hit 2.06 ft again on September 27 at 15:24, also under an advisory.
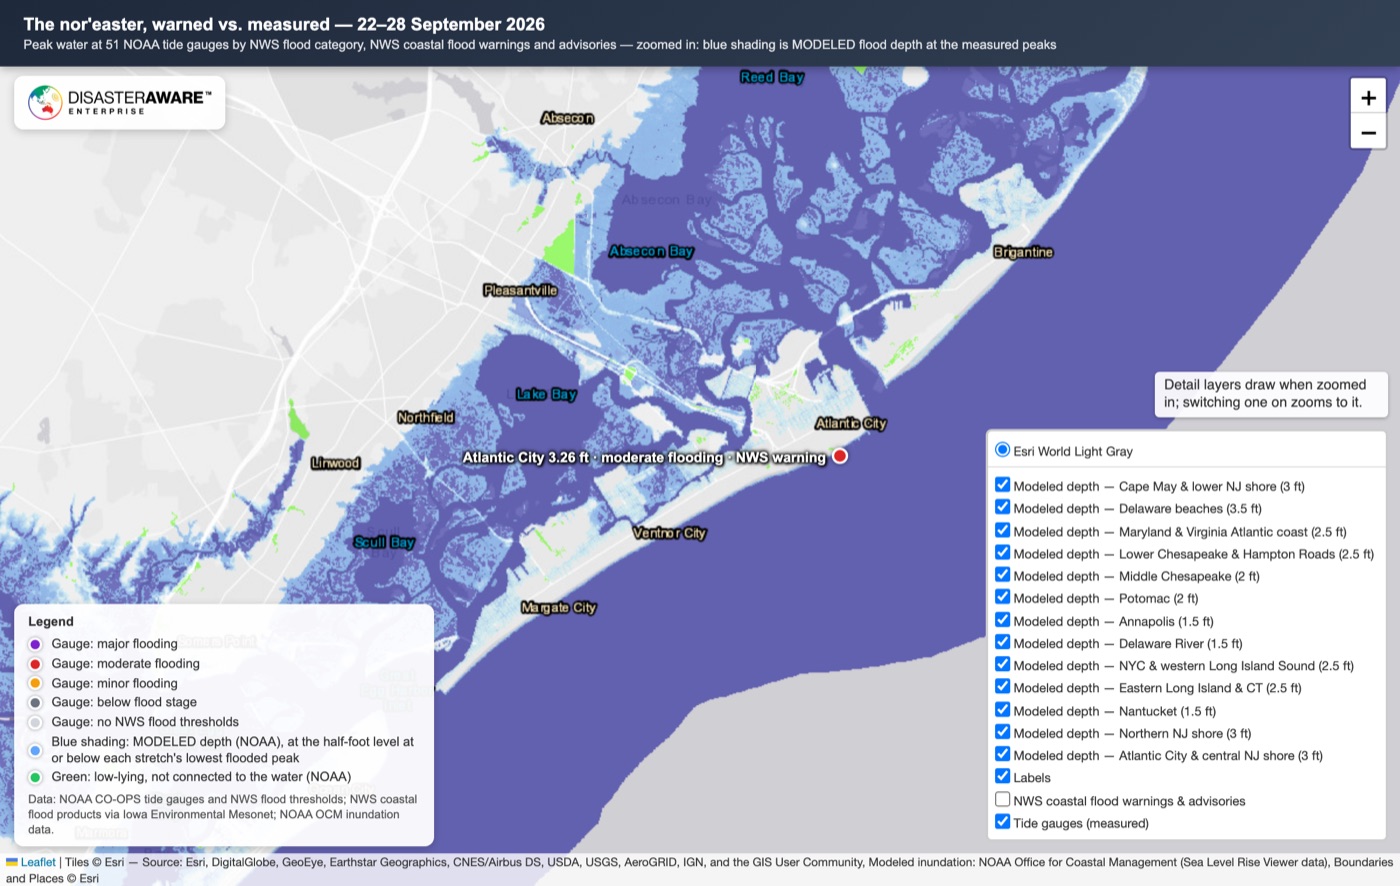
Atlantic City and the back bays at the measured peak. Blue shading is modeled: land below the 3-foot level in NOAA's inundation data (still water, no waves). Green is low ground not connected to the water.
Know which warnings verified, gauge by gauge
DisasterAWARE puts issued warnings and observed impacts on one map — with the people, infrastructure and assets inside each footprint.
For each gauge we took its nearest NWS public forecast zone on land and checked which coastal flood product, if any, was valid there at the minute the water peaked:
Two results stand out. First, no gauge flooded without an NWS product in force, and every moderate or major gauge had the stronger product, a warning. Second, the overshoot was concentrated in Massachusetts. Boston peaked at 2.03 ft against a 2.23 ft minor threshold, a near miss. Chatham (2.01 ft against 2.93 ft) and Woods Hole (2.10 ft against 3.29 ft) were not close.
The gauges miss some of the flooding the warnings covered. NWS storm reports describe 2 to 3 feet of water in Old Howard Beach, Queens; 27.5 inches on Brookville Boulevard near JFK, measured by NYC FloodNet sensors; 1.5 to 3 feet near Misquamicut State Beach in Westerly, RI; hotel evacuations along the Black Horse Pike near Pleasantville, NJ; and Morrissey Boulevard in Boston closed on September 26 and partly closed again on September 27, even though the Boston gauge stayed below flood stage.
The flood-depth layer. The map's blue shading asks: if the water stood at the level the gauges measured, which land would be under it? We grouped the 30 flooded gauges into 13 stretches of coast. For each stretch we drew NOAA's inundation layer at the half-foot step (the increments NOAA publishes) at or below the lowest flooded peak in that stretch. For example, we used 3.5 ft for the Delaware beaches, 3 ft for the New Jersey shore, 2.5 ft for Hampton Roads and for New York City and western Long Island Sound, 2 ft for the Potomac, and 1.5 ft for Annapolis, the tidal Delaware River and Nantucket. It is modeled still water, without waves, runup, levees or drains: a guide to exposure, not a map of what flooded.
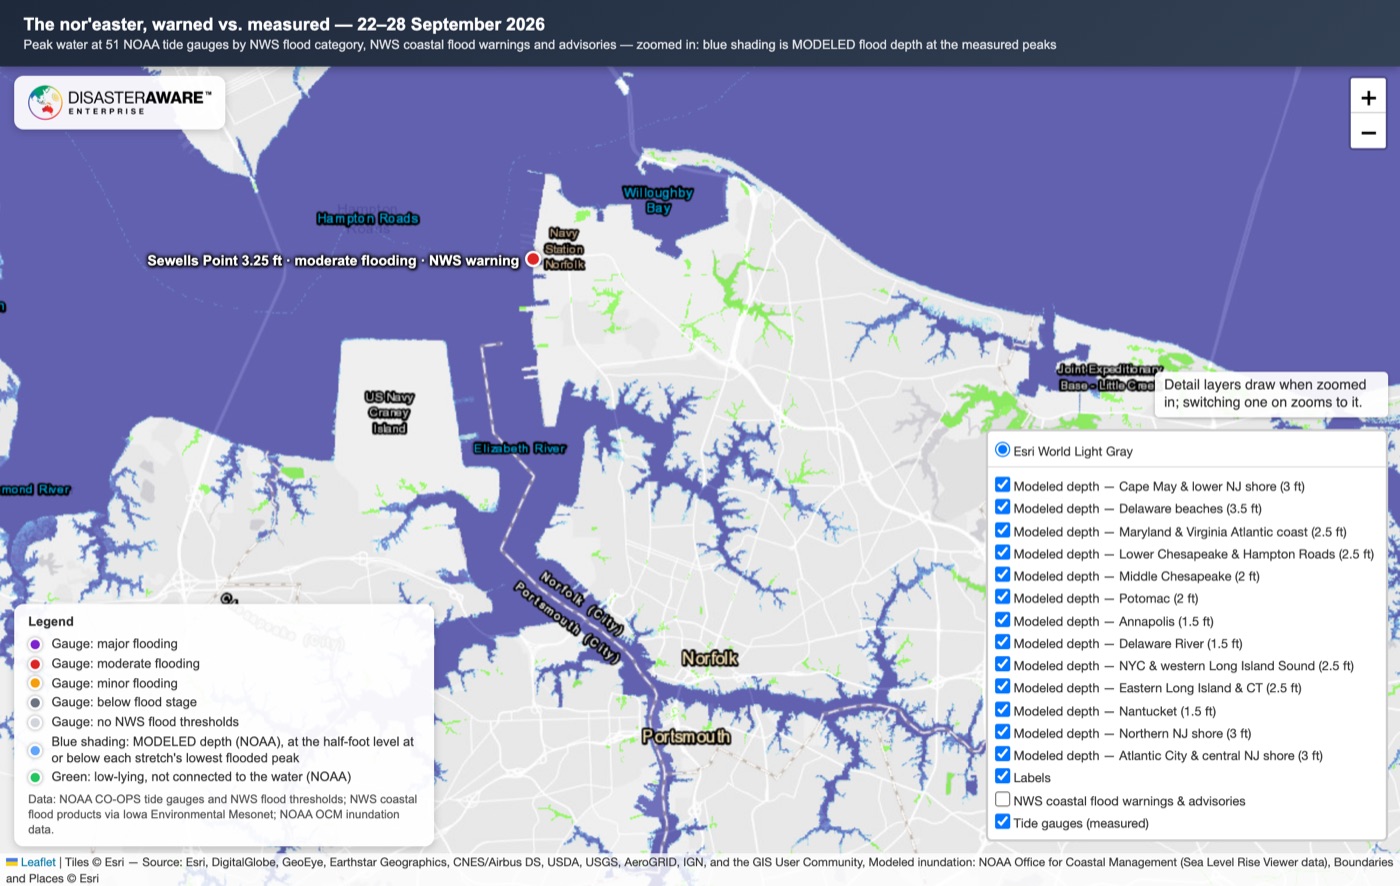
Norfolk and Portsmouth, with Sewells Point at 3.25 ft (moderate, evening of September 24) under a Coastal Flood Warning. The shading is modeled depth at the 2.5-foot level used for Hampton Roads.
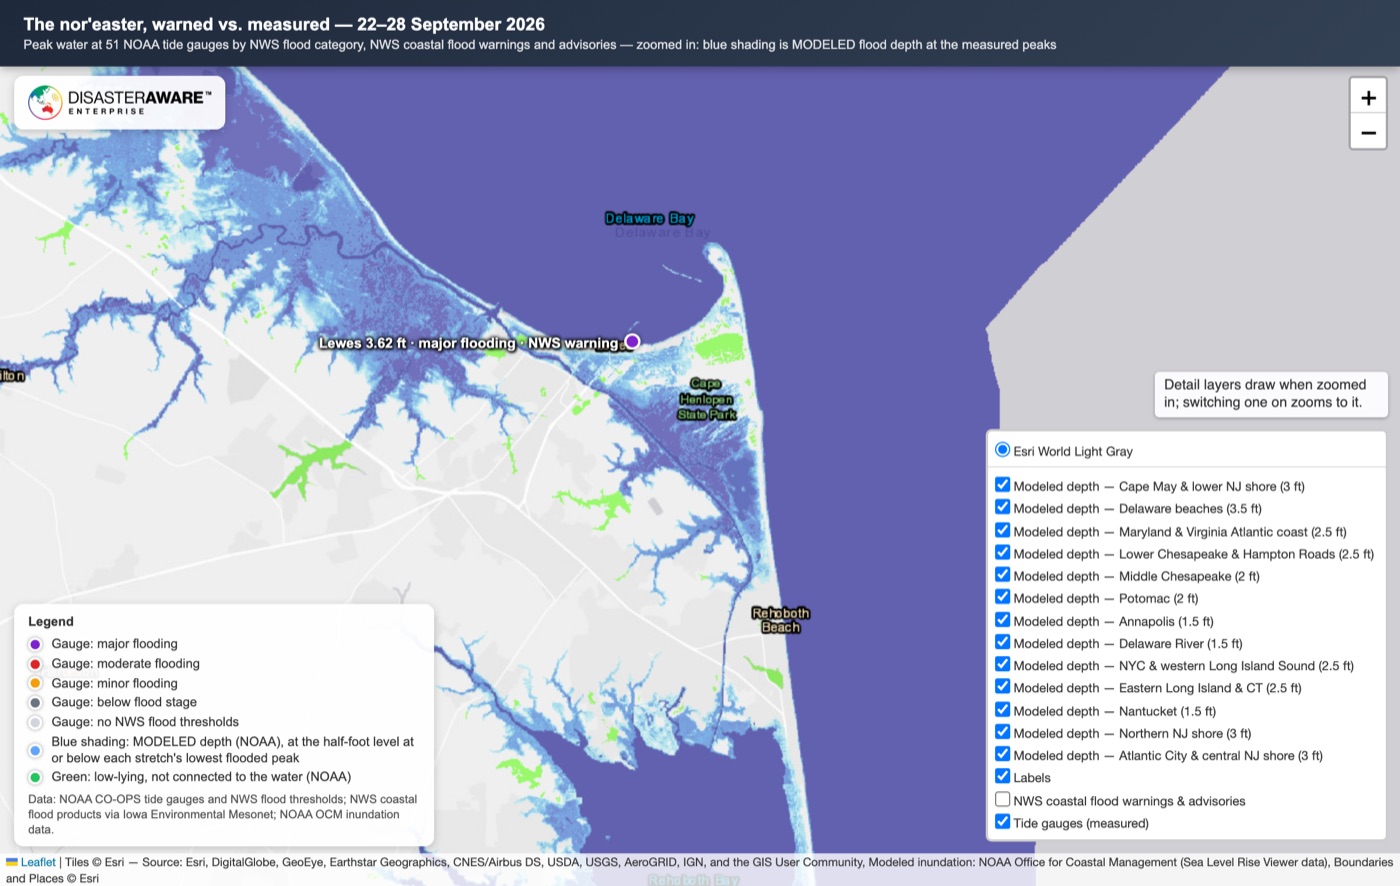
Lewes, Delaware, the highest peak of the 51 gauges (3.62 ft, major), shown at the 3.5-foot modeled level.
The wind was strongest on the outer coast: Long Island, Block Island, Cape Cod and the Jersey Shore. The highest gust in the NWS post-storm statements was 81 mph at Montauk Point, NY. Others included 74 mph at Surf City, NJ; 71 mph at New Shoreham on Block Island, RI and at Stony Brook, NY; 70 mph near Island Beach State Park, NJ and near Wellfleet, MA; and 69 mph at Harvey Cedars, NJ and near Salisbury, MA. Three NWS offices, Mount Holly, New York and Boston, issued High Wind Warnings.
As of October 1, the NWS storm reports for the period include 125 reports of wind damage not linked to thunderstorms, plus 3 linked to them. Most describe trees and limbs down on roads, cars, houses and wires; 45 of the 128 wind-damage reports mention wires, poles or power. New York (77 reports) and Massachusetts (74) had the most reports of any kind. The trees caused the storm's casualties:
Rain was heaviest near the coast from New Jersey to southeastern Massachusetts. Storm totals reached 8.73 inches at Blue Hill, MA (72 hours to 8 a.m. on September 28), 8.70 inches near Neptune City, NJ, and 6.64 inches near Commack, the most on Long Island. The storm reports include 12 flood and 5 flash flood reports from Massachusetts during the September 26 to 28 rain, and 9 flash flood reports of flooded streets and roads in Virginia on September 22 and 23.
Not included: power-outage totals. Figures we saw in press coverage could not be matched to an official utility or state source before publication, so we left them out.
On the alert side, the record is several dozen NWS products: 32 coastal flood products, plus wind and flood products. Each is a forecast with a defined area. On the observed side, the record is 51 gauge peaks, 257 storm reports and 40 NWS public information statements. Those measurements tell you whether a forecast verified. The warnings told people the water would come, and the gauges show it did.
A nor'easter tests any hazard feed: one weather system produces dozens of separate warnings, advisories and reports from Virginia to Maine. To use those records, you need to put the alert and the measurement on the same map and check the people, assets and supply routes inside each zone. That is the approach this brief takes, and it is what observed flood intelligence means for coastal flood risk.
Was the September 2026 nor'easter as bad as Hurricane Sandy? No. At Kiptopeke, VA and Ocean City Inlet, MD, the September 26 peak was the highest water since Sandy in October 2012, but Sandy was still about 0.8 ft higher at both gauges (3.89 ft vs. 3.10 ft at Kiptopeke and 3.58 ft vs. 2.77 ft at Ocean City Inlet, 6-minute data). At the other 28 flooded gauges, the water had been as high at least once between January 2016 and August 2026.
How high did the water get at Atlantic City in the September 2026 nor'easter? NOAA's Atlantic City tide gauge peaked at 3.26 feet above mean higher high water at 8:06 a.m. EDT on September 26, 2026. That is moderate flooding by NWS thresholds (moderate starts at 2.40 ft, major at 3.40 ft) and the gauge's highest reading since January 2016, when it reached 3.42 ft.
Did the National Weather Service warn for the coastal flooding? Yes. All 17 tide gauges that reached moderate or major flooding were inside an NWS Coastal Flood Warning when they peaked, and all 30 gauges that reached flood stage had a warning or advisory in force. Warnings also covered three Massachusetts gauges, Woods Hole, Boston and Chatham, that stayed below flood stage.
What does "feet above MHHW" mean? MHHW, mean higher high water, is the average height of the higher of each day's two high tides at a gauge. A reading of 3 feet above MHHW means the water stood 3 feet above a normal high tide. NWS flood thresholds vary from gauge to gauge, so the same height can be minor flooding at one place and major at another.
Does the flood-depth map show where it actually flooded? No. The blue shading is modeled. It is NOAA's inundation data drawn at the water level the gauges measured, showing which land sits below that level and is connected to the water. It leaves out waves, runup, levees and drainage. Treat it as a picture of exposure. For confirmed flooding, use the gauge readings and the NWS storm reports.
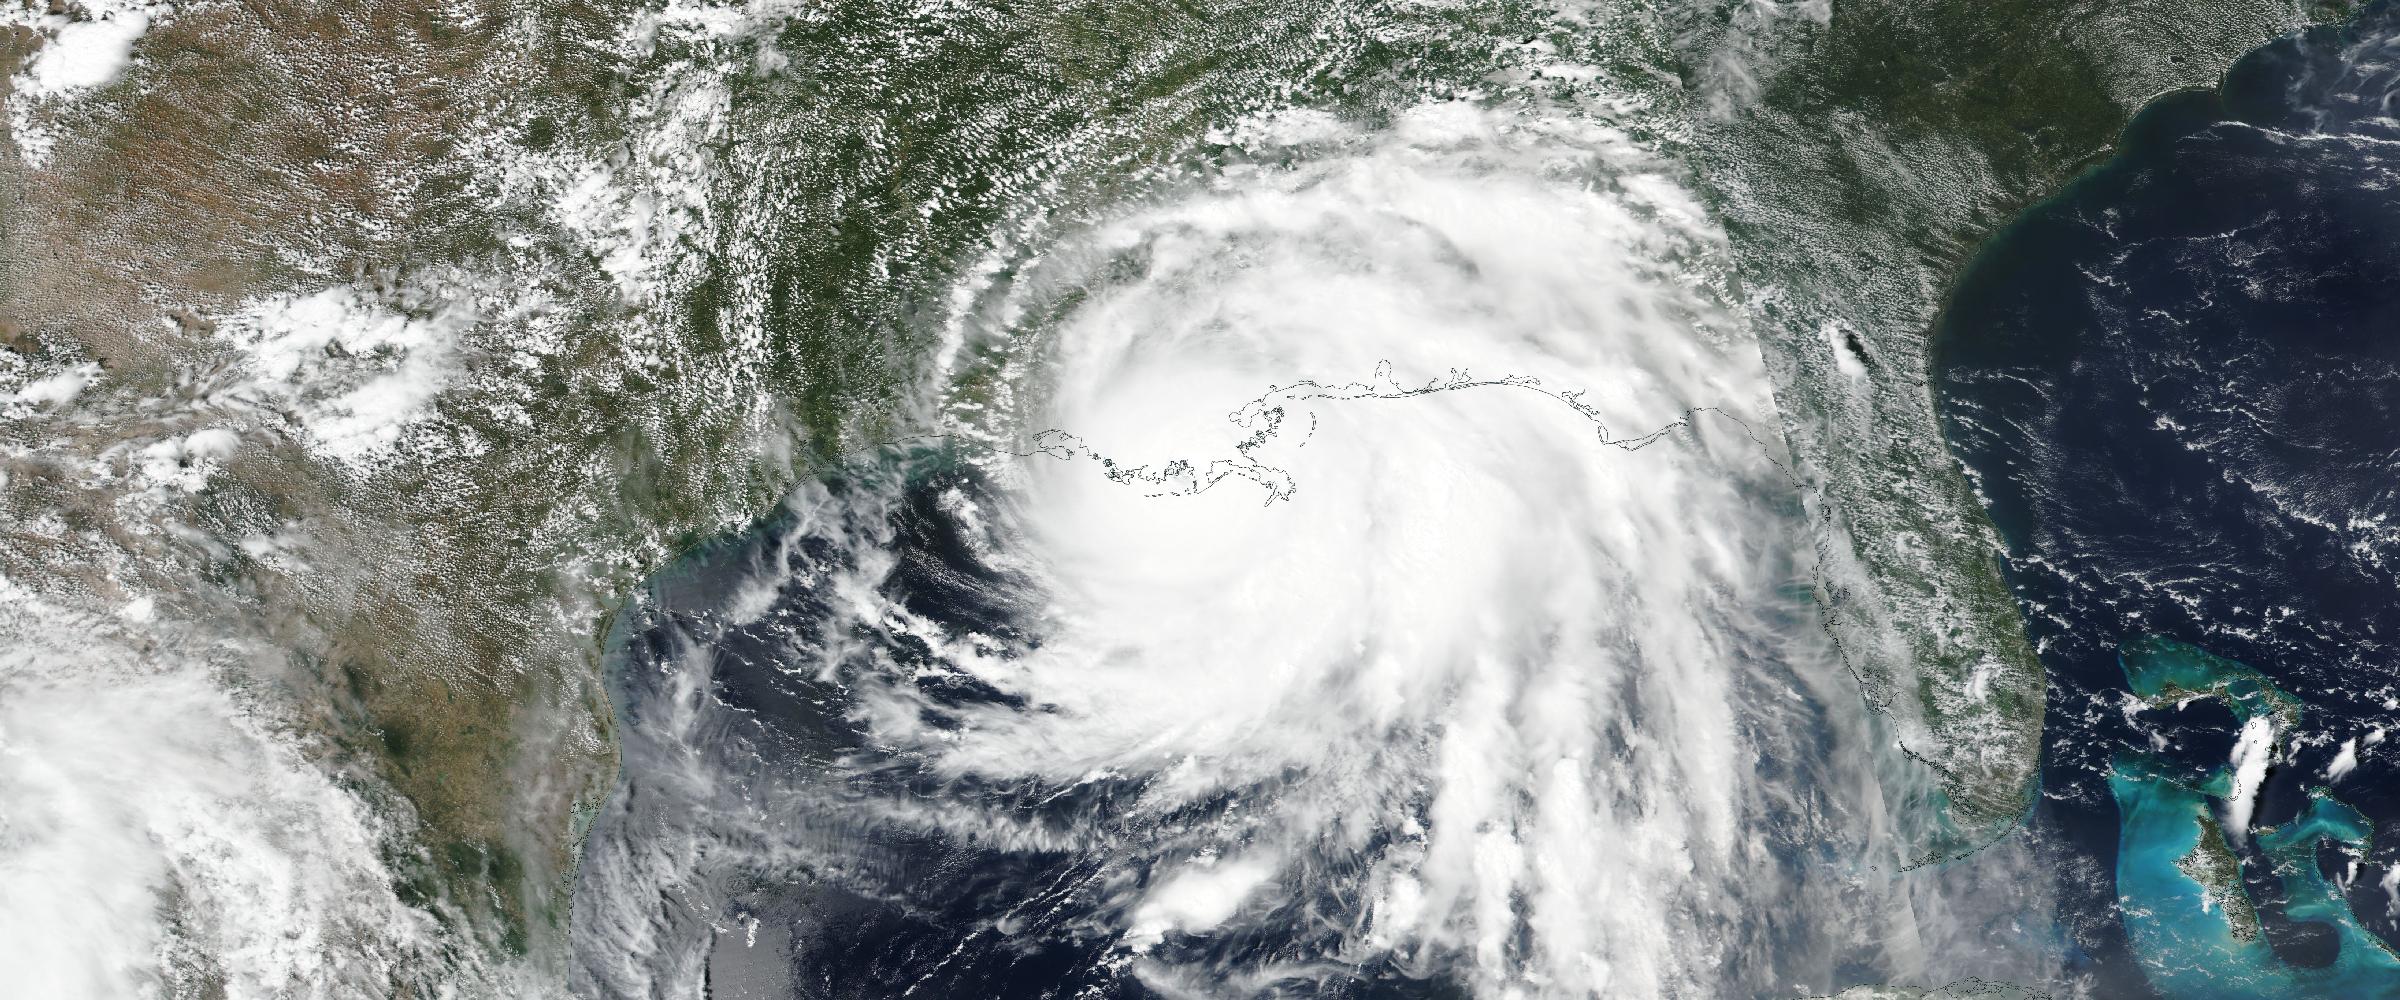
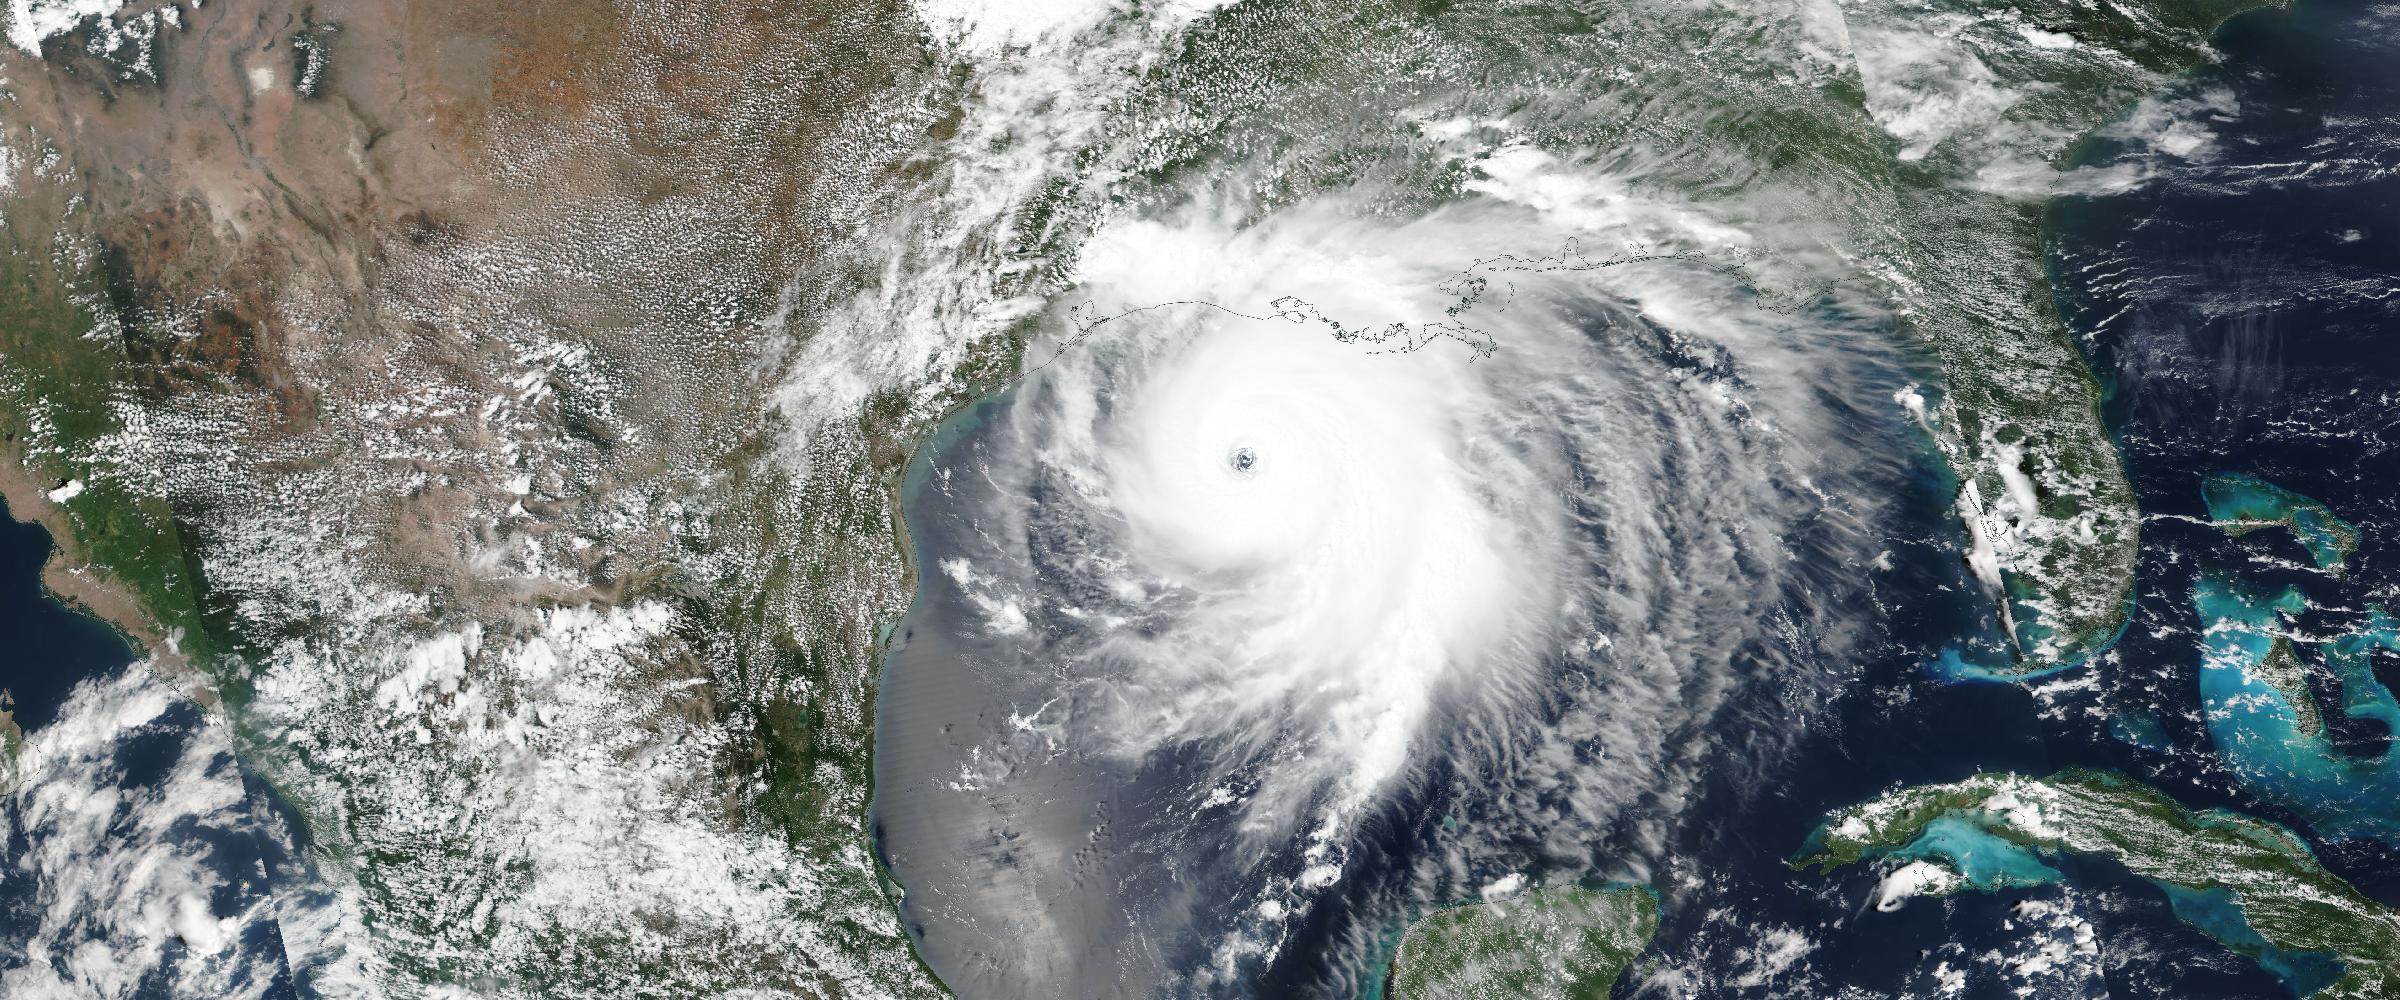
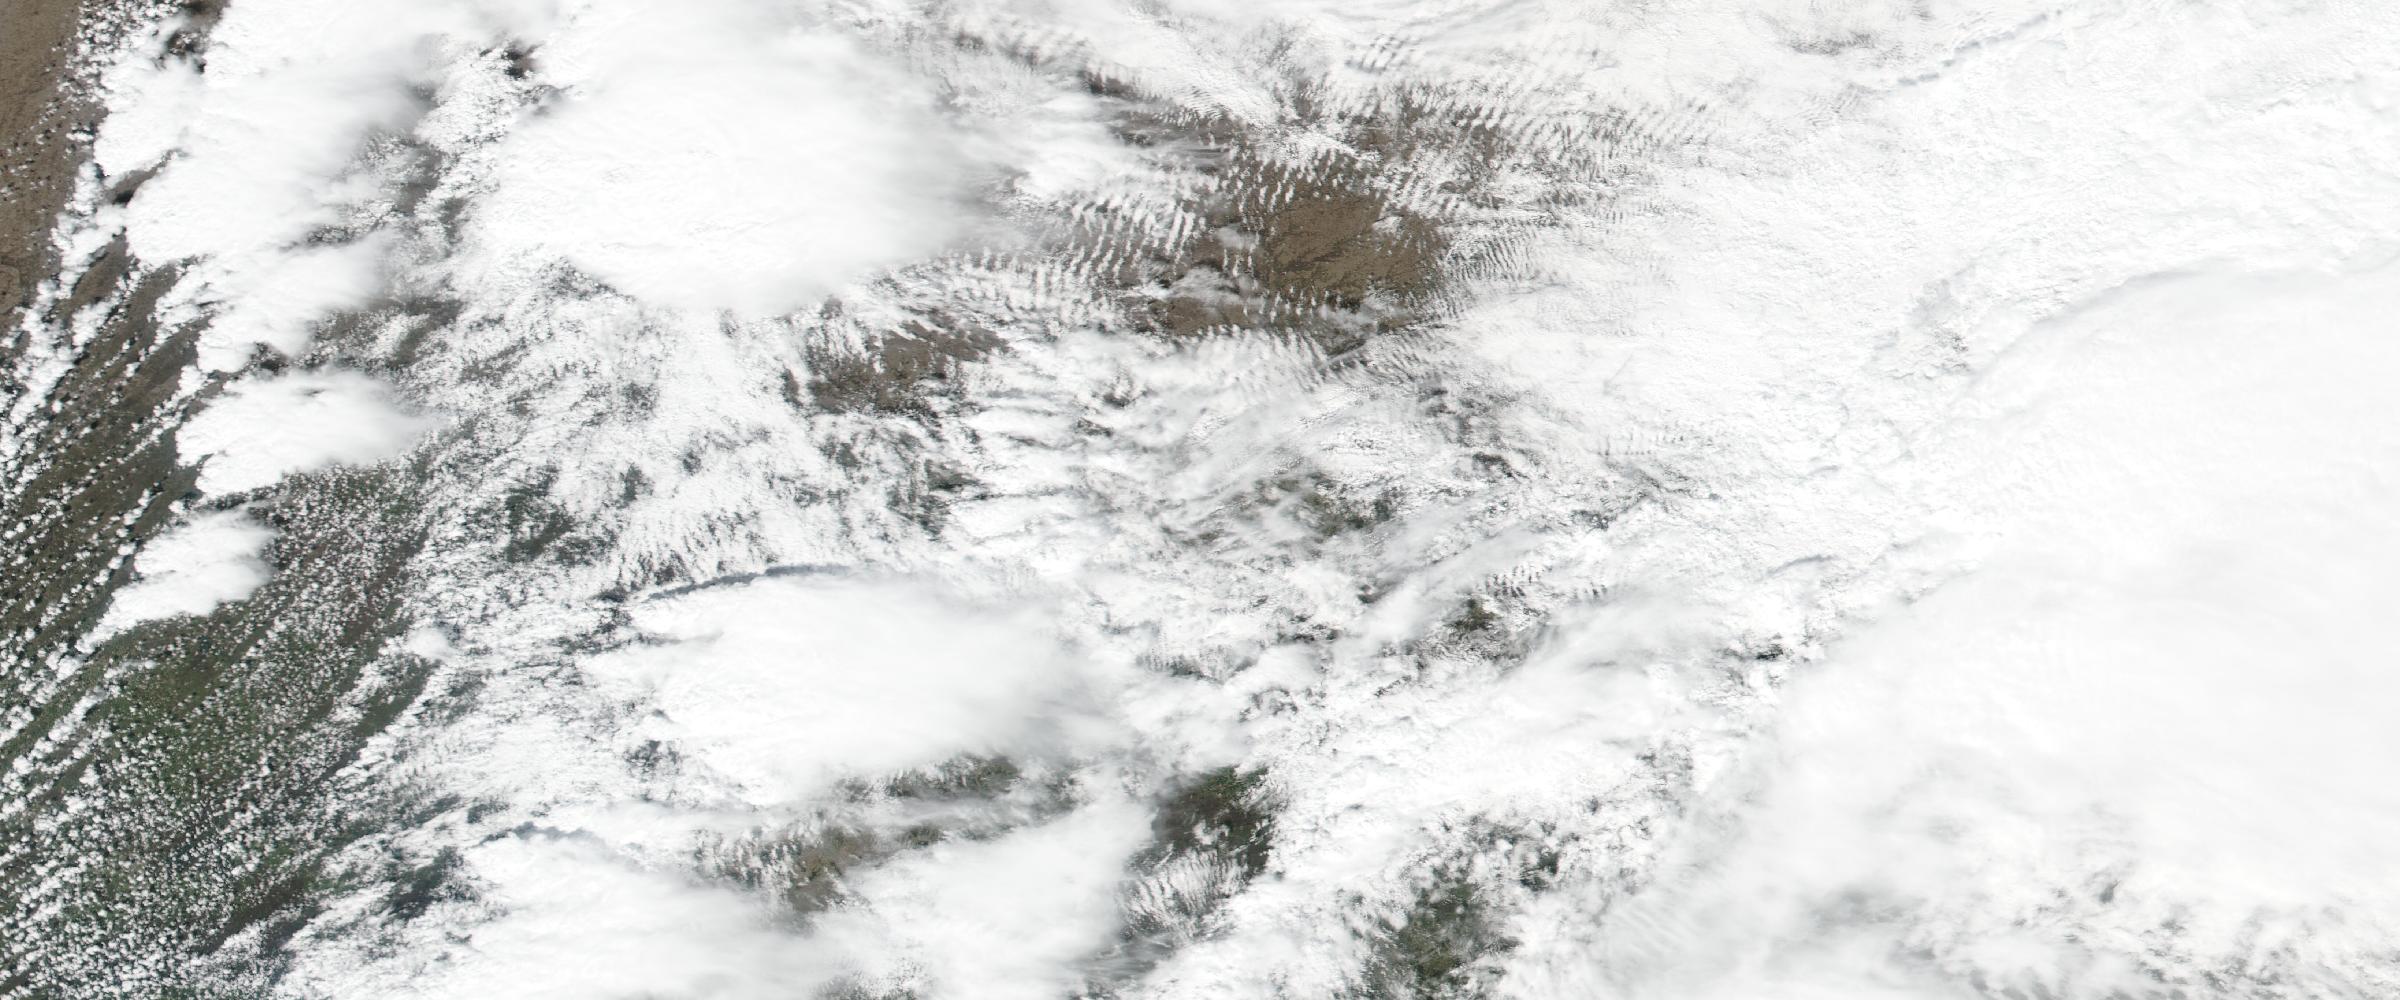
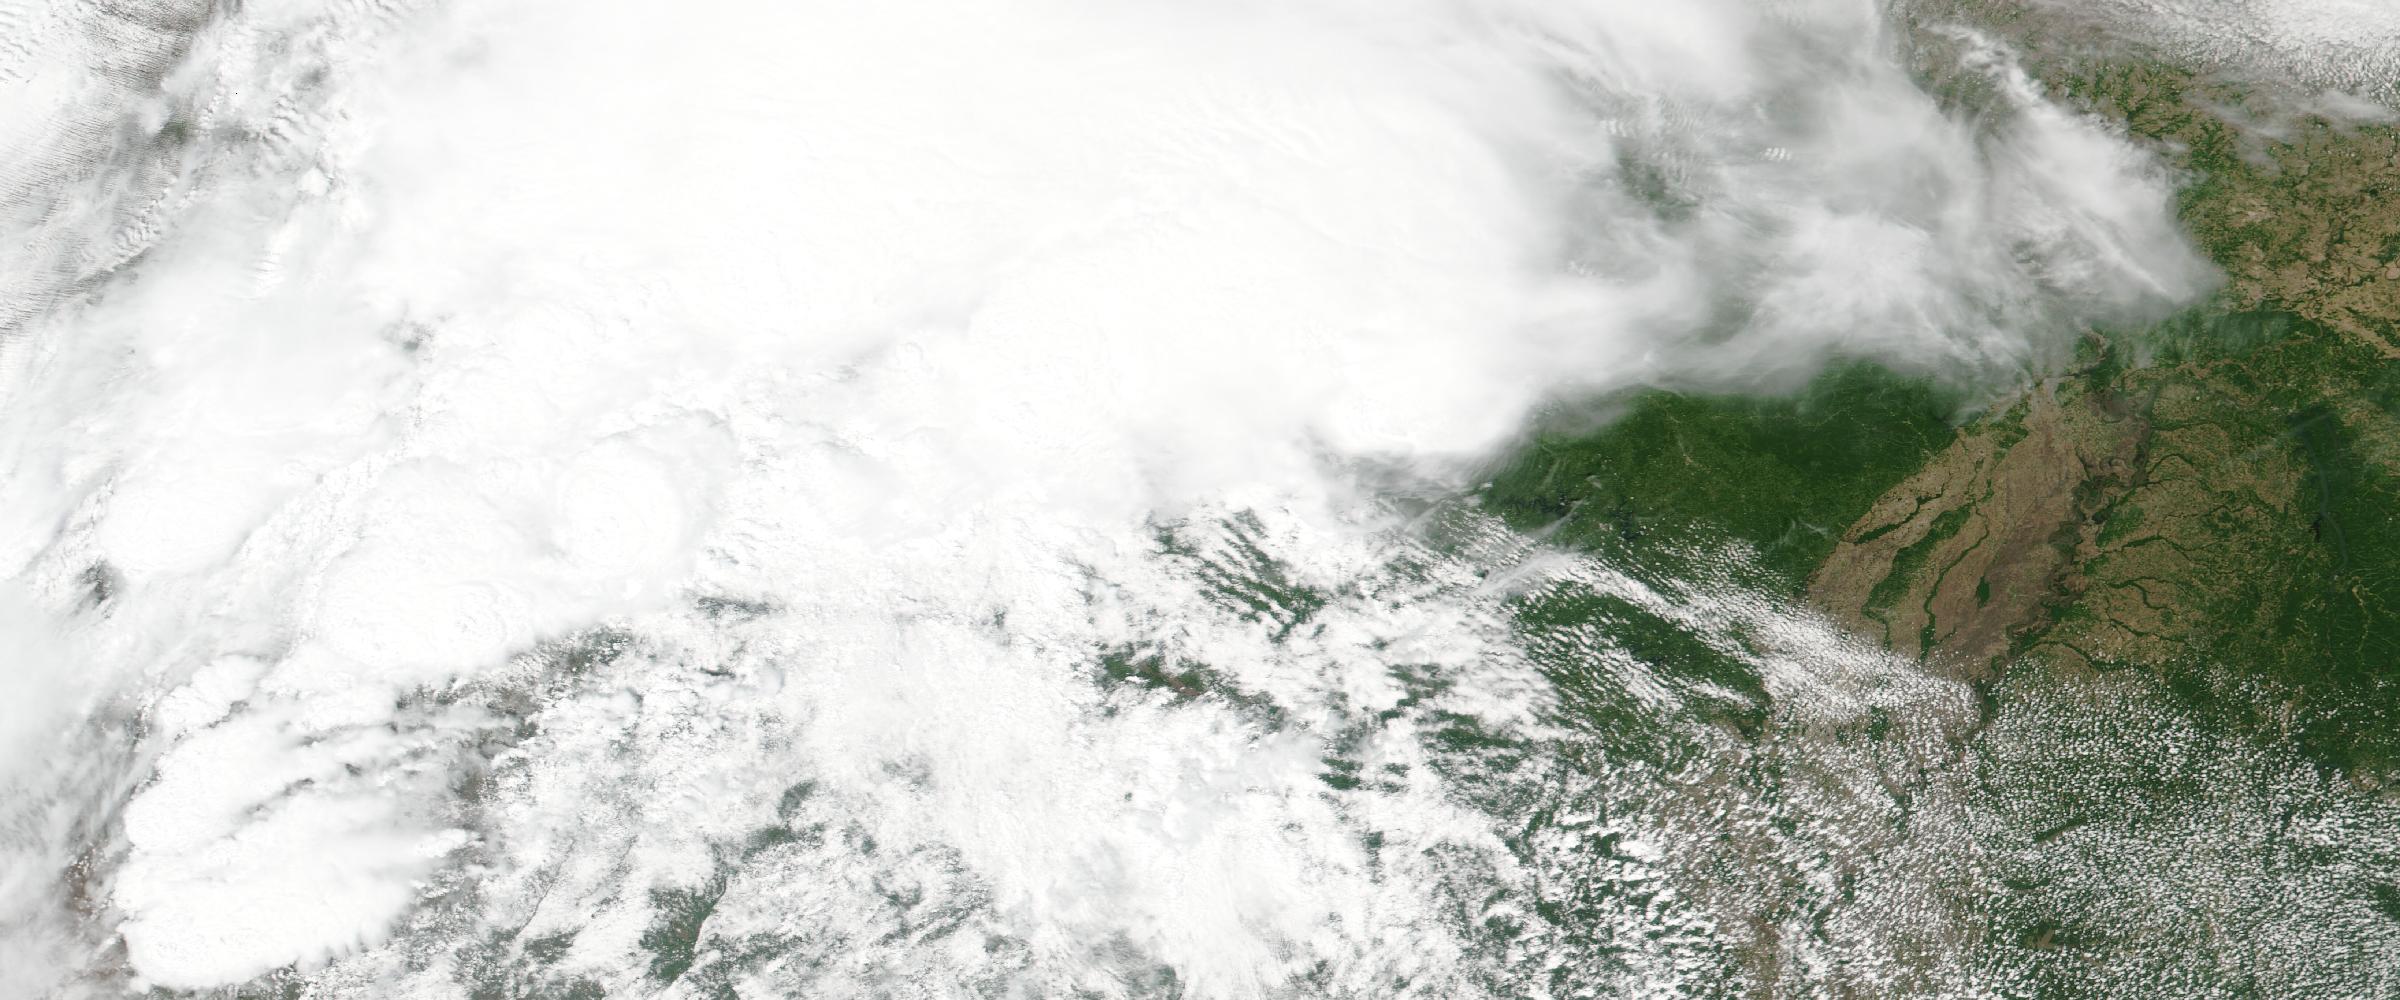
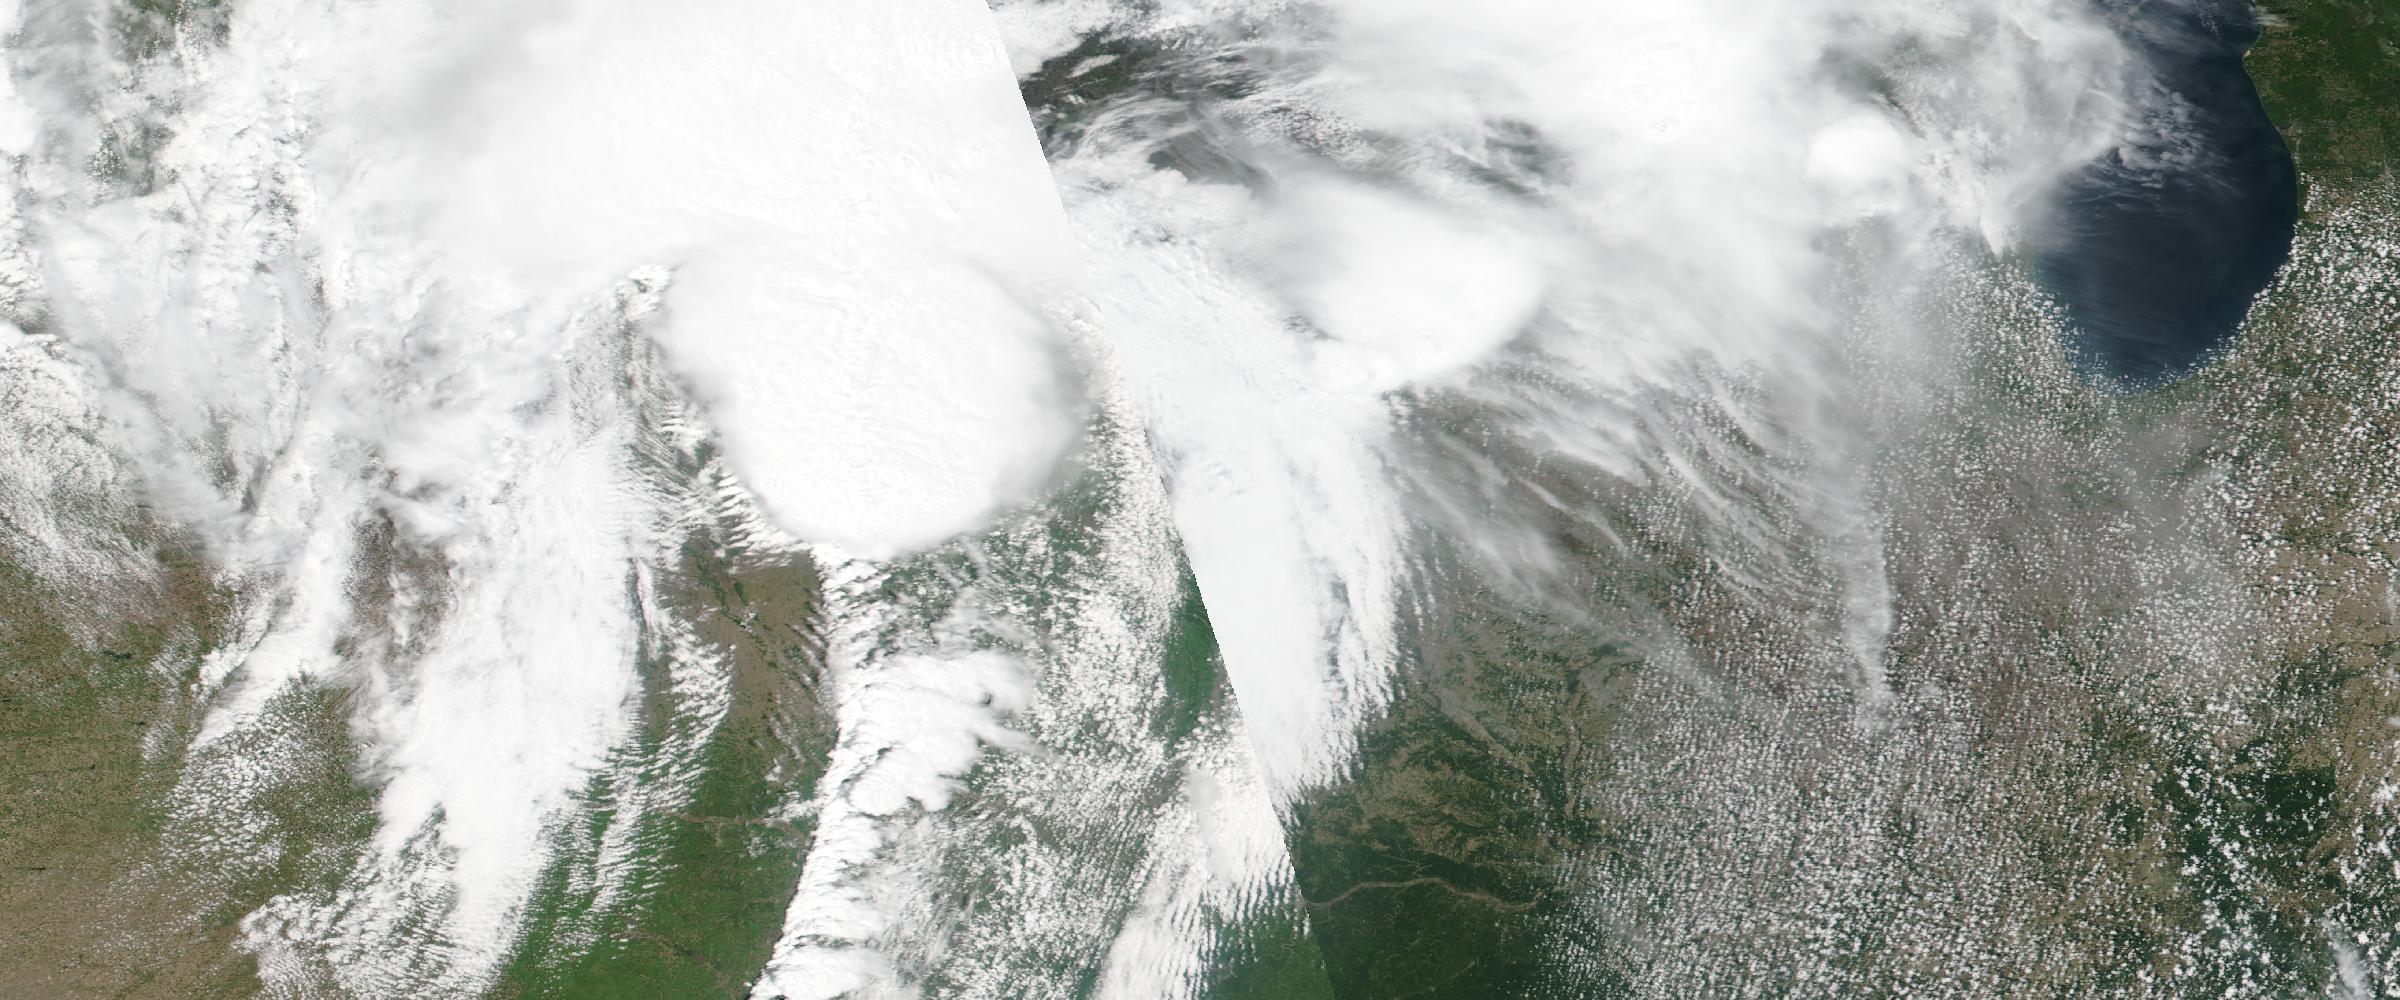
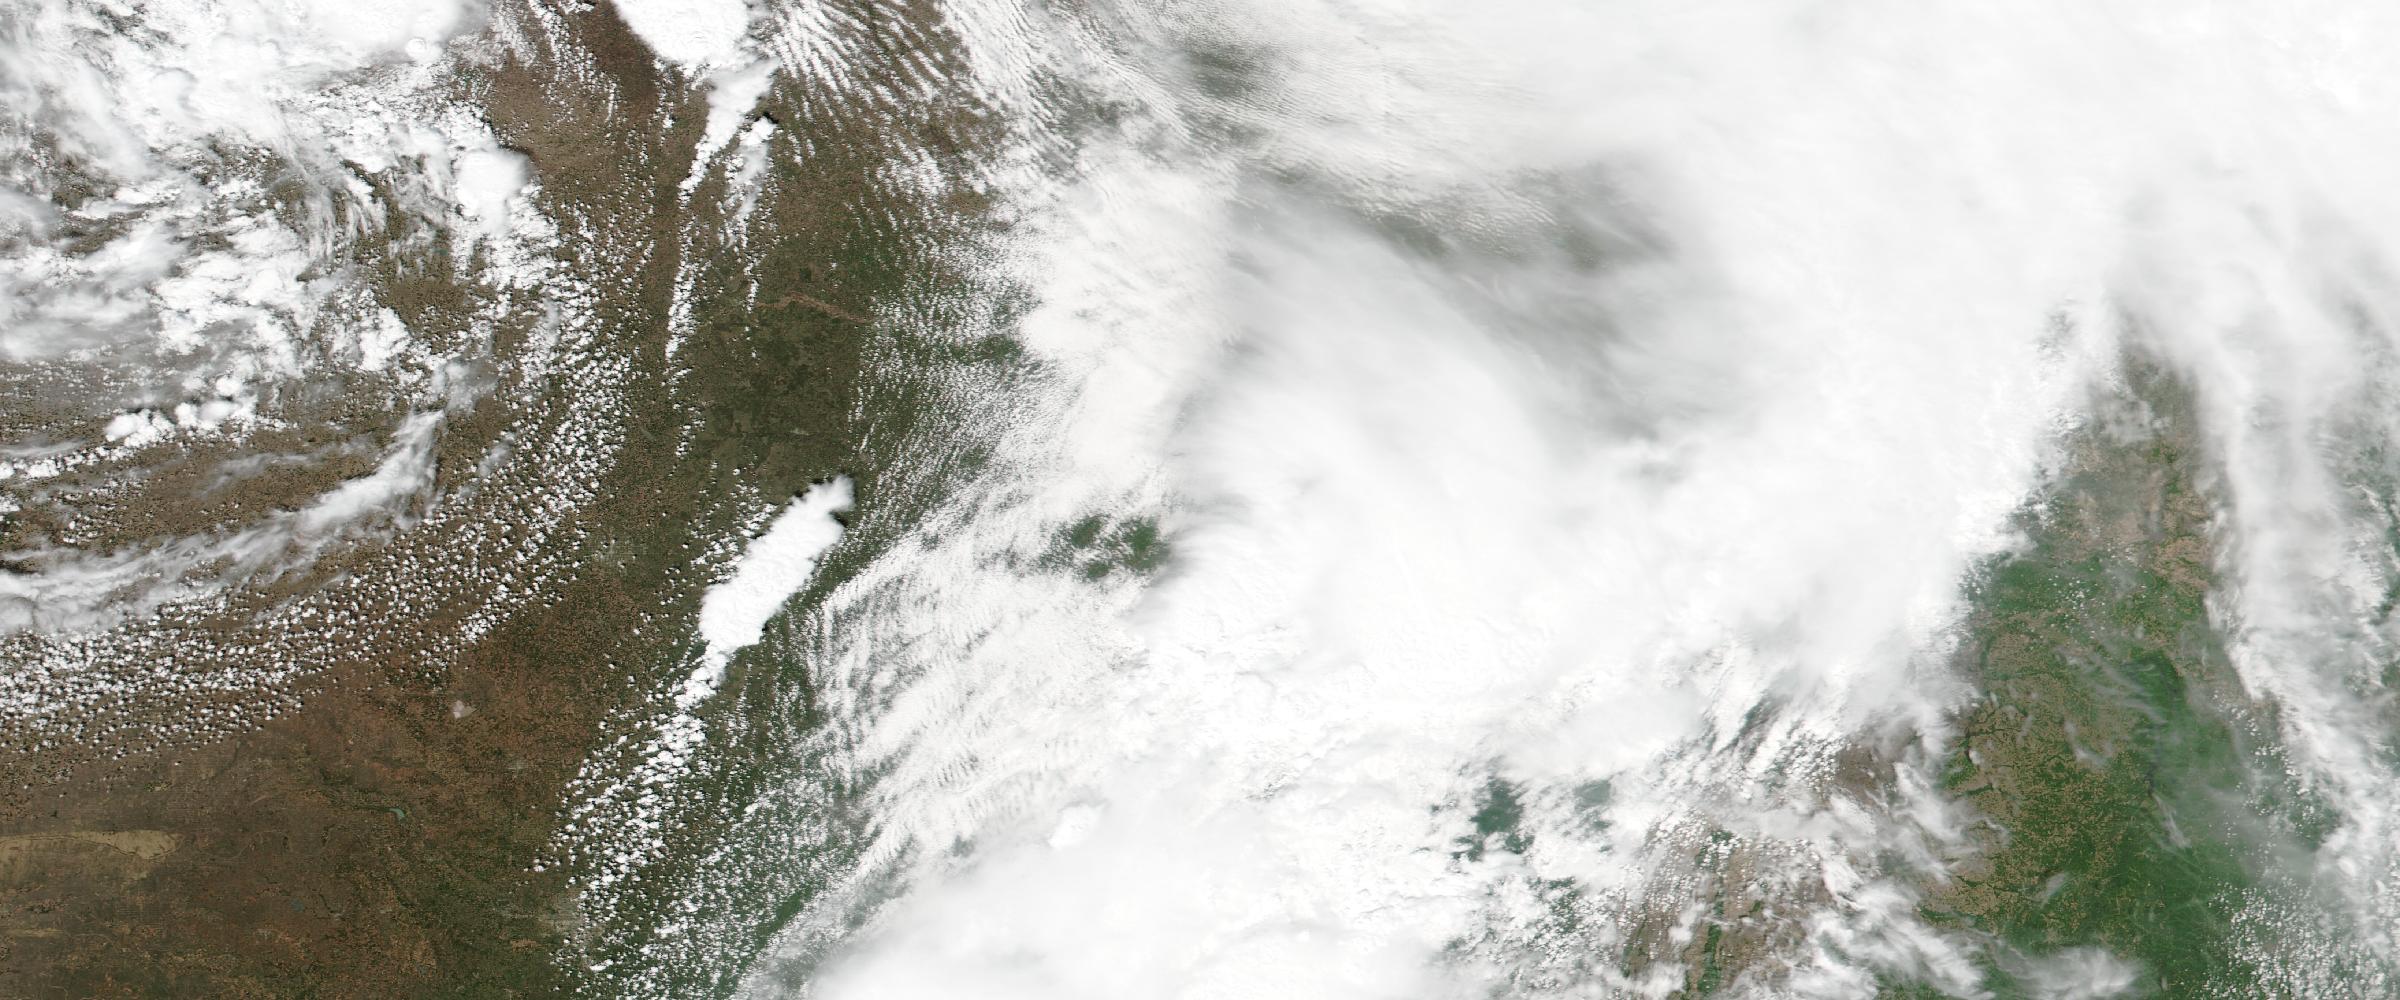
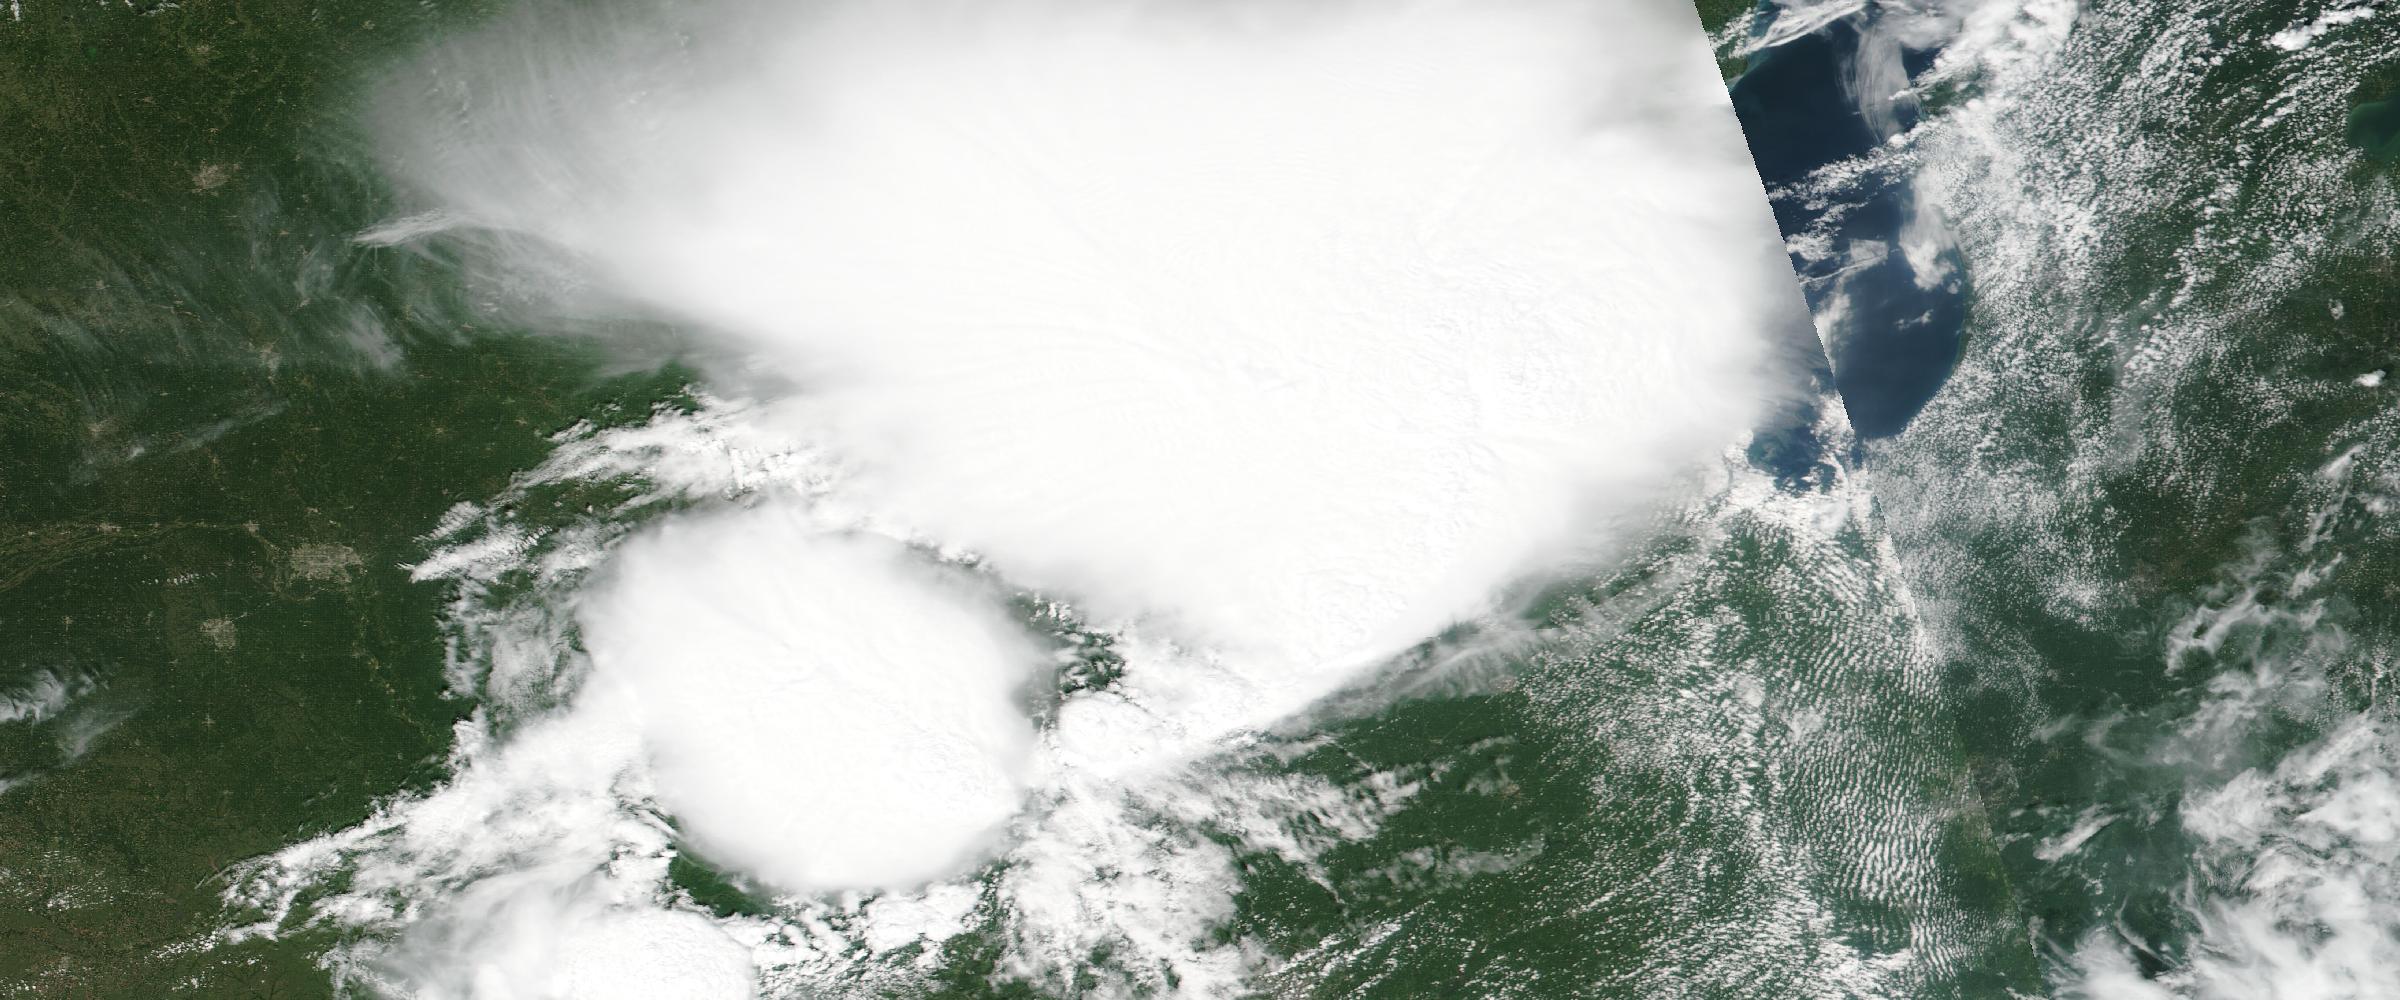
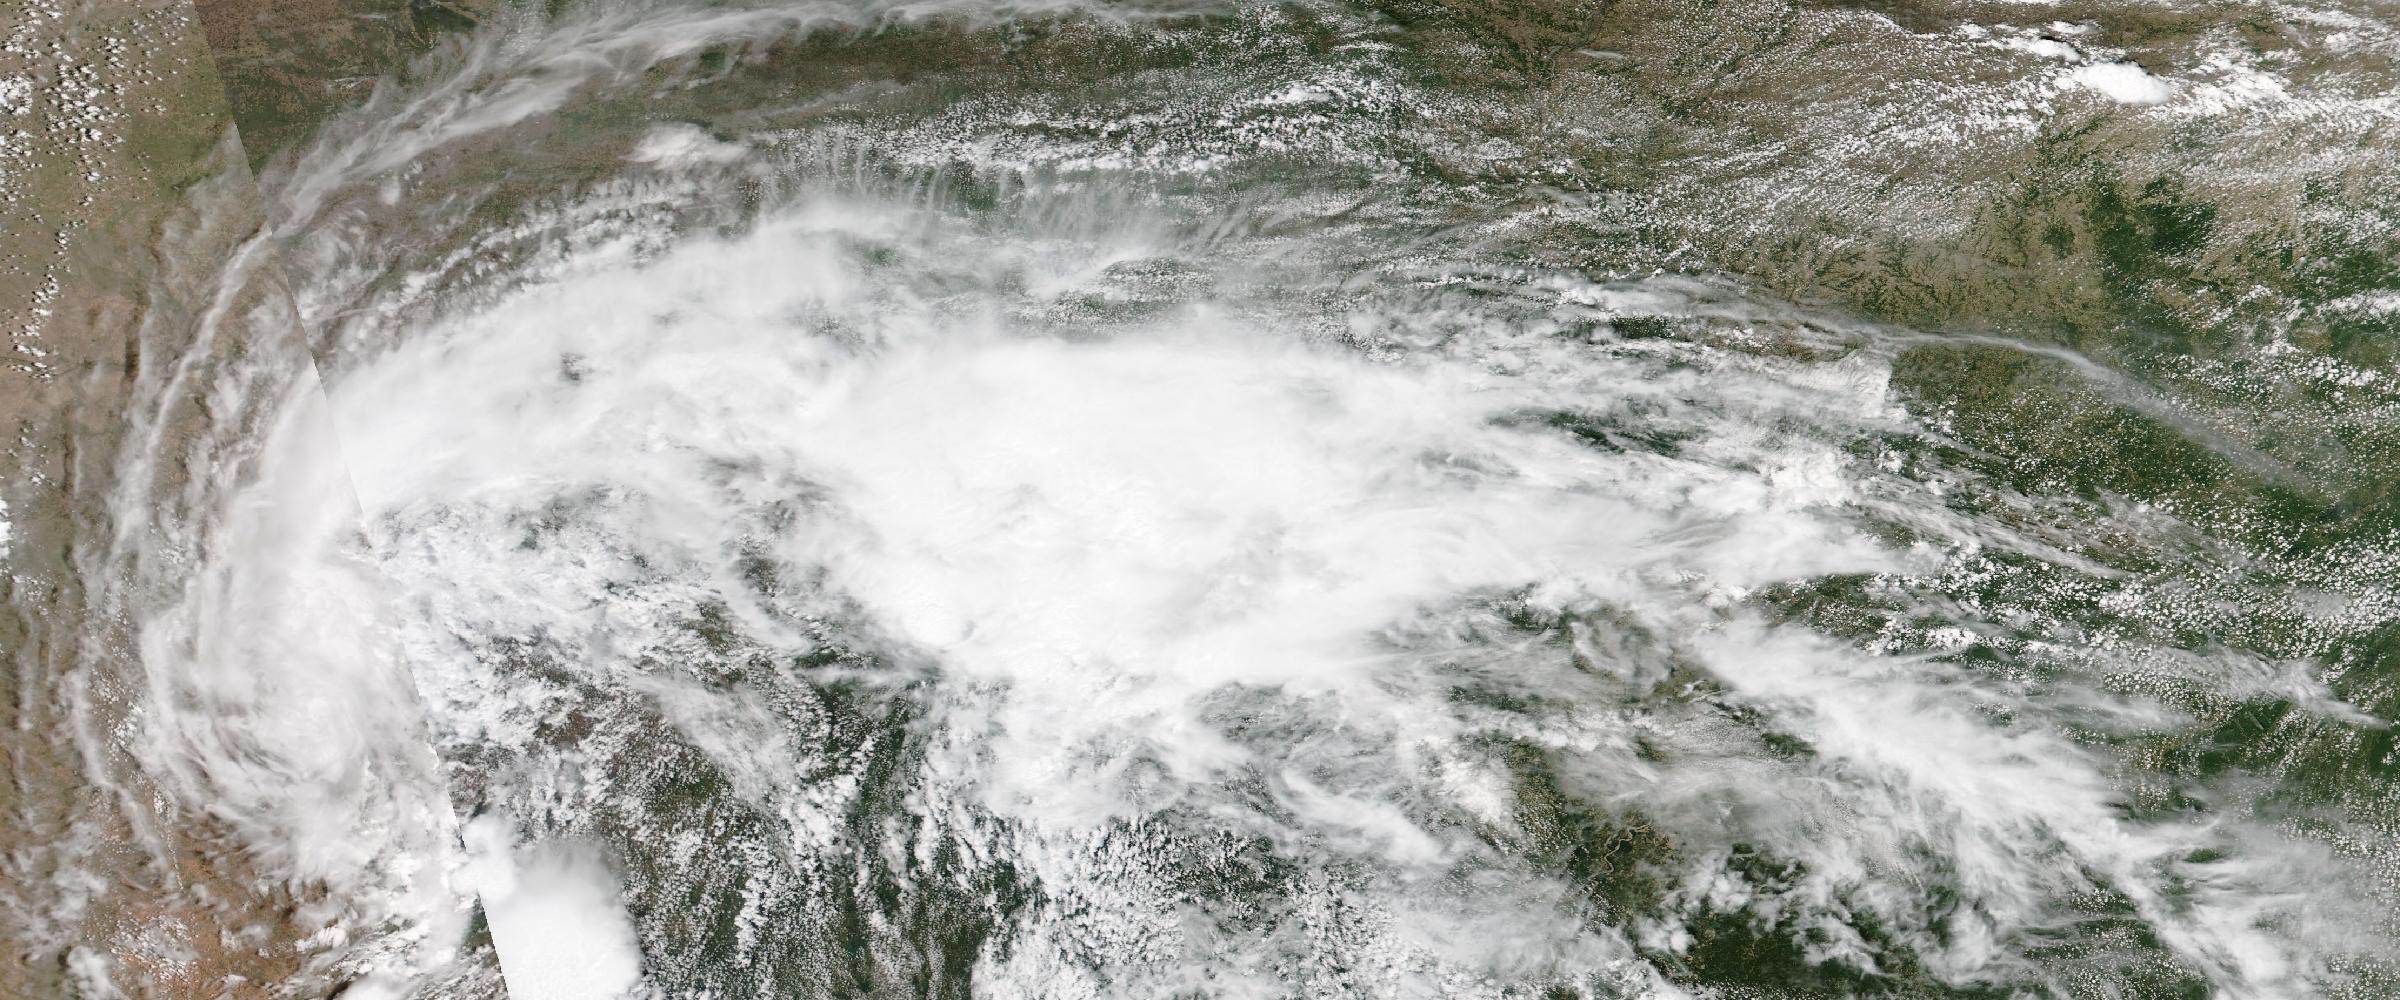
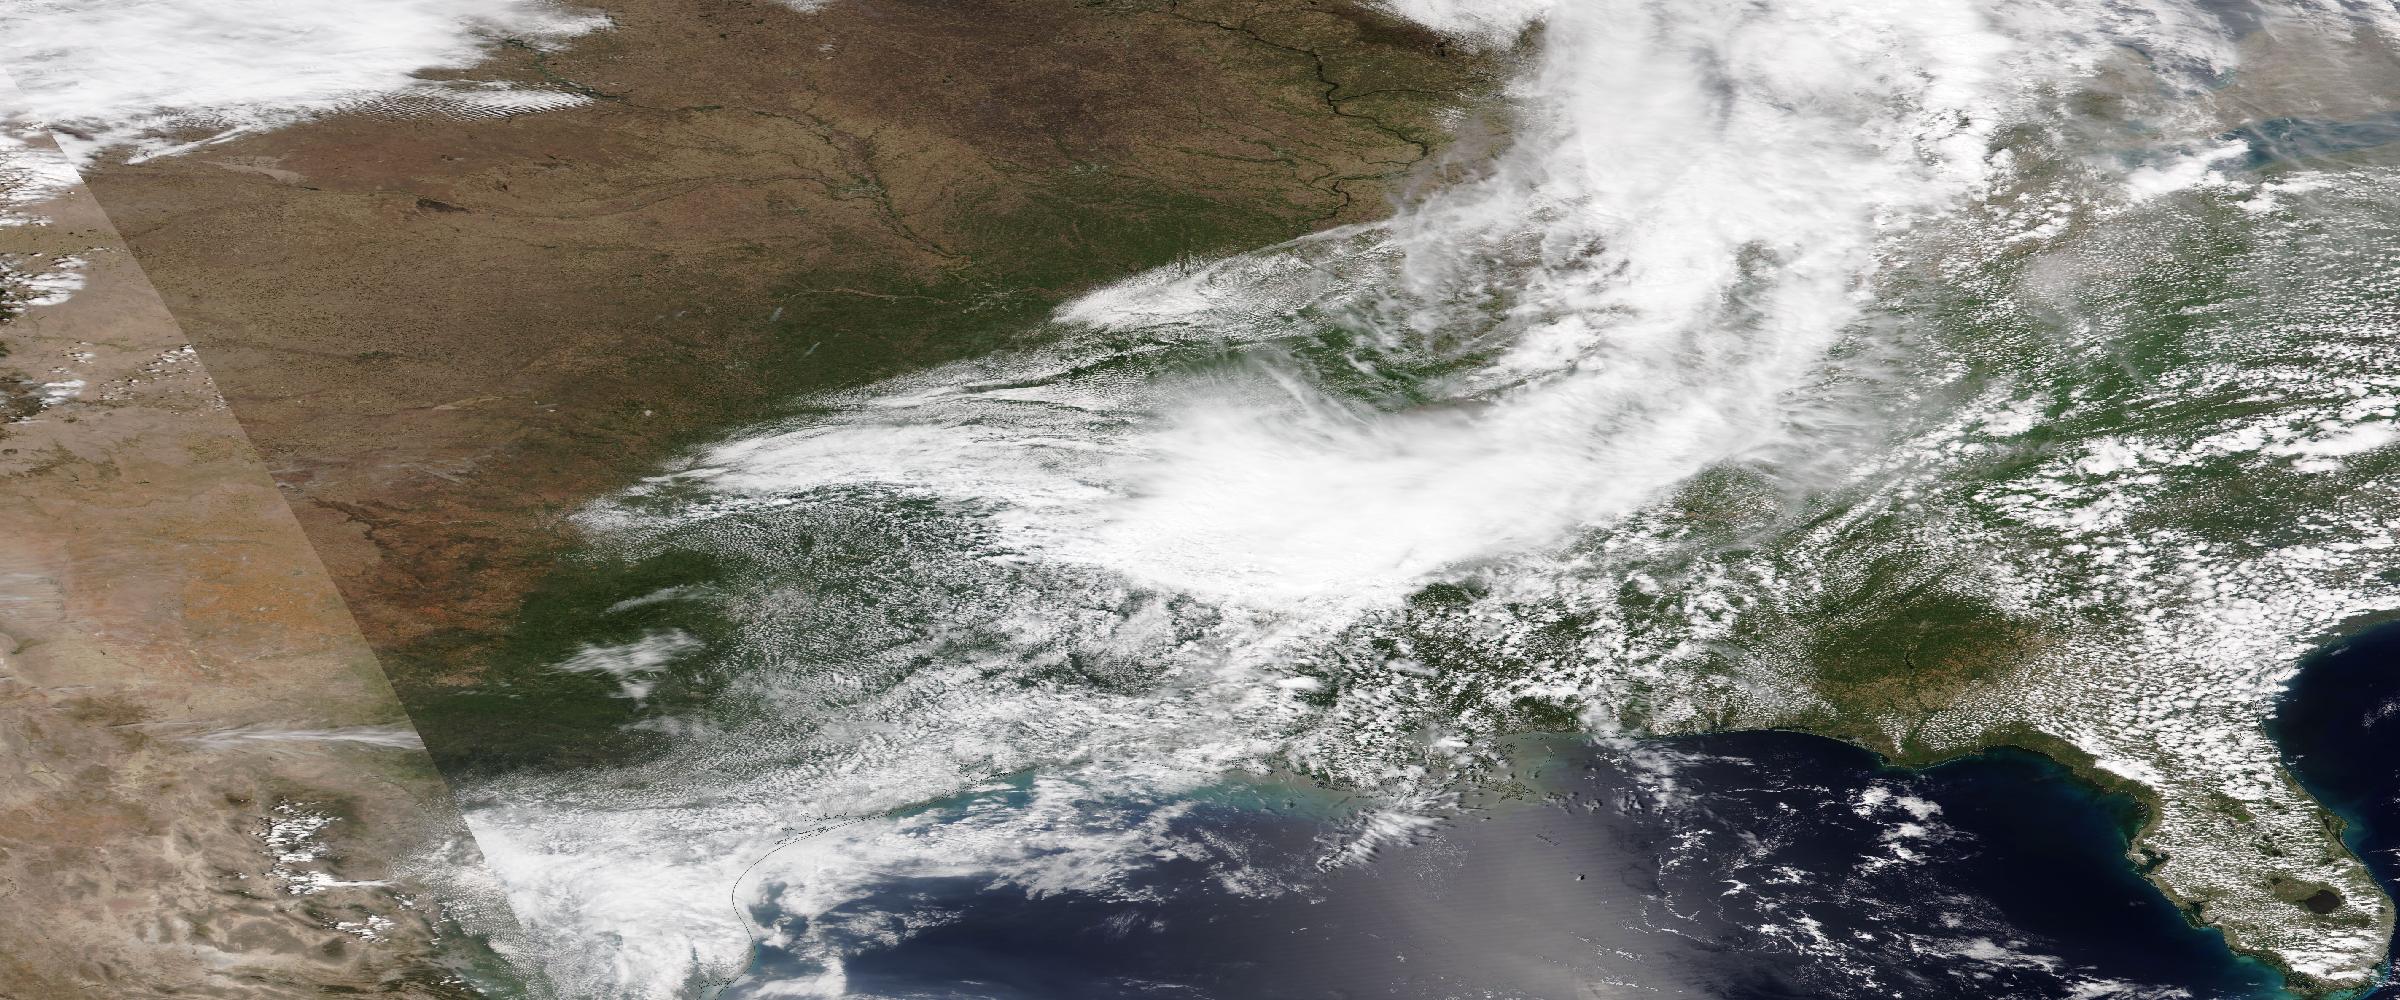
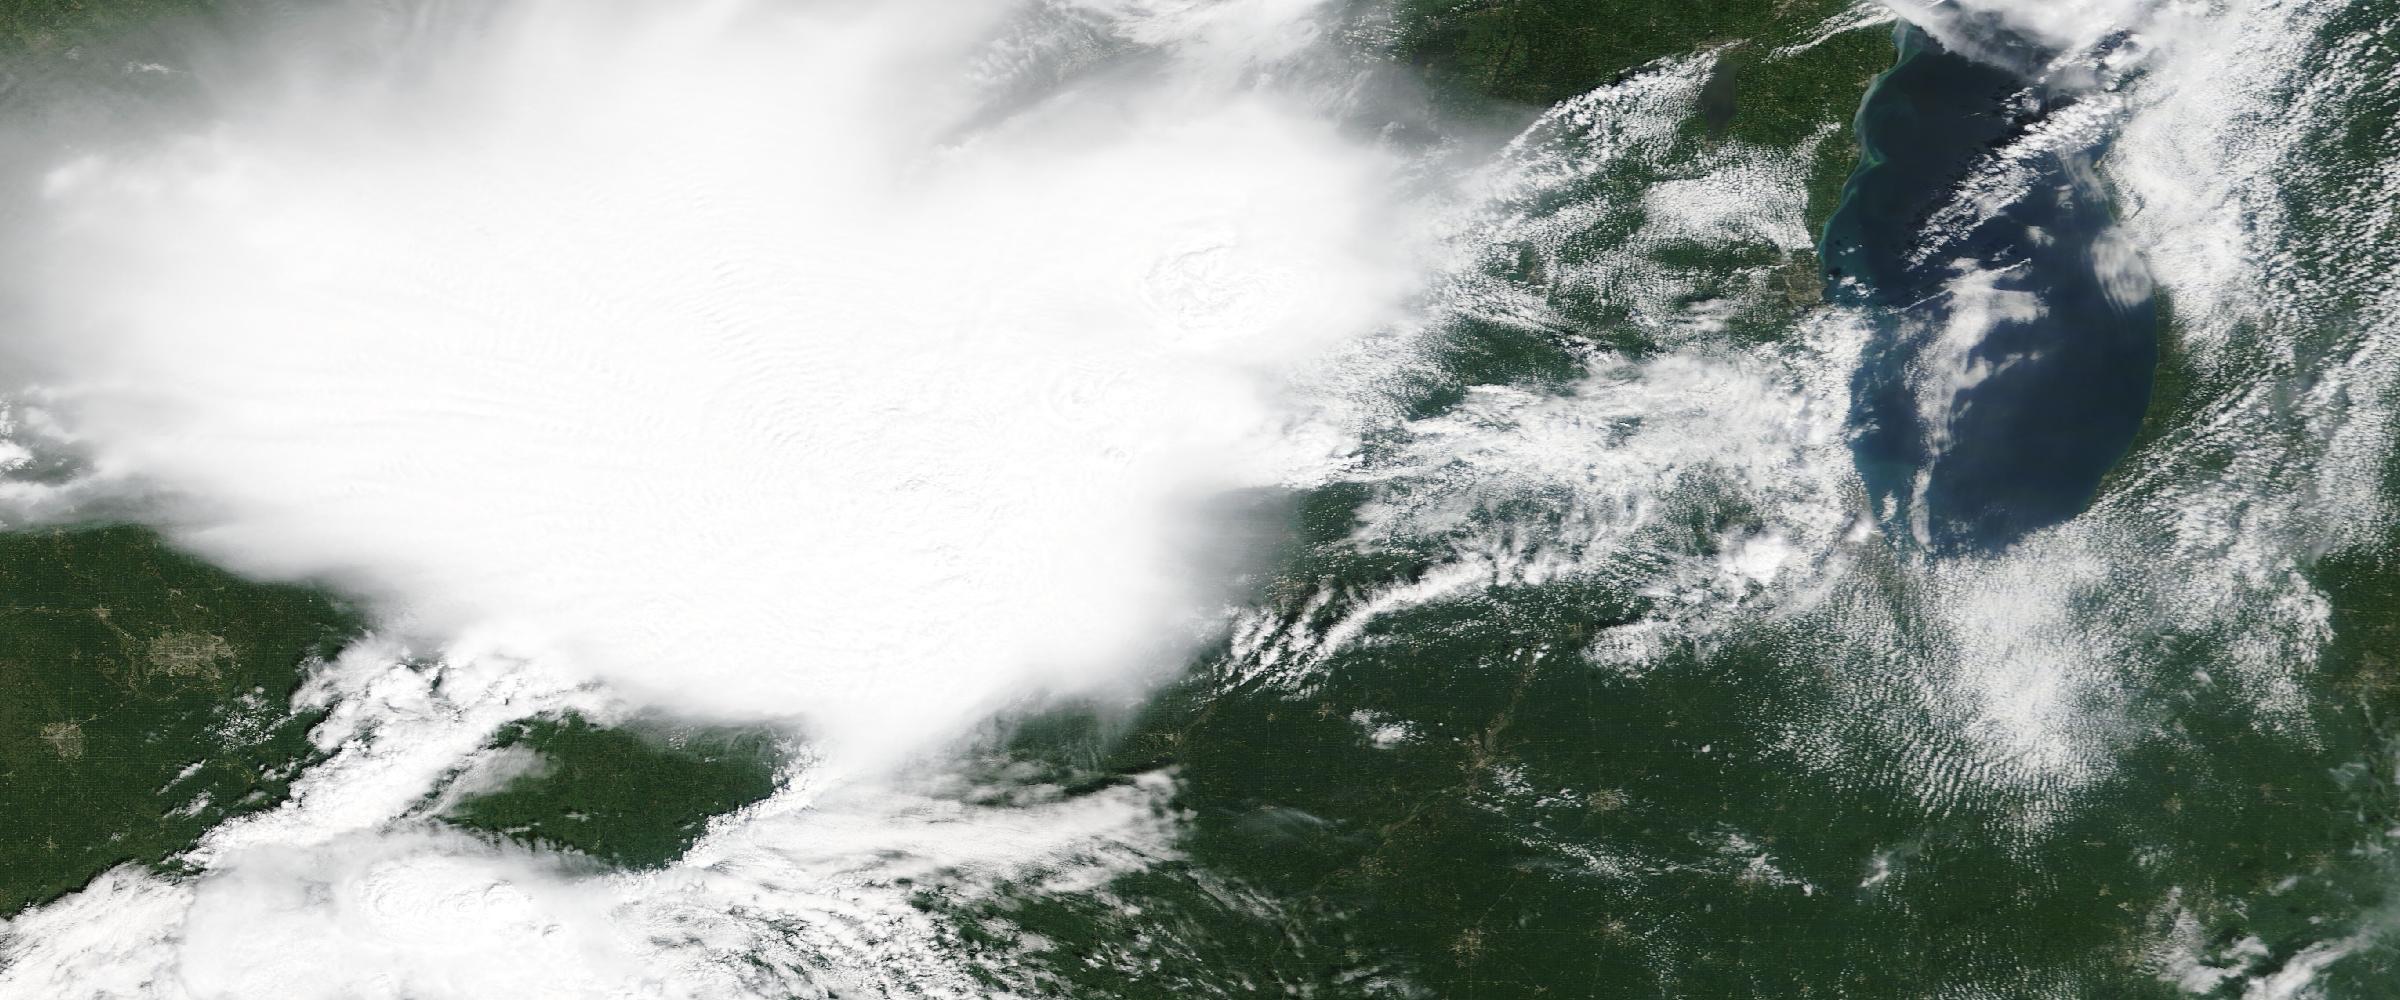
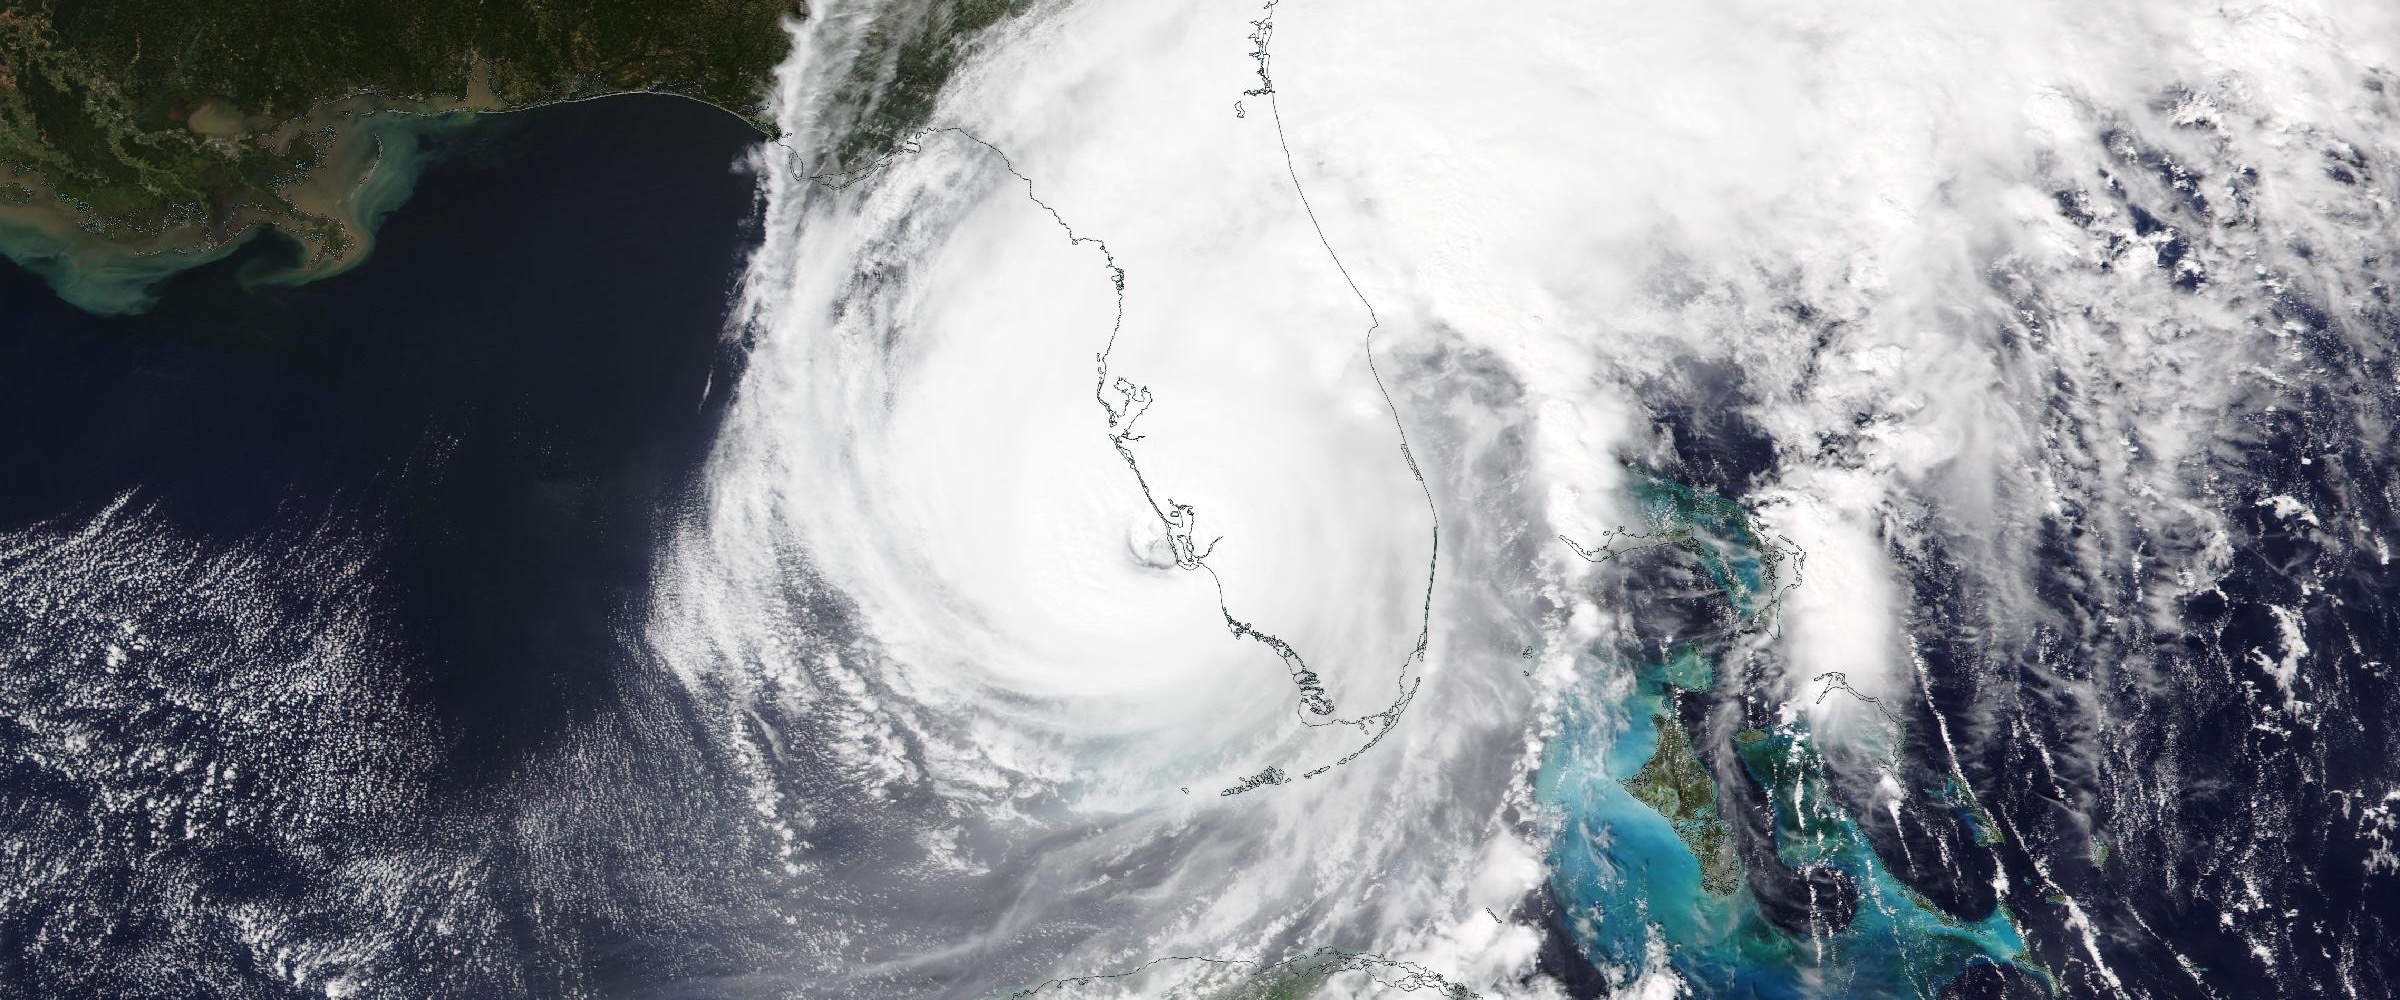
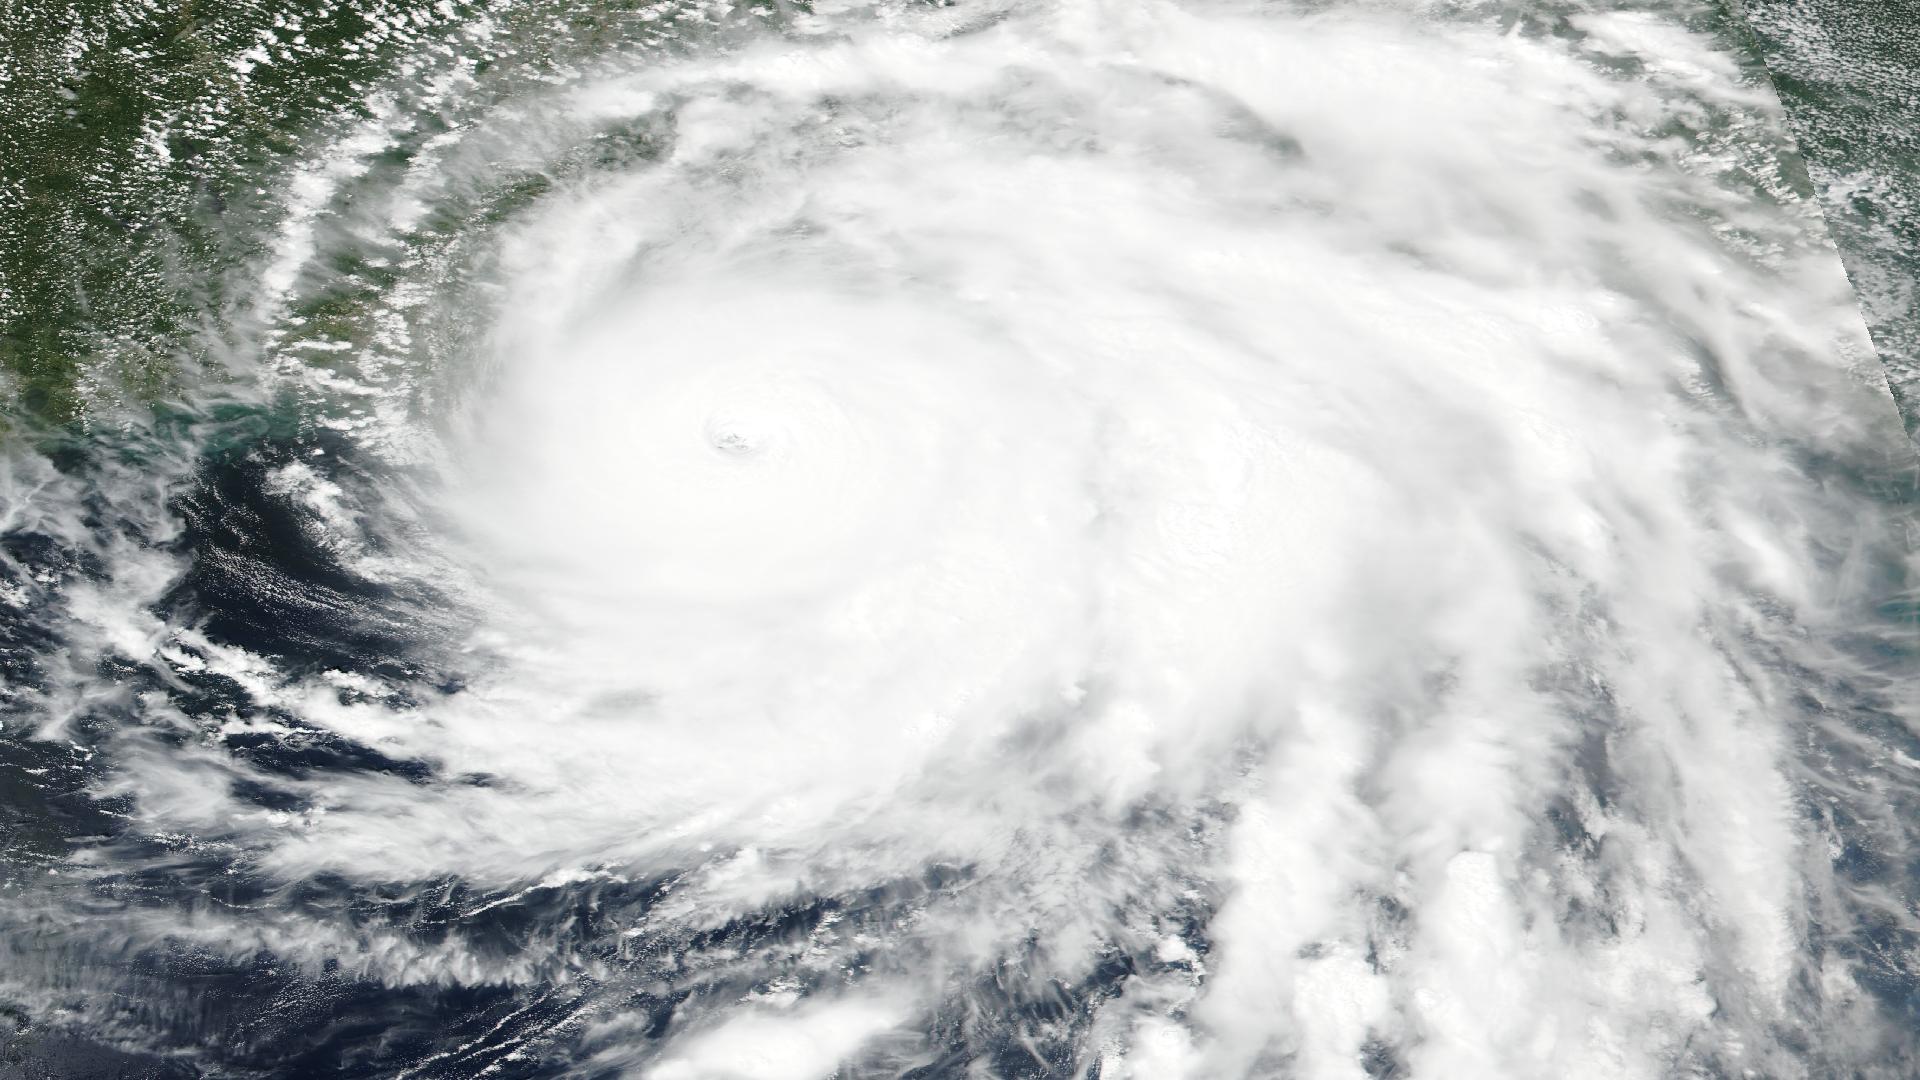
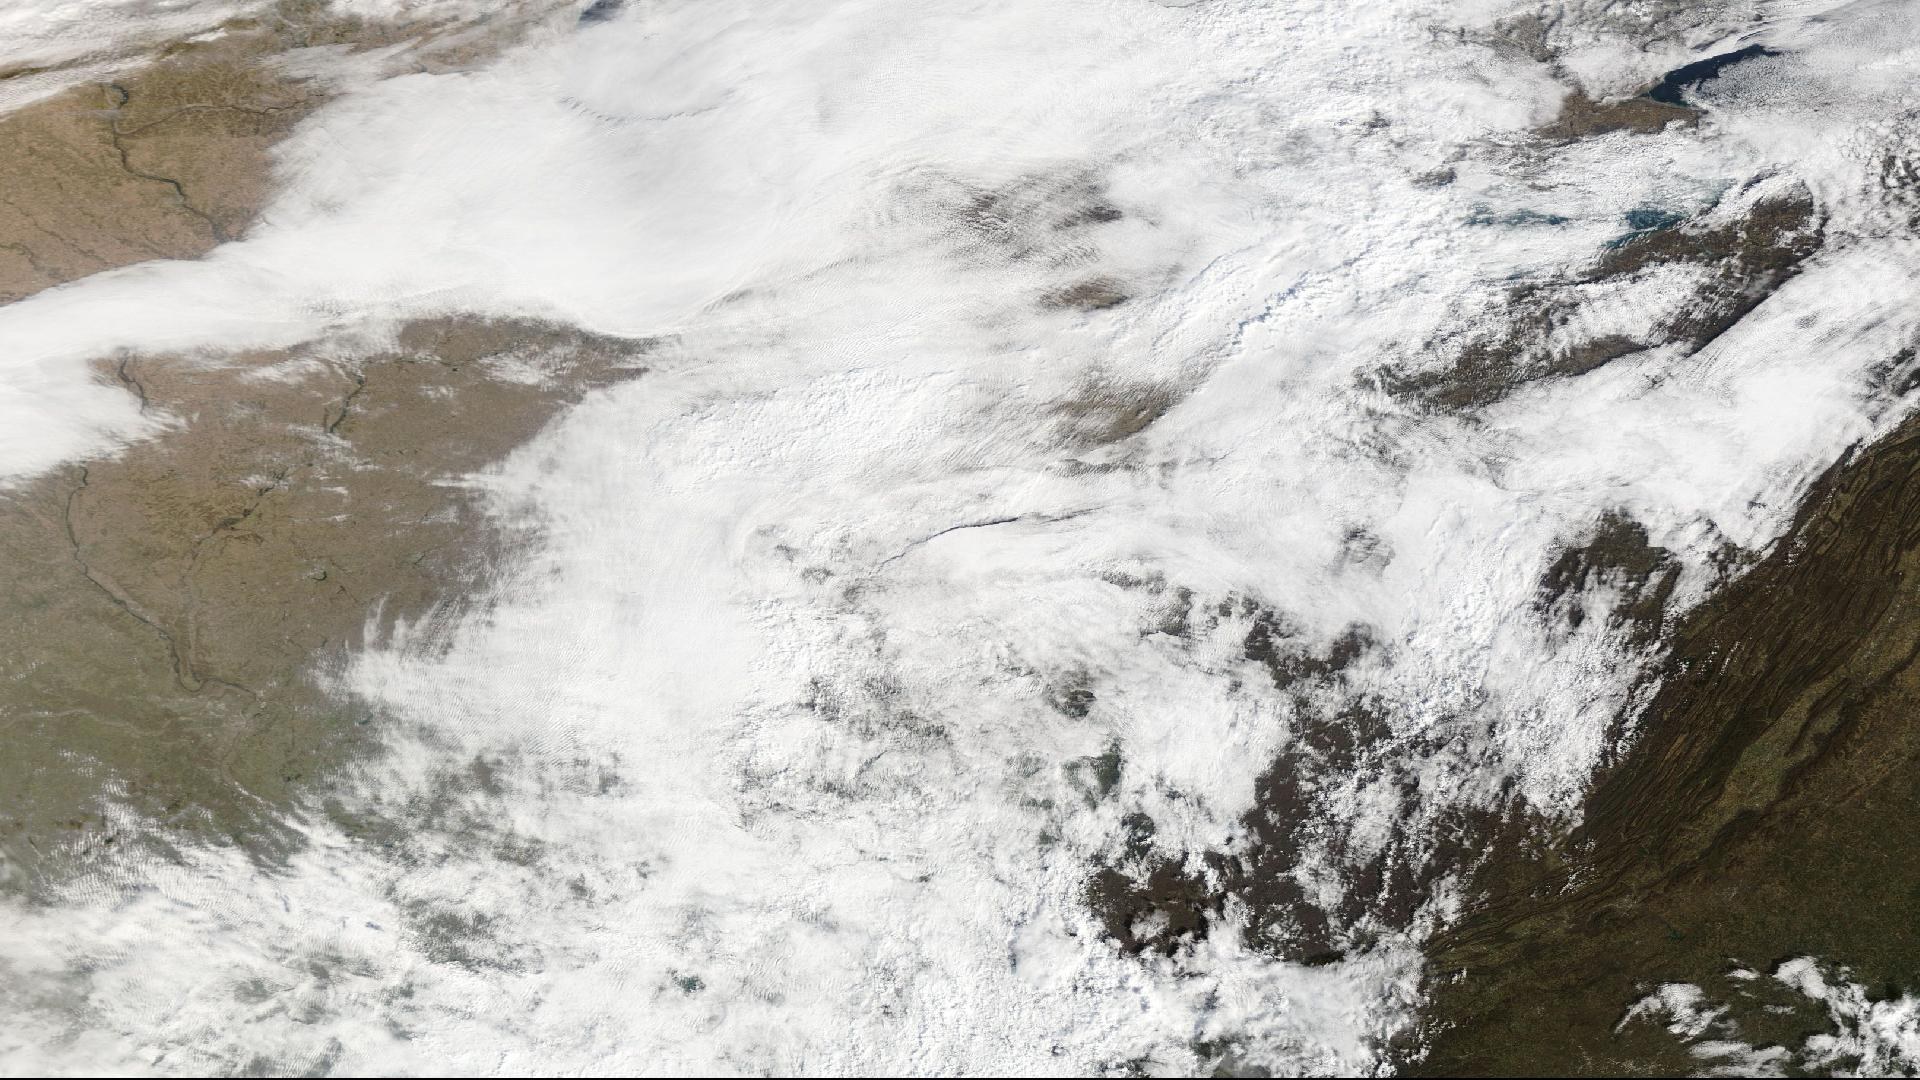
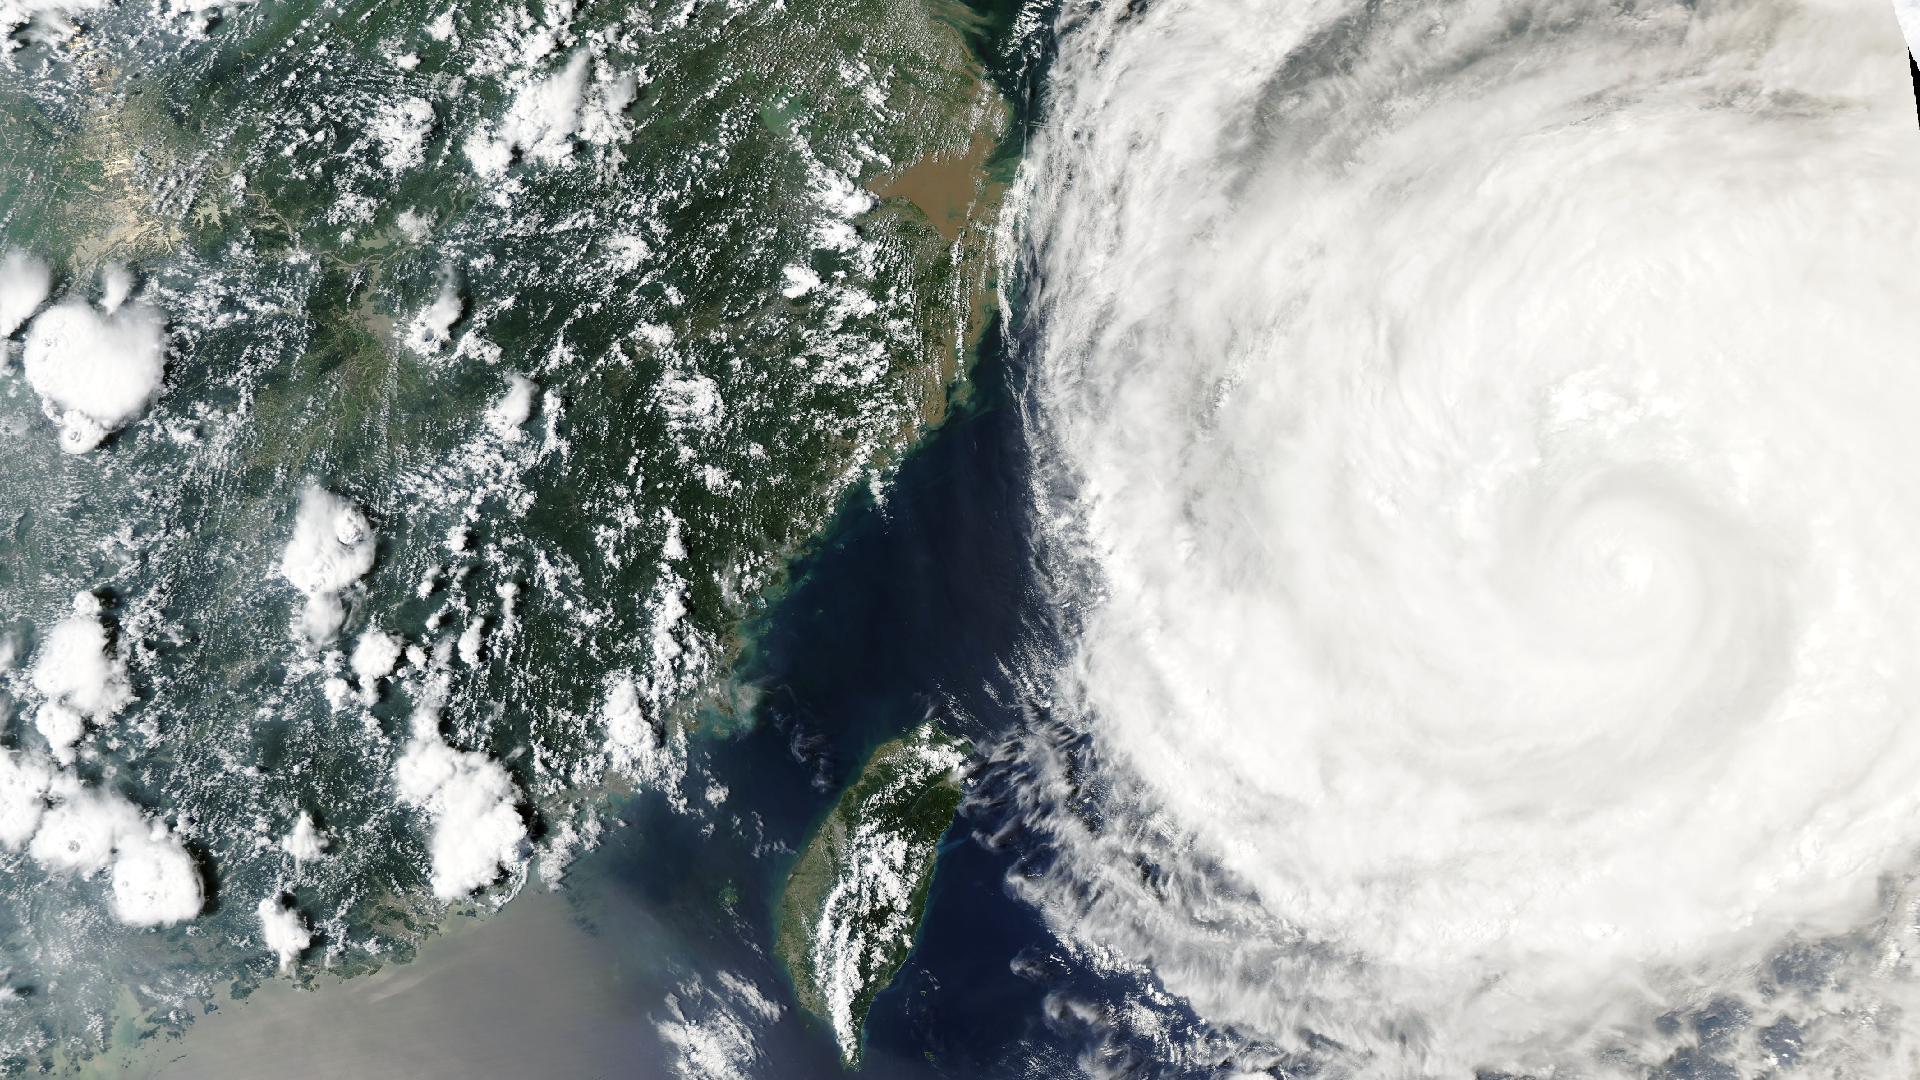
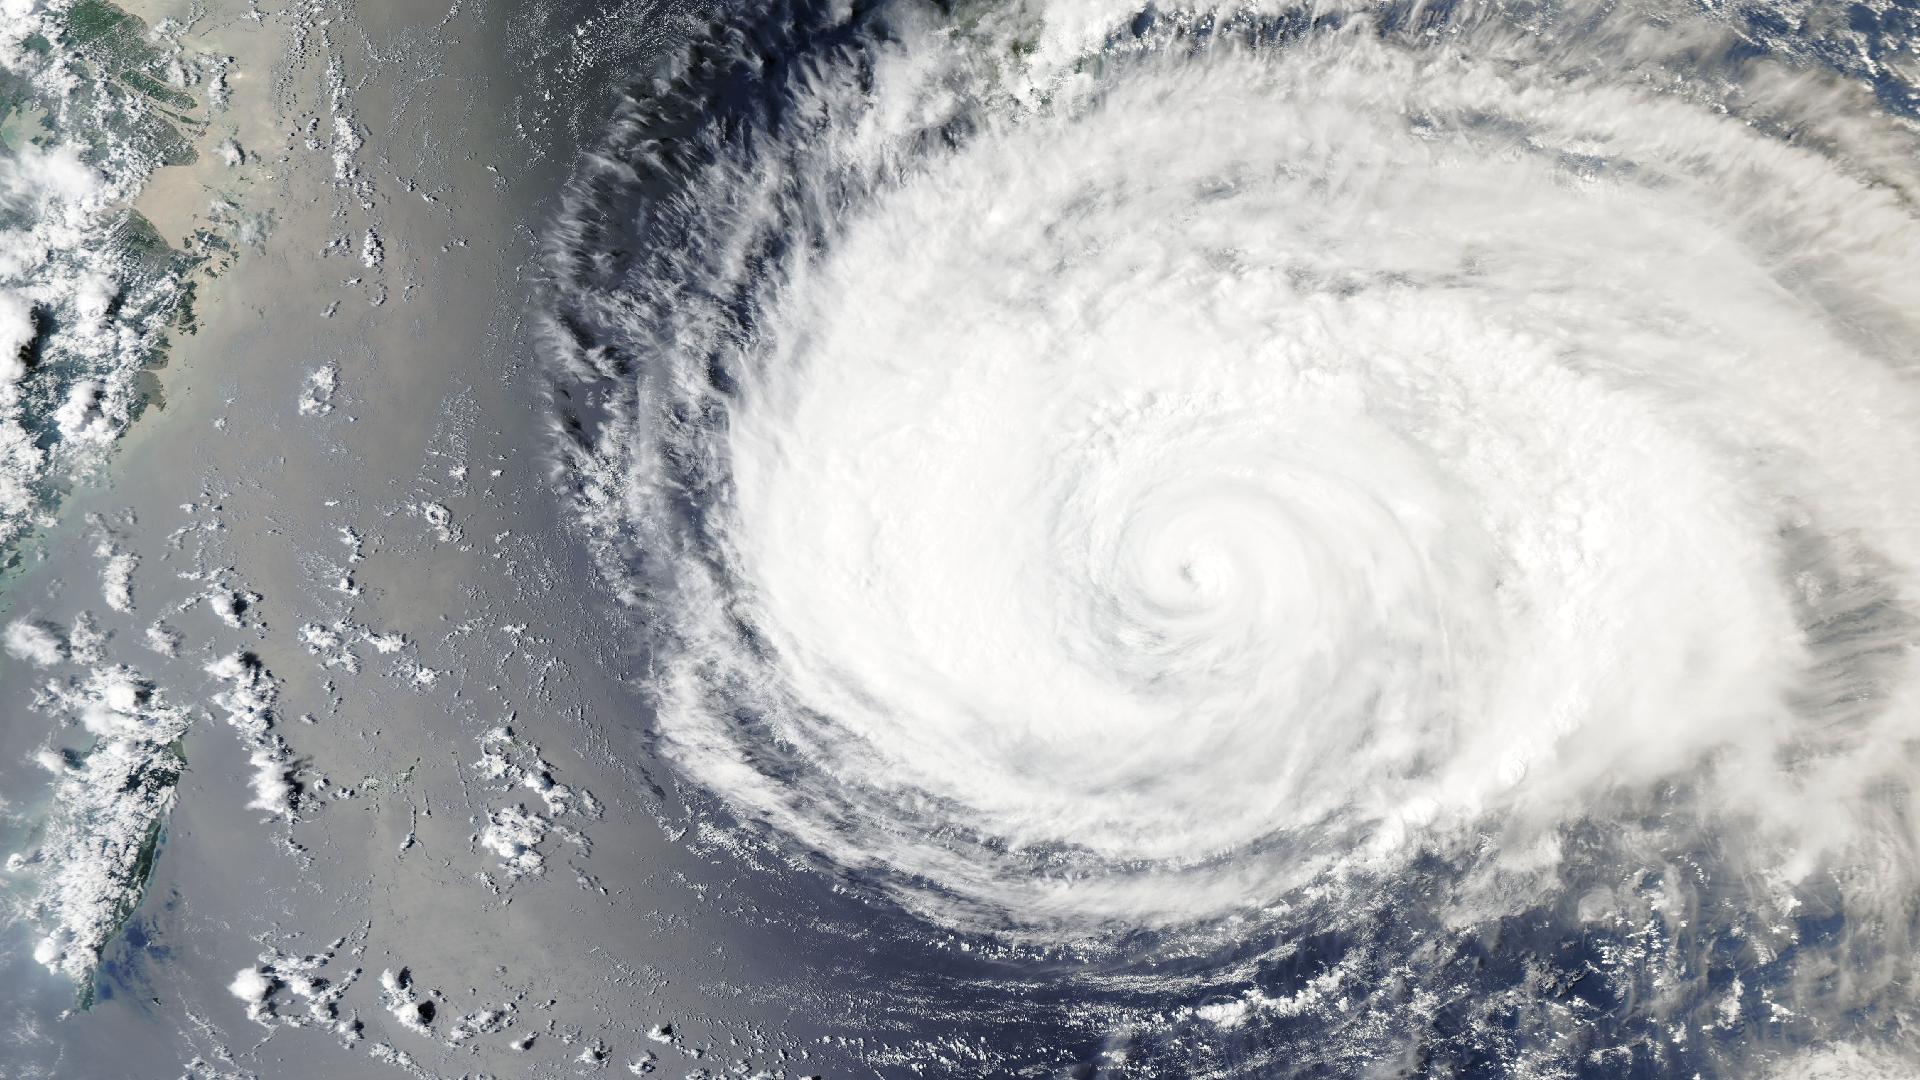
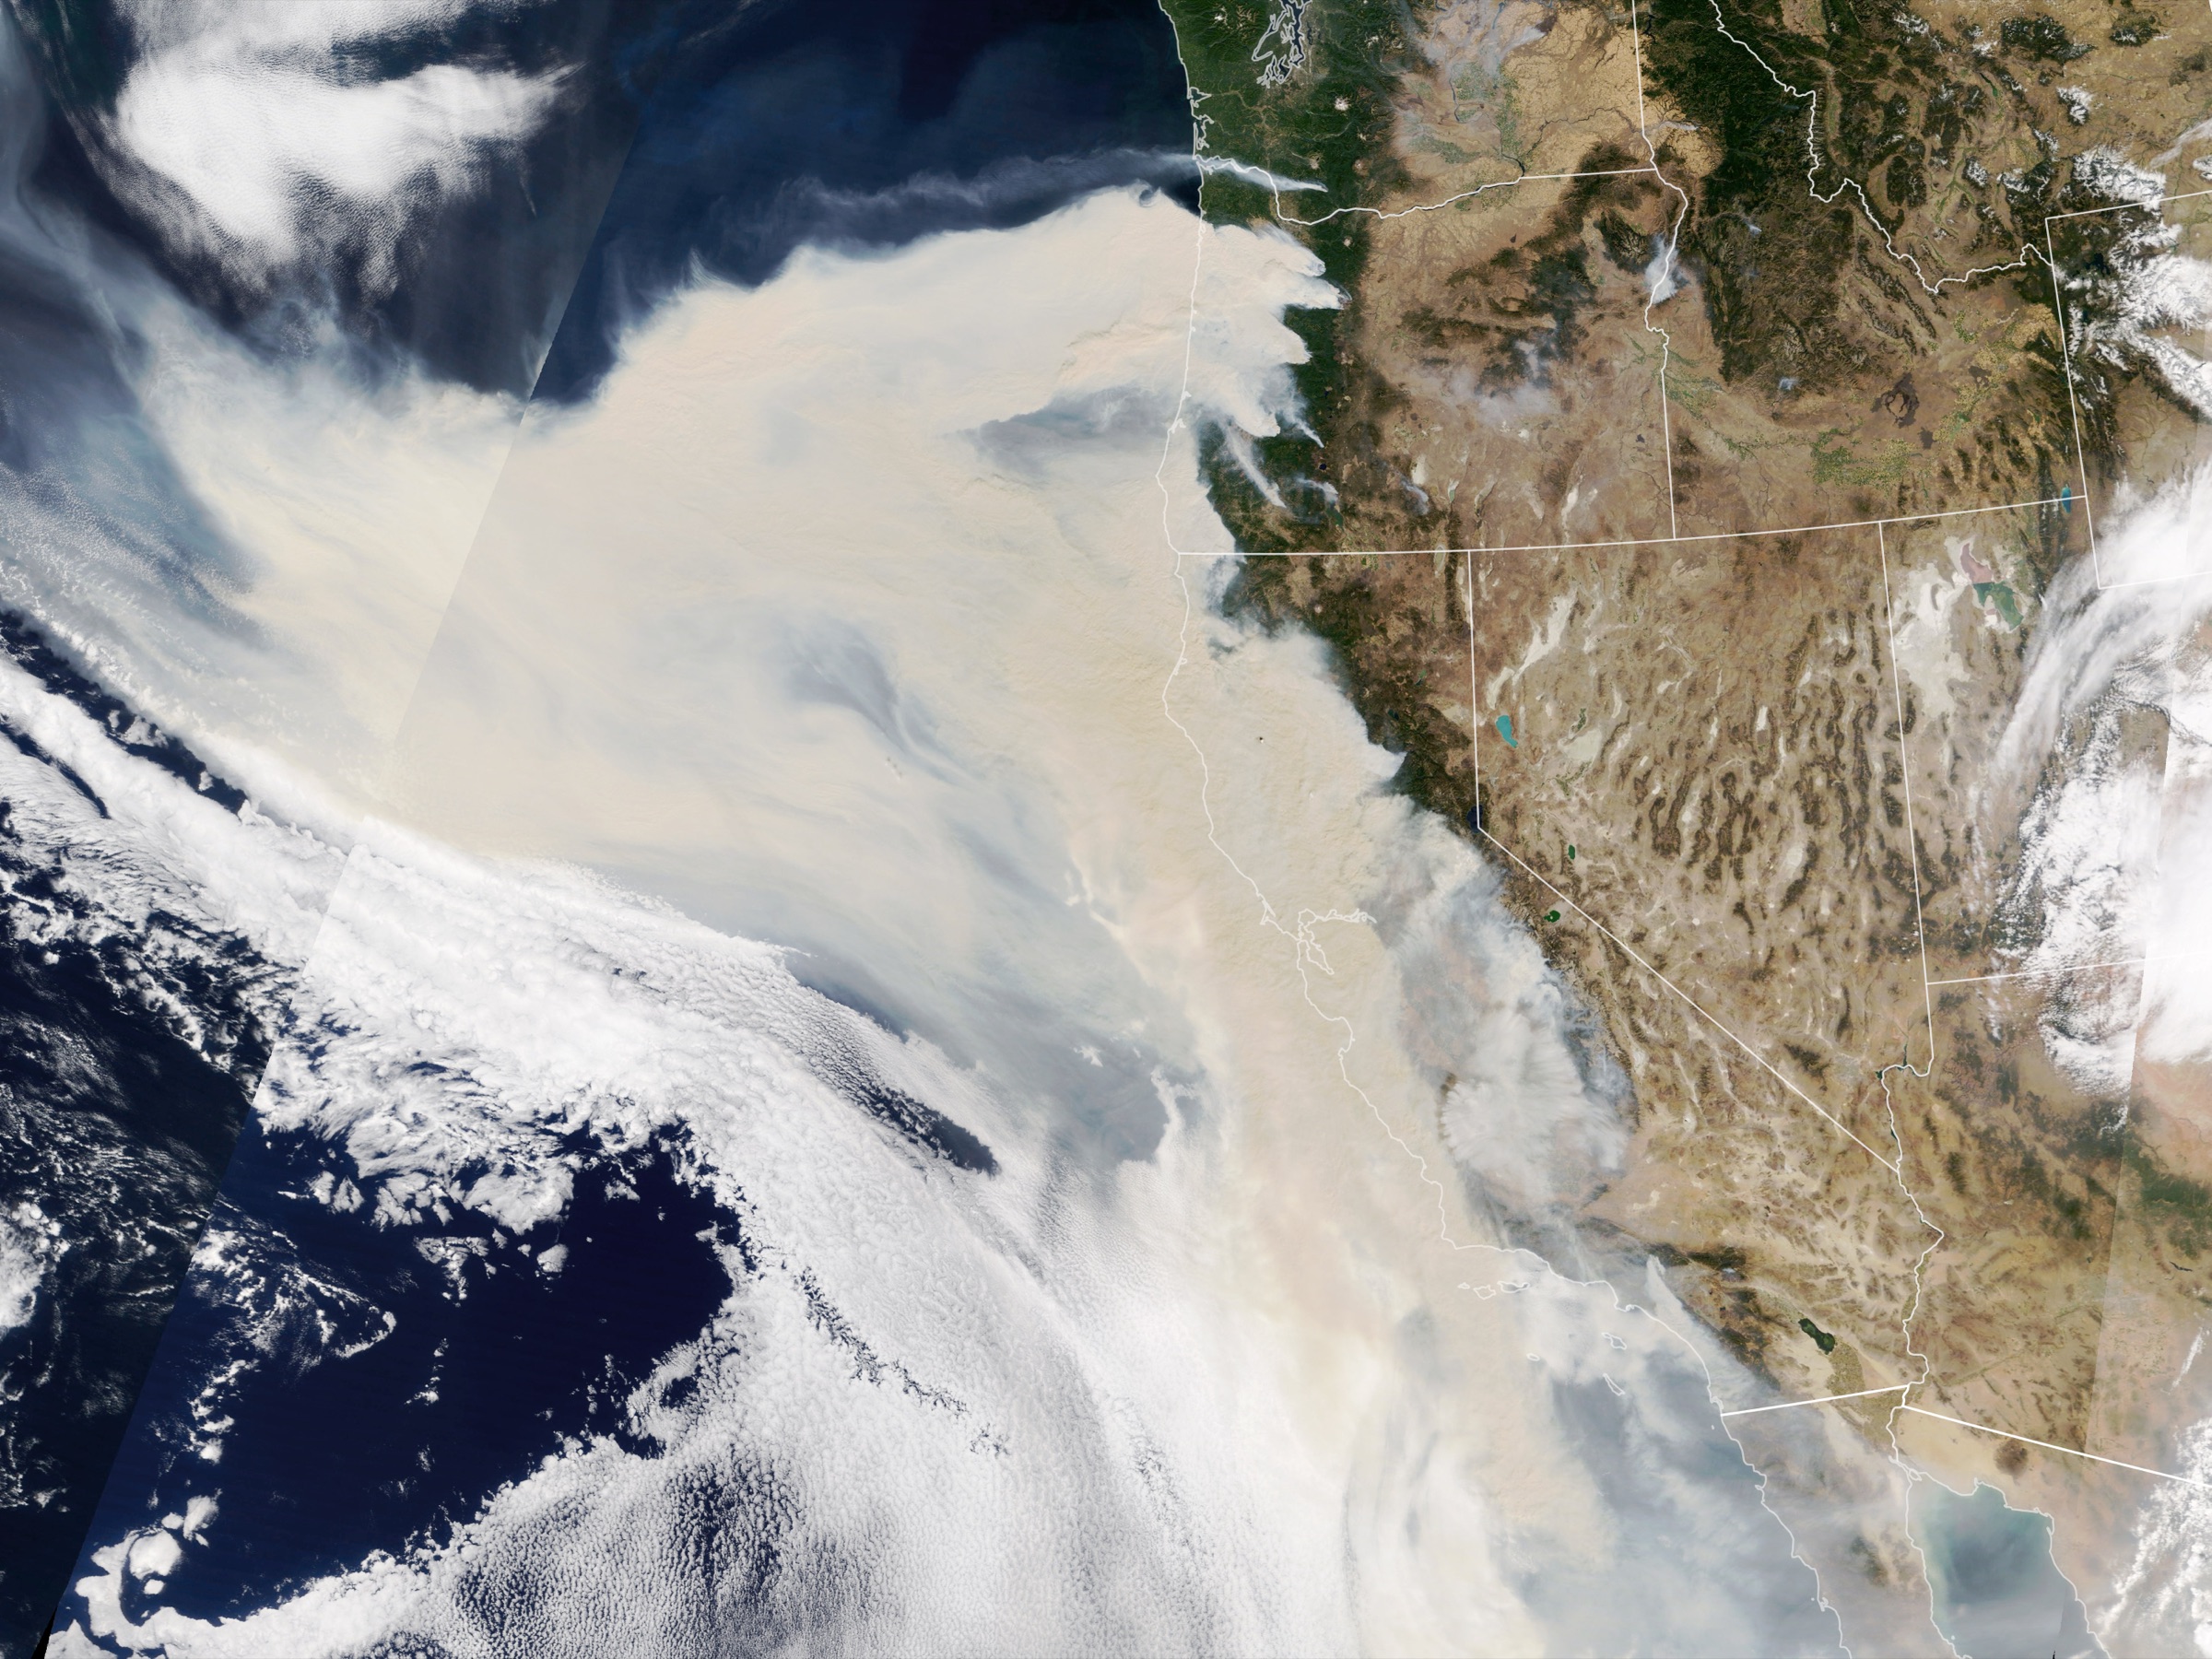
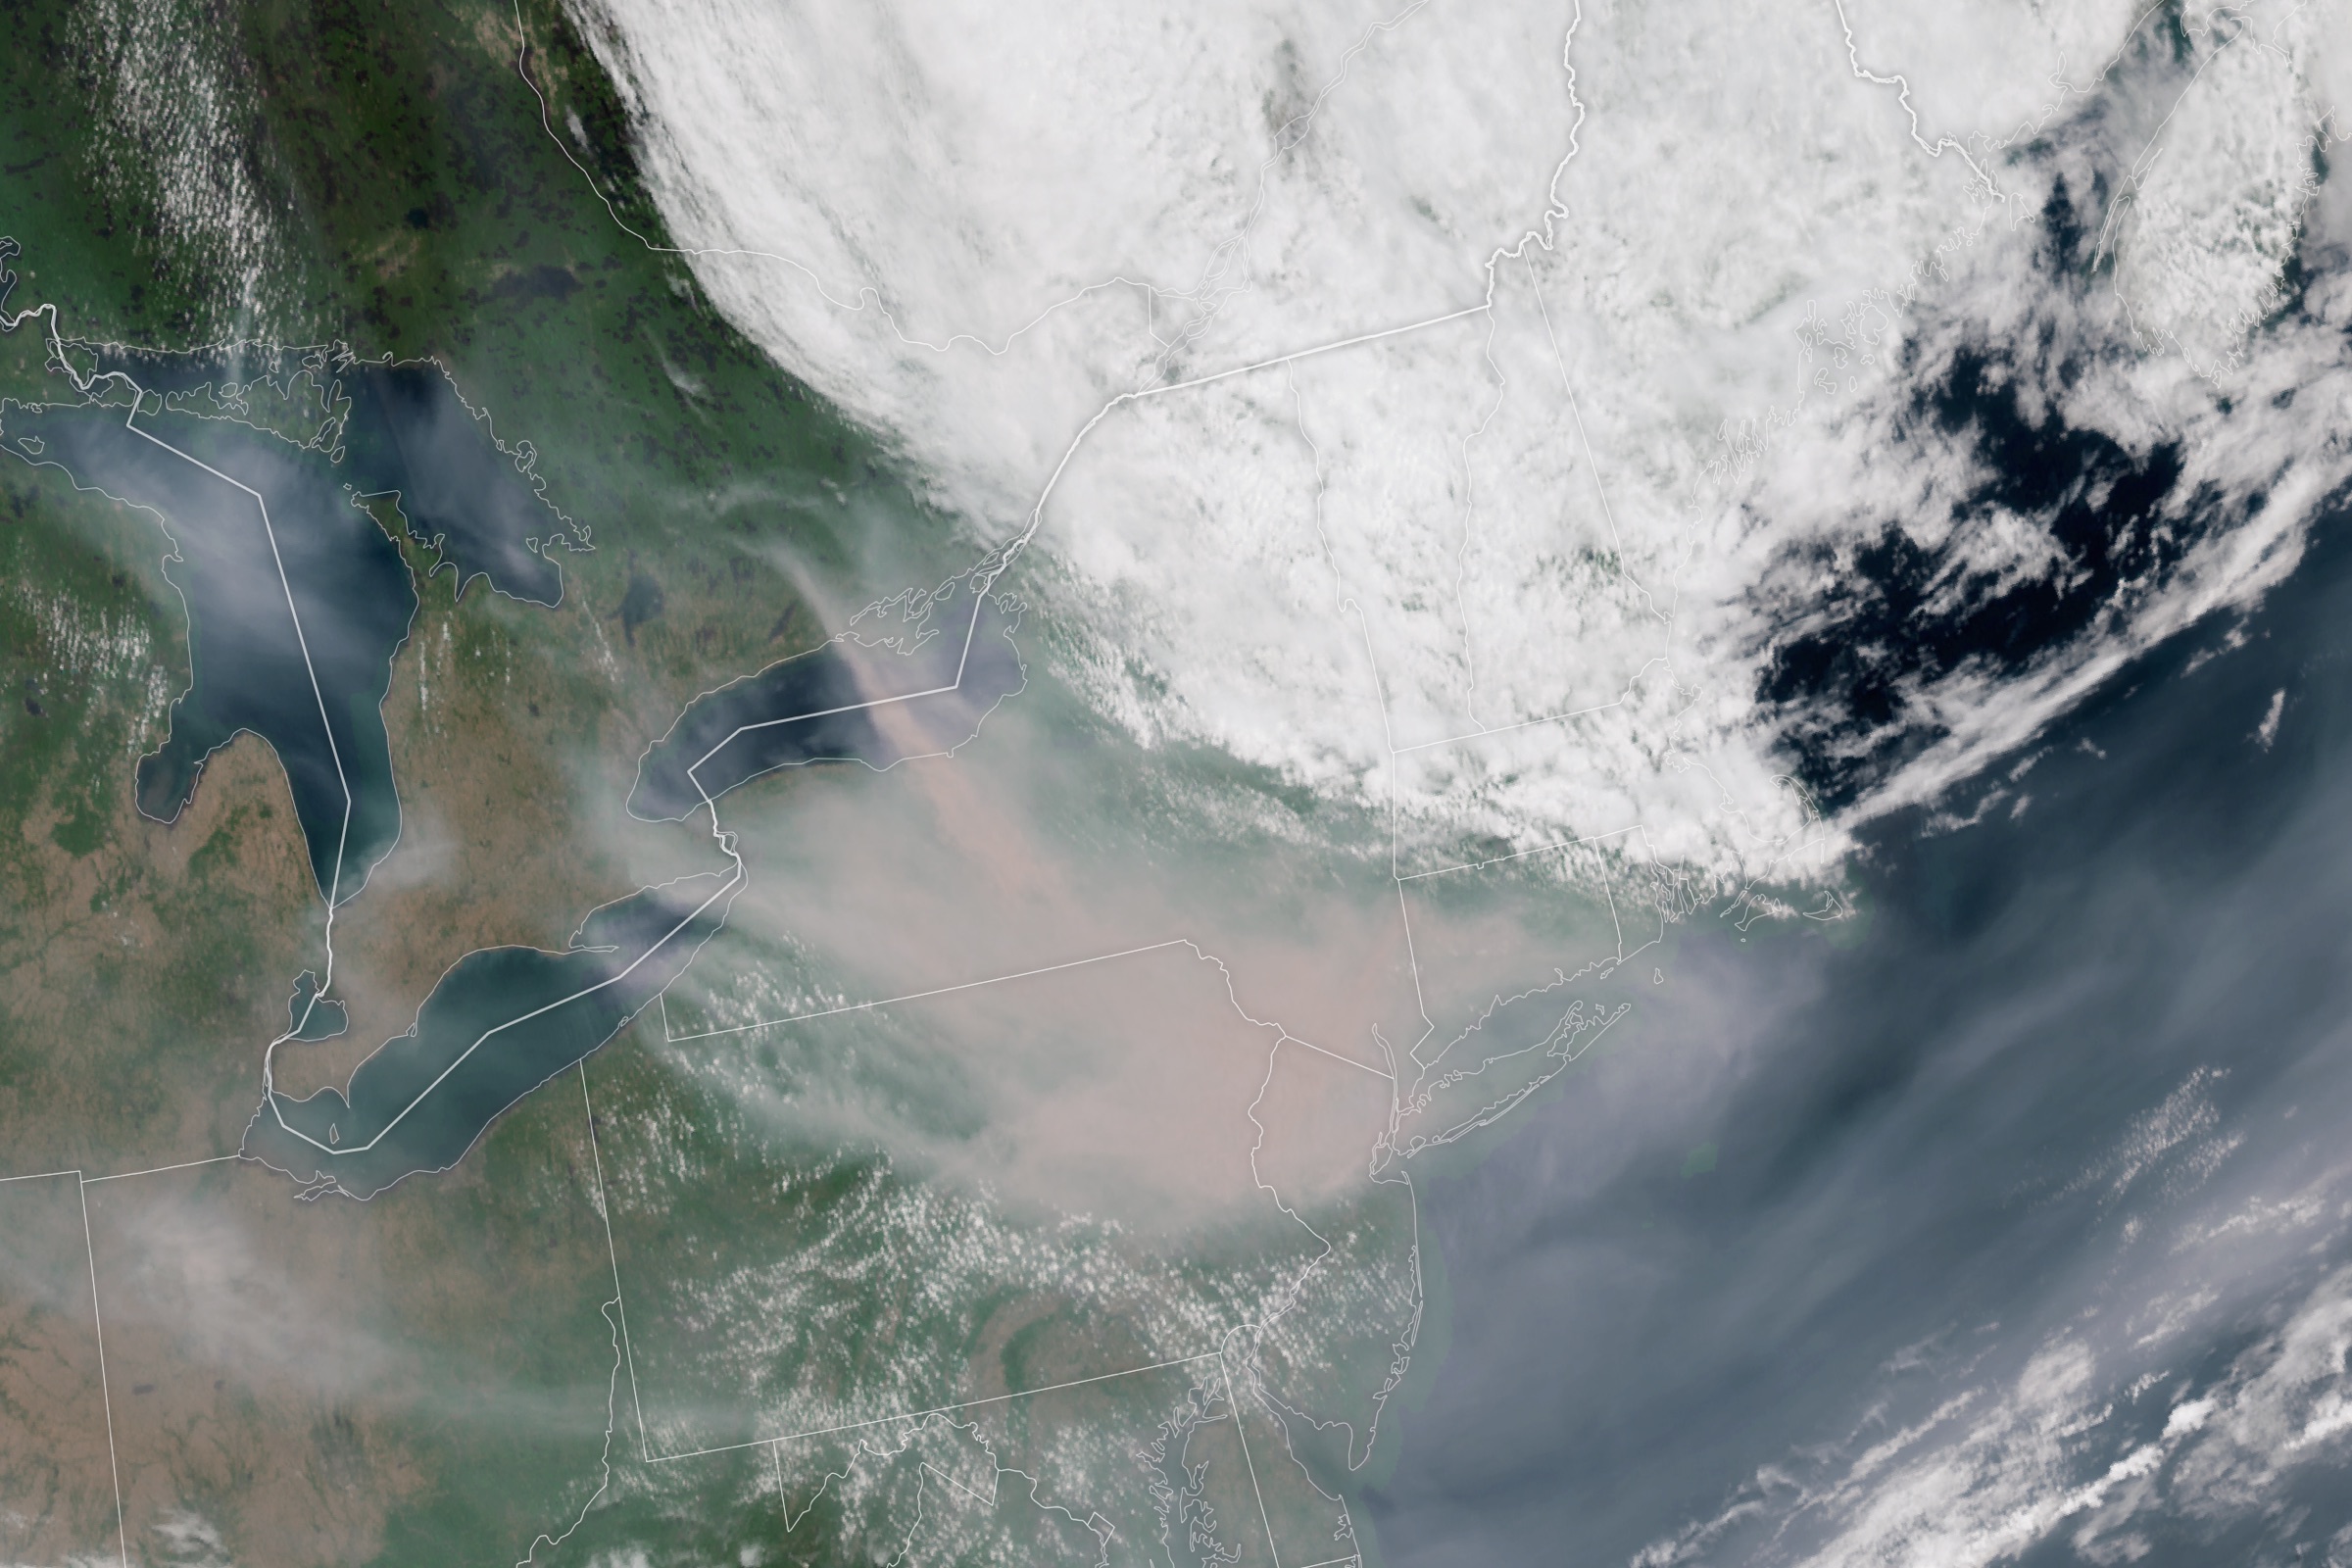
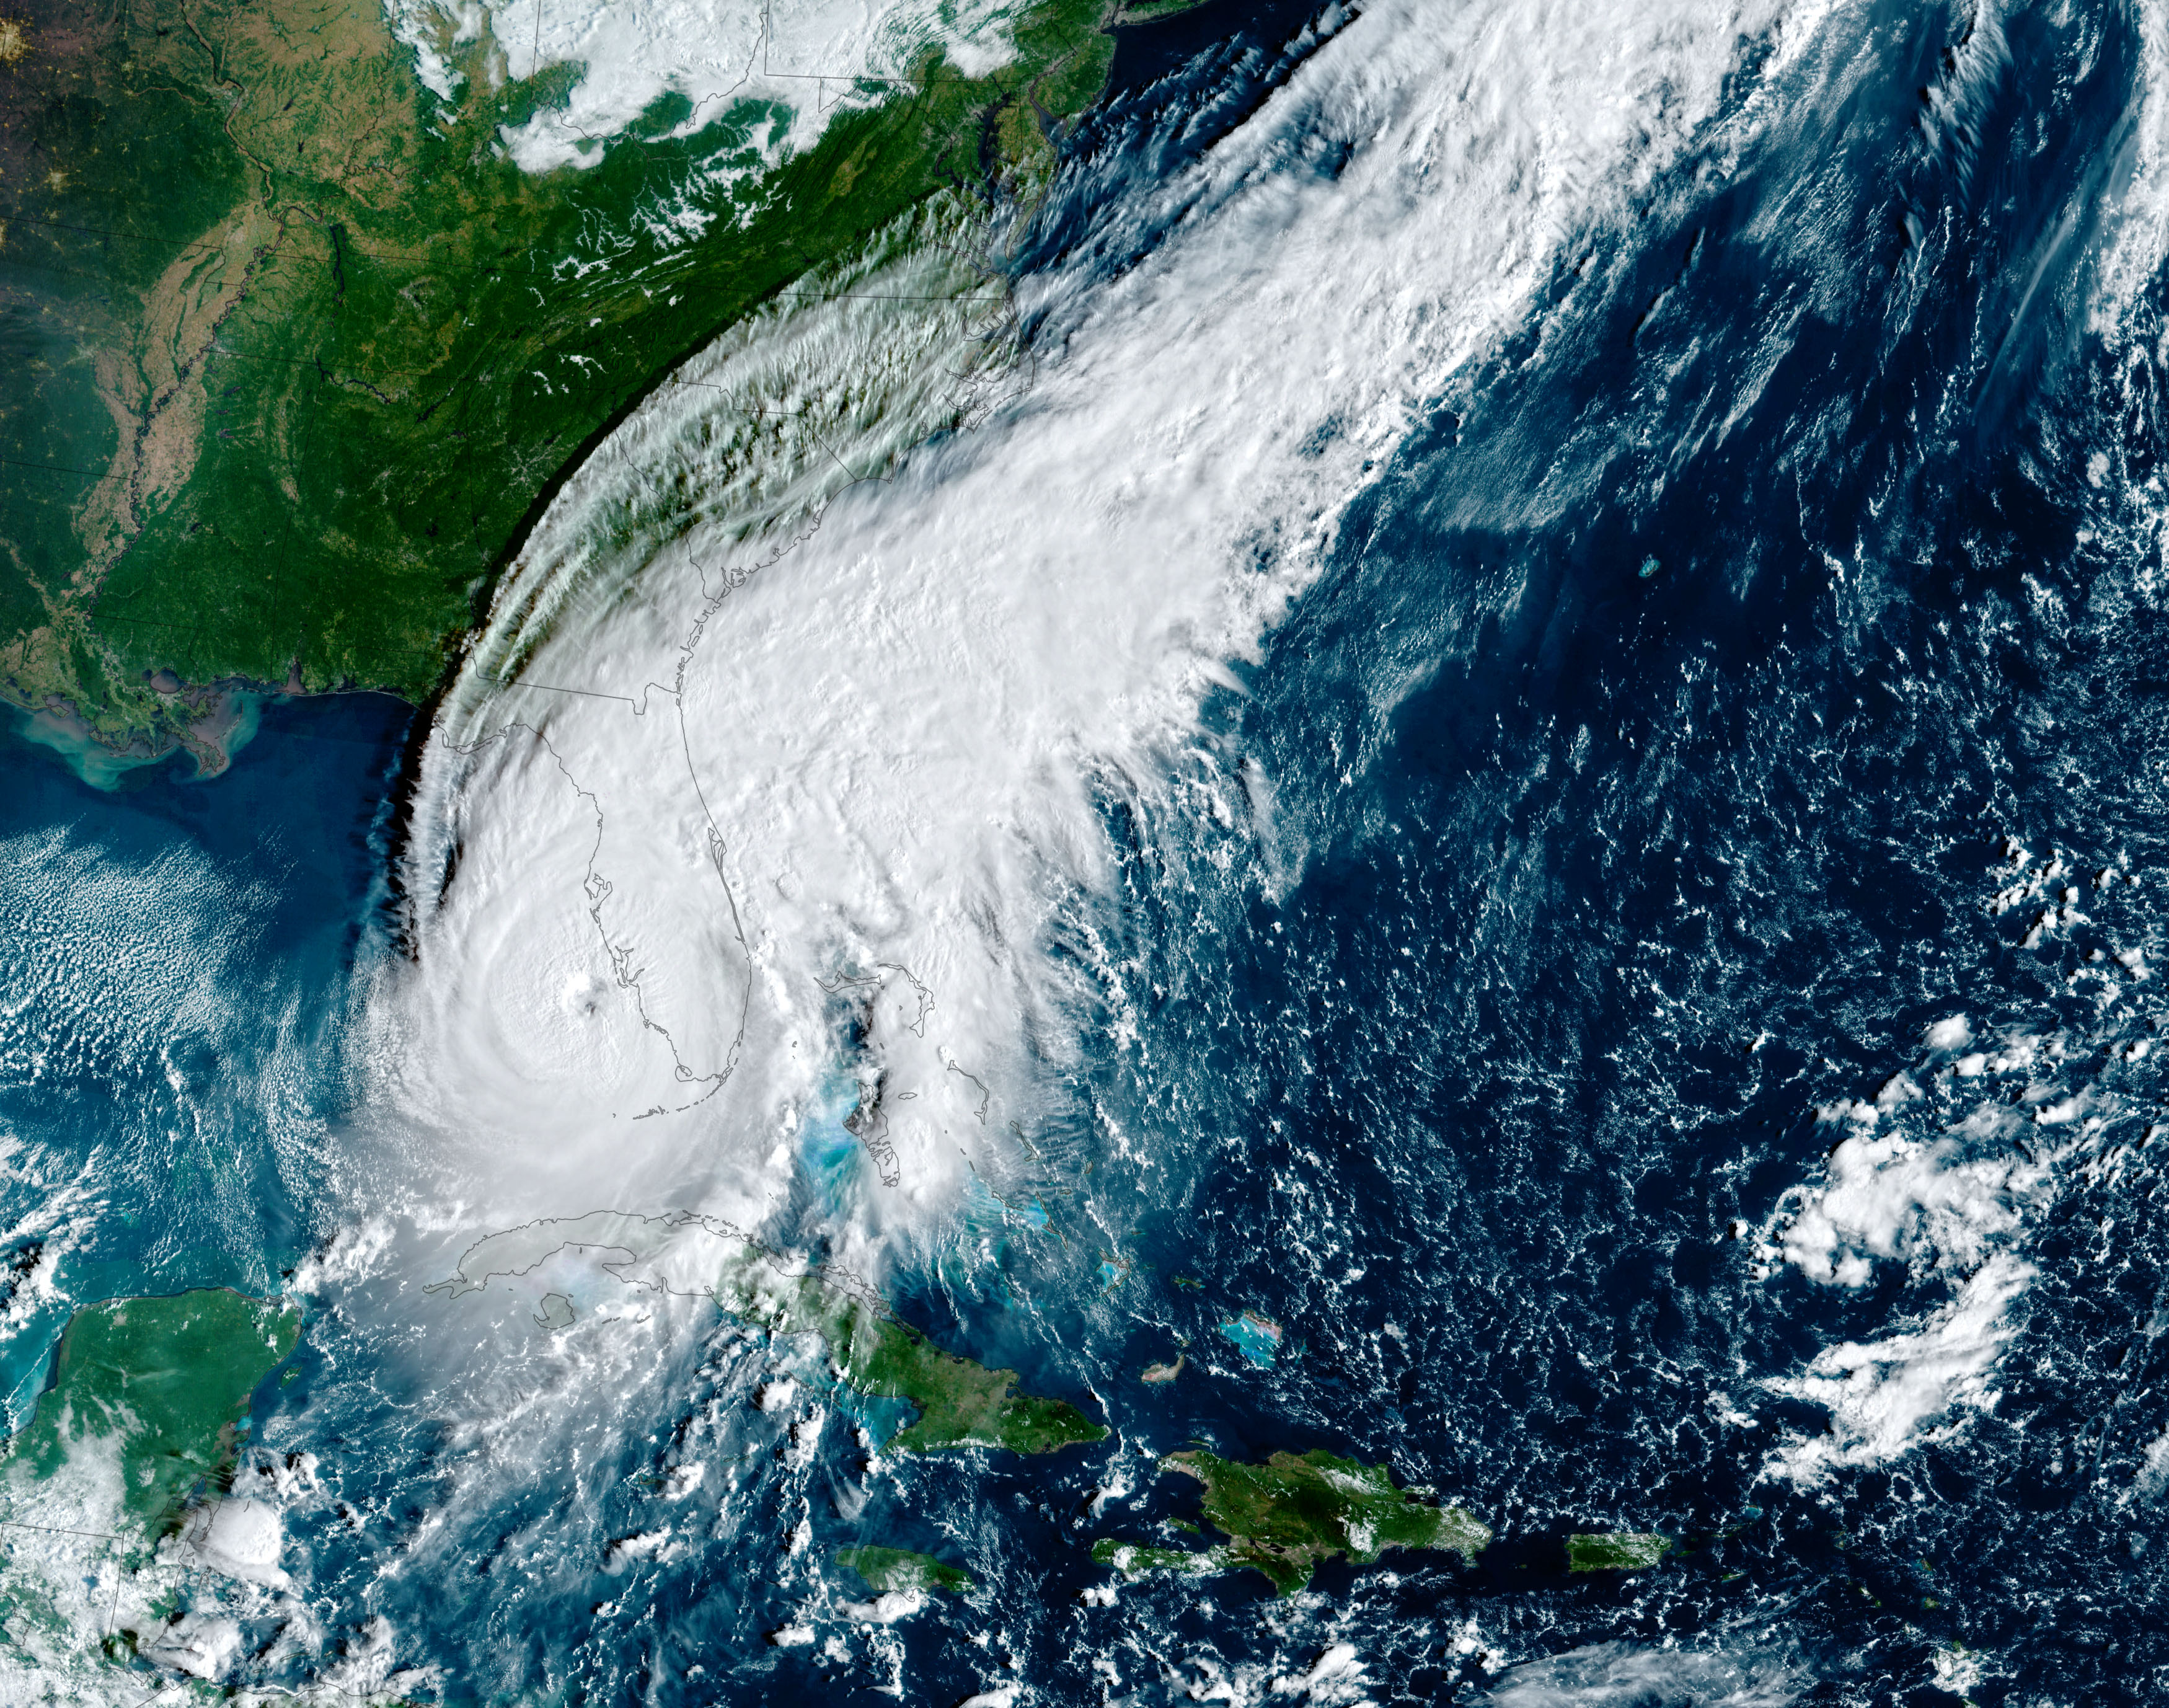
Sources: NOAA CO-OPS 6-minute water levels and flood thresholds; NWS coastal flood, wind and flood products via the Iowa Environmental Mesonet VTEC archive; NWS Local Storm Reports; NWS Public Information Statements (Wakefield VA, Mount Holly NJ, Upton NY, Albany NY, Boston/Norton MA, Gray ME); NOAA Office for Coastal Management inundation data. Banner: NASA Worldview, NOAA-20 VIIRS true color, September 26, 2026. Analysis and map by DisasterAWARE.












-min.png)
.png)

.png)



Decision-ready intelligence for understanding what's happening, what is impacted, and what to do next. Global hazard, severe weather, catastrophe, and physical risk intelligence trusted by governments, enterprises, insurers, humanitarian organizations, and technology platforms worldwide.
Request DemoContact Us

