


DisasterAWARE's V2 API now serves live hail and severe wind hazards on two new endpoints, /hail and /wind. Each hazard is one record that carries the National Weather Service warning and every version of it, the radar hail swath growing by size band, the spotter and measured reports as they arrive, and an assessment that says plainly what the evidence was: a warning tag alone, a radar signature, or hail on the ground.
A severe thunderstorm is three things to the people who have to act on it: a warning that says what might happen, radar that shows where it is happening, and reports that confirm what did happen. Until now those lived in three feeds with three clocks. The new endpoints join them into a single hazard that changes as the storm does and closes into a record you can query the next day.
Hail hazards are DisasterAWARE hazards of type STORM with a sub-type of HAIL; severe wind hazards carry the sub-type WIND. Each is built from the NWS severe thunderstorm warnings carrying a hail tag (or a wind tag or damage threat), the MRMS radar hail swaths, and the ground reports that belong to the same storm. A hazard passes through three stages, and the record shows which one it is in.
Every record has the standard V2 hazard fields, with type STORM, severity WARNING and category EVENT. Two GeoJSON collections carry the geometry. alertGeometry holds one Feature per linked NWS warning at that warning's current polygon. exposureAreas holds where the hazard was actually observed, each Feature labelled with an exposure level: for hail, levels 1 to 6 are the cumulative radar swaths for 1, 1.25, 1.5, 1.75, 2 and 2.5 inches, and for wind a single level 1 is the footprint of the damage reports and gusts of 58 mph or more. A warning-only hazard has nothing observed yet, and its exposureAreas is an empty object rather than null.
Each hail record then carries two blocks:
hailAssessment, the summary: the largest warning hail tag, the largest reported and largest measured hail, the largest swath threshold the radar reached and the radar peak, a best estimate with its source (report or radar, whichever is larger), how long radar saw hail, the counts of reports and of measured reports, the exposure-level scale, why the hazard ended, which sources were consulted and what each observed, and the hail basis: report when at least one ground report exists, radar for a radar signature of 1 inch or more, warning when only a tagged warning exists, and radar_brief for a radar-only signature that lasted under 10 minutes, published but labelled as unconfirmed.hailDetails, the evidence: the swath outline and area per size threshold, the radar timeline frame by frame, the swath growth at 10-minute steps showing when each threshold first appeared, every hail report, and every linked warning with its VTEC code, tags, damage threat, current polygon and every version.Wind records mirror that with windAssessment and windDetails: the largest warning wind tag, the highest NWS damage threat across the linked warnings (base, considerable or destructive, and null when no warning carries a tag, which is not the same as no threat), the strongest measured gust and the strongest gust of any kind, counts of damage, gust and measured reports, the report timeline, and the wind basis: gust_measured for a measured gust of 58 mph or more, damage_reported for damage reports or an estimated gust at that threshold, and forecast_only for a warning with no observed evidence yet.
While a hazard is active its end time is a projection and the record says so. When it ends, the end time becomes the last part's end and end_basis says why: the warnings expired, radar went quiet for 30 minutes, reports went quiet, or the hazard was merged into another, in which case the record names the survivor.
Both endpoints serve a file rather than a query result. A call with no parameters returns a redirect to the current gzipped NDJSON file with every active hazard, one per line. With parameters, the redirect points at a filtered file and an X-Match-Count header says how many hazards it holds. Every redirect carries the time the file was last written, so a client can pass that back as updated_since and receive only what changed. The file is rewritten when something changes, at most every two minutes, and if the feed's heartbeat is more than 15 minutes old the endpoint returns a 503 rather than serving stale data.
Filters combine with AND, lists mean "any of", and a misspelled parameter or an unknown value returns a 400 that names the problem rather than an empty file. The common filters are the ones you know from the active hazards endpoint: uuid, type, severity, category, country, state, name, time bounds on started_at, created_at and updated_at (on or after) and ended_at (on or before), and a latitude/longitude range. On top of those:
# hail confirmed on the ground in Arizona or New Mexico
GET /hail?hail_basis=report&state=AZ,NM

# any hazard whose best estimate is 1.5 inches or more, changed since your last poll
GET /hail?min_hail_in=1.5&updated_since=2026-10-21T22:00:00Z

# wind hazards with observed evidence under a considerable or destructive damage threat
GET /wind?wind_basis=gust_measured,damage_reported&damage_threat=considerable,destructive

# measured gusts of 70 mph or more
GET /wind?min_gust_mph=70
min_reported_hail_in filters on ground reports alone, ignoring radar. scope=active is the only scope today; the historical scope, which will serve the finalised records, returns a 501 that names the scopes available until it ships.
Get live hail and wind hazards into your systems
The /hail and /wind endpoints deliver each hazard with its warnings, radar swaths, ground reports and an evidence-labelled assessment, refreshed as the storm evolves.
Take one convective day, 21 October 2026, across the Southwest. Between noon UTC that day and noon the next, the feeds carried 75 hail hazards and 20 severe wind hazards across Arizona, California, Maine, Nevada, New Mexico and Utah: 90 NWS warnings in 245 versions, 529 radar frames, 140 swath polygons covering about 3,450 km² of hail of 1 inch or more, 35 hail reports of which 19 were measured, and 9 wind reports. Of the hail hazards, 9 rested on ground reports, 21 on a persistent radar signature, 10 on a brief one, and 35 on a warning tag alone, which is the honest shape of a hail day: most warnings never get a confirmed stone.
The richest record was the Phoenix storm. It opened at 22:04 UTC on a Phoenix-office warning, and over the next 3 hours 39 minutes six warnings from the Phoenix and Flagstaff offices, in 19 versions, followed it north-east past Payson. Radar first saw 1-inch hail at 22:18 UTC; the first ground report followed within seven minutes. By the time the last warning expired at 01:43 UTC the record held 68 radar frames, a swath of 628 km² at 1 inch narrowing to 5 km² at 2.5 inches, and 18 reports, nine of them measured. The assessment reads like this: largest warning tag 2.75 inches, radar peak 2.98 inches, largest reported 2 inches, largest measured 1.5 inches, best estimate 2.98 inches from radar, basis report, ended because the warning expired.

The Phoenix hail hazard three minutes before its last warning expired: the radar swath by size band, every hail report (dark rings are measured), and the last warning polygon still in force. Rendered from the record's own geometry.
The wind side of the same day looked different, as it usually does. Of the 20 wind hazards, 11 rested on a warning alone, 6 on damage reports and 3 on a measured gust. The strongest gust was 72 mph, measured. The record below, near Safford in Graham County, shows what a wind hazard carries: a Tucson-office warning tagged for 70 mph winds with a destructive damage threat, a measured 61 mph gust inside it, and the small level-1 footprint of that evidence.
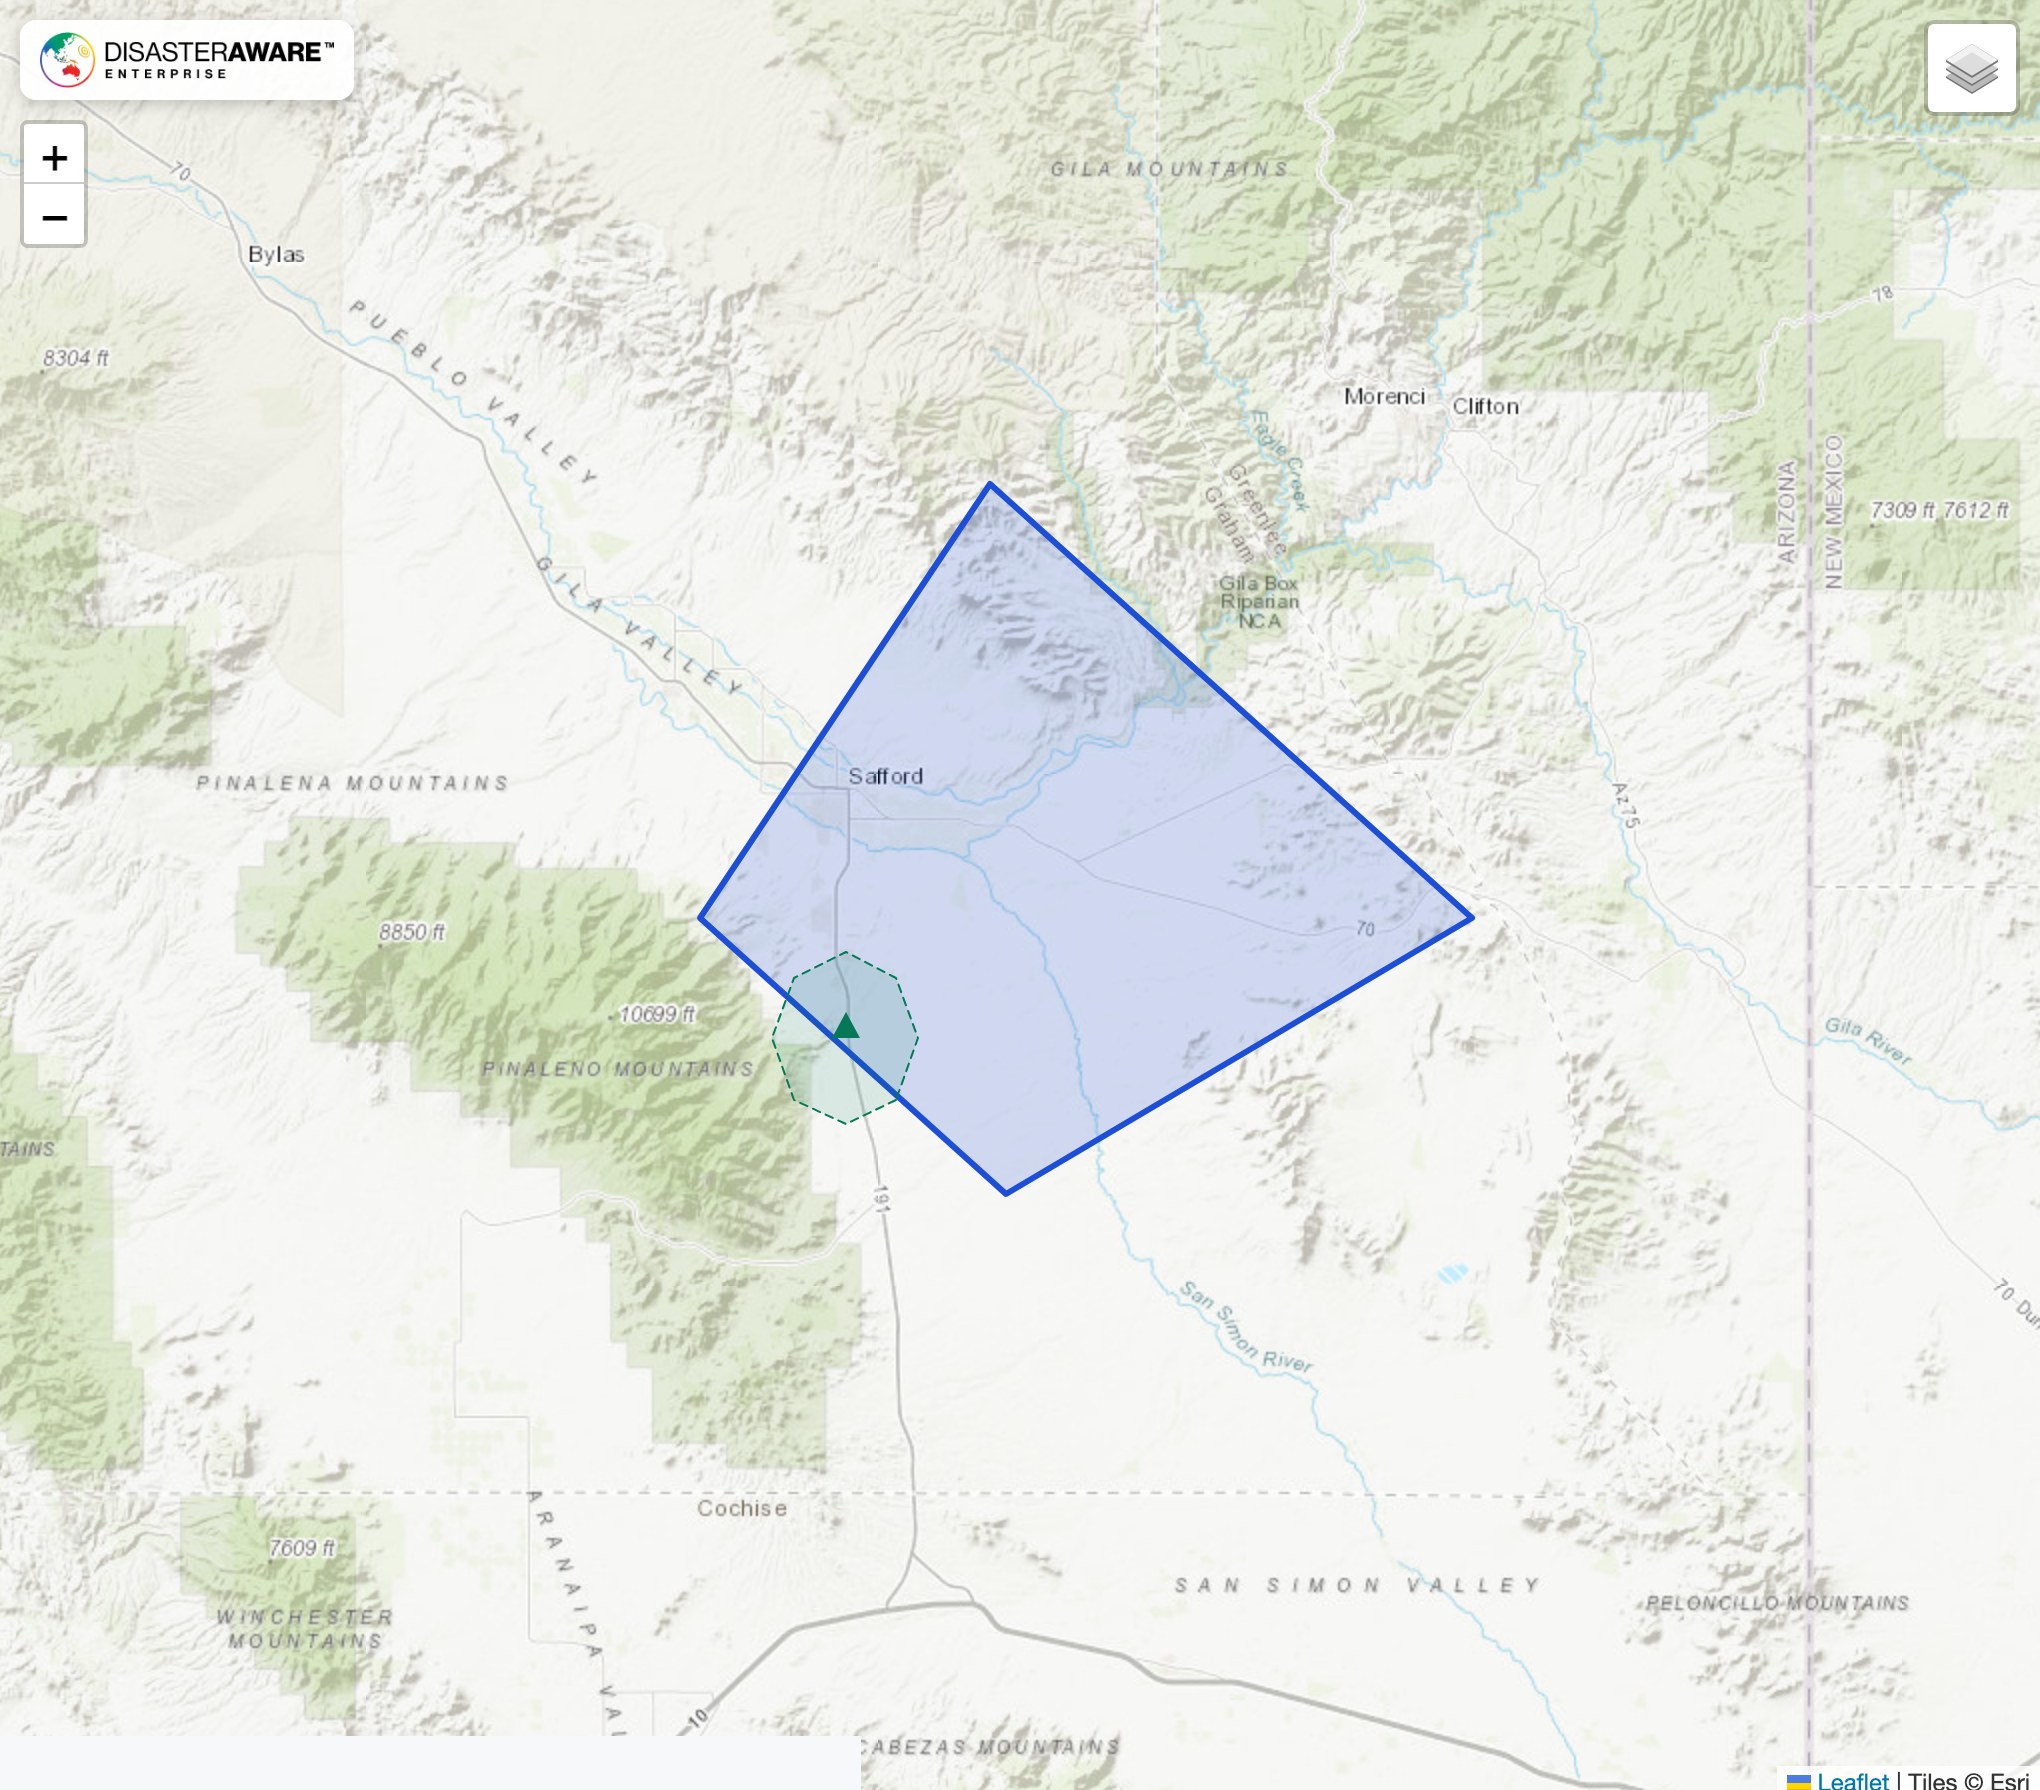
A severe wind hazard near Safford, Arizona: the warning polygon, the measured gust that confirmed it, and the report footprint that becomes the hazard's exposure area.
The hail and wind feeds need their own access on your DisasterAWARE API credential; a token that works on the other hazard endpoints will not necessarily work here. Contact your sales contact or support@disasteraware.com to have it added, or to talk about hail and wind data if you do not have API access today. The hail and wind documentation pages carry the full parameter reference, the lifecycle rules and a complete sample record for each feed.
What do the /hail and /wind endpoints return?
Every active hail or severe wind hazard DisasterAWARE is tracking, one record per hazard, as gzipped NDJSON. Each record carries the linked NWS warnings with every version, the radar hail swath by size band (hail), the ground reports, the observed footprint as exposure areas, and an assessment block that labels the evidence.
How do I know whether a hazard is confirmed?
Read the basis. For hail, hail_basis is report when hail was reported on the ground, radar for a radar signature of 1 inch or more, warning when only a tagged warning exists, and radar_brief for a short radar-only signature that is published but labelled unconfirmed. For wind, wind_basis is gust_measured, damage_reported or forecast_only.
How fresh is the feed?
The file is rewritten when something changes, at most every two minutes, and every redirect carries the time it was last written. If the feed's heartbeat is more than 15 minutes old the endpoint returns a 503 rather than stale data.
What happens when a hazard ends?
It leaves the active file on the first write after it ends and moves to the history archive. Its final record states why it ended and, the next day, is finalised once late reports have arrived. A historical scope for those records is planned; until it ships, a client that needs to detect endings compares successive files.
Are DisasterAWARE's existing STORM and TORNADO records included?
No. The two feeds return only hazards of type STORM with the HAIL or WIND sub-type. The general active hazards endpoint is unchanged.
Do I need new credentials?
You need the hail or wind feed access added to your existing DisasterAWARE API credential. Contact your sales contact or support@disasteraware.com to have it added.
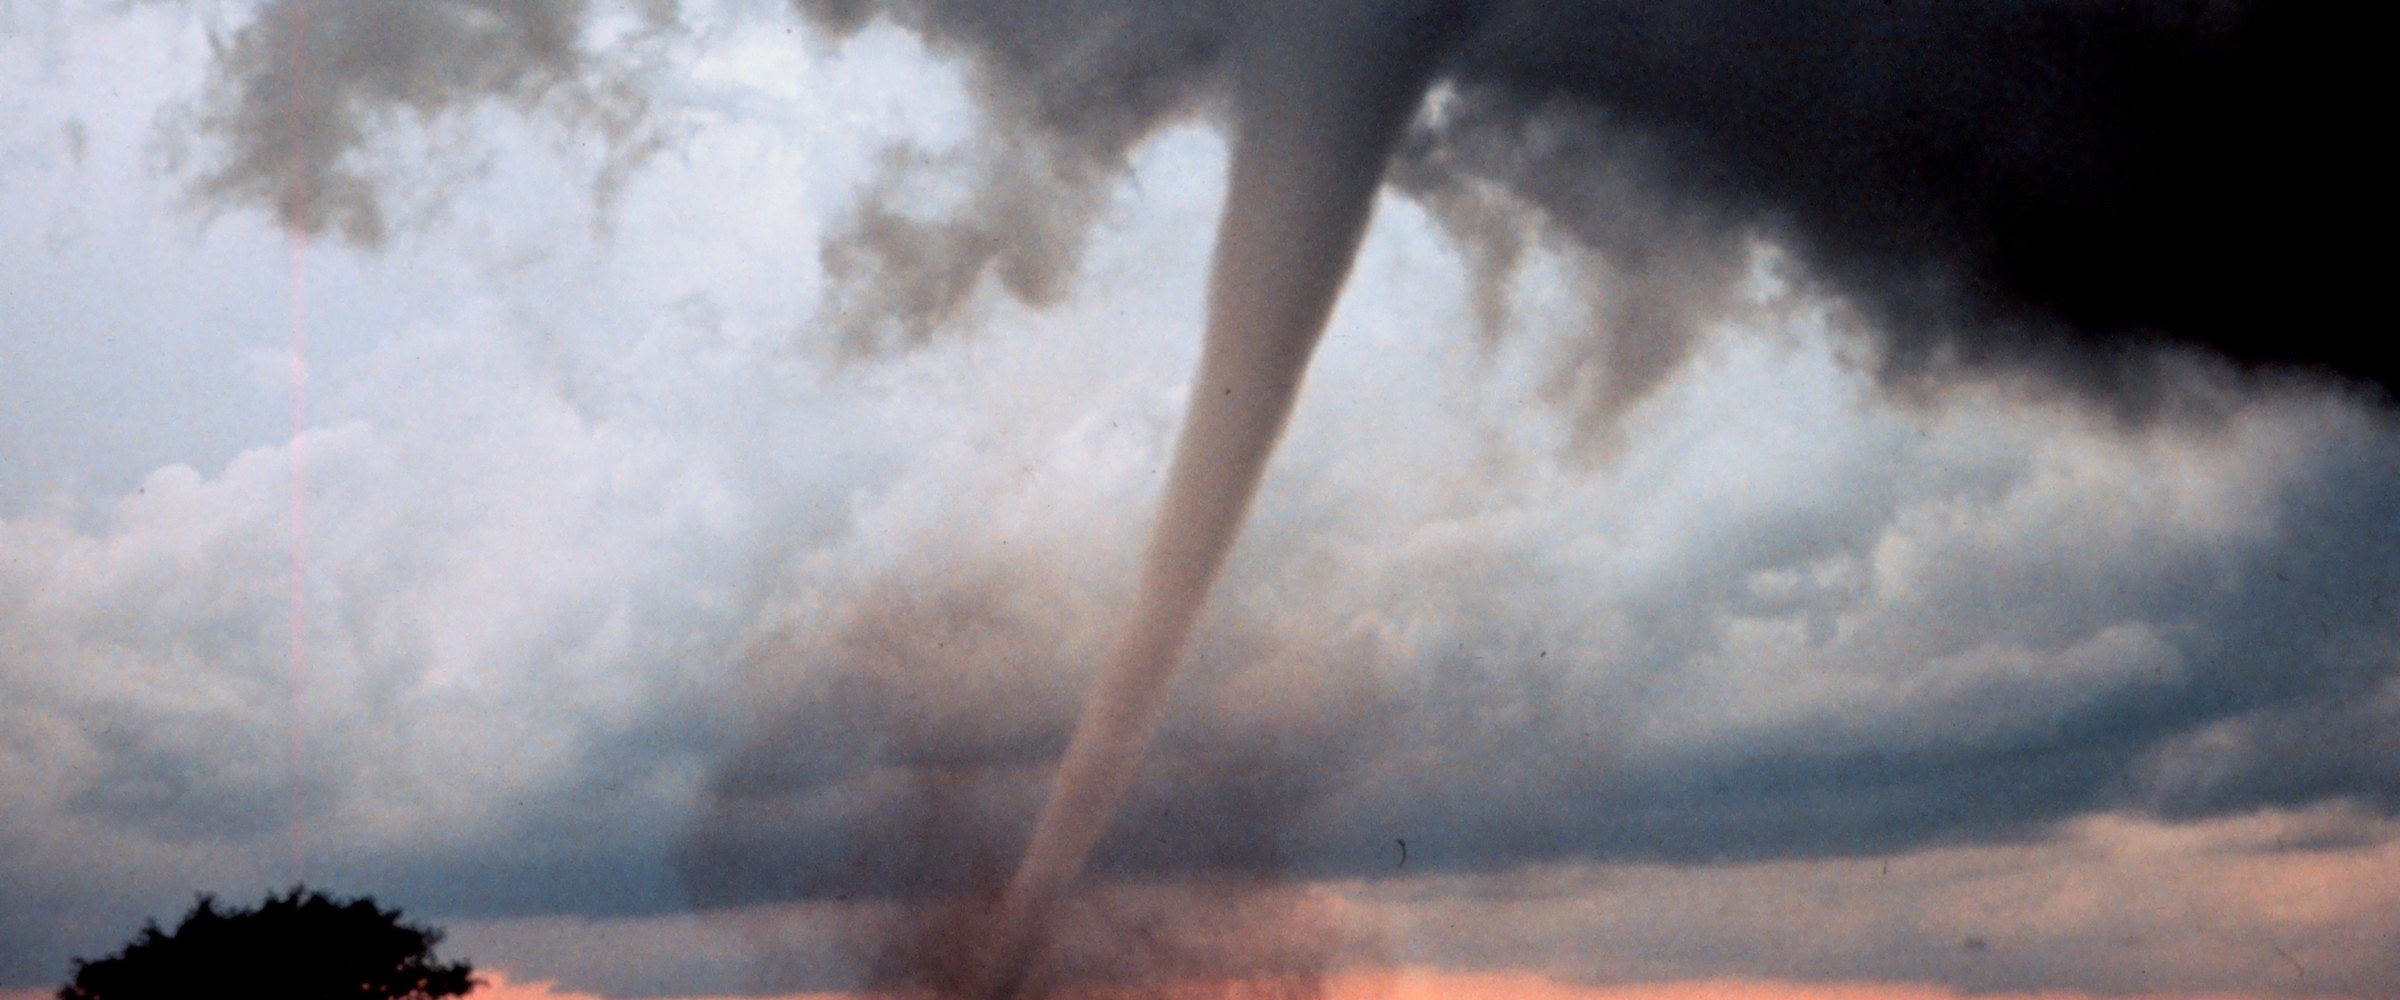
Sources: DisasterAWARE V2 API documentation for the /hail and /wind endpoints (23 October 2026); DisasterAWARE live hail and wind records for 21 October 2026 12:00 UTC to 22 October 2026 12:00 UTC. Underlying data: National Weather Service warnings (CAP/VTEC), NOAA MRMS MESH radar hail estimates, NWS local storm reports and Storm Prediction Center preliminary reports. Maps rendered from the records' own geometry on Esri World Topographic tiles. Banner photo: hail fog near Imperial, Nebraska, 7 June 2022, Leia Otterstatter / NOAA NSSL (CC BY 2.0).




Decision-ready intelligence for understanding what's happening, what is impacted, and what to do next. Global hazard, severe weather, catastrophe, and physical risk intelligence trusted by governments, enterprises, insurers, humanitarian organizations, and technology platforms worldwide.
Request DemoContact Us

