


DisasterAWARE Weekly Intelligence Brief — September 4 to 14, 2026
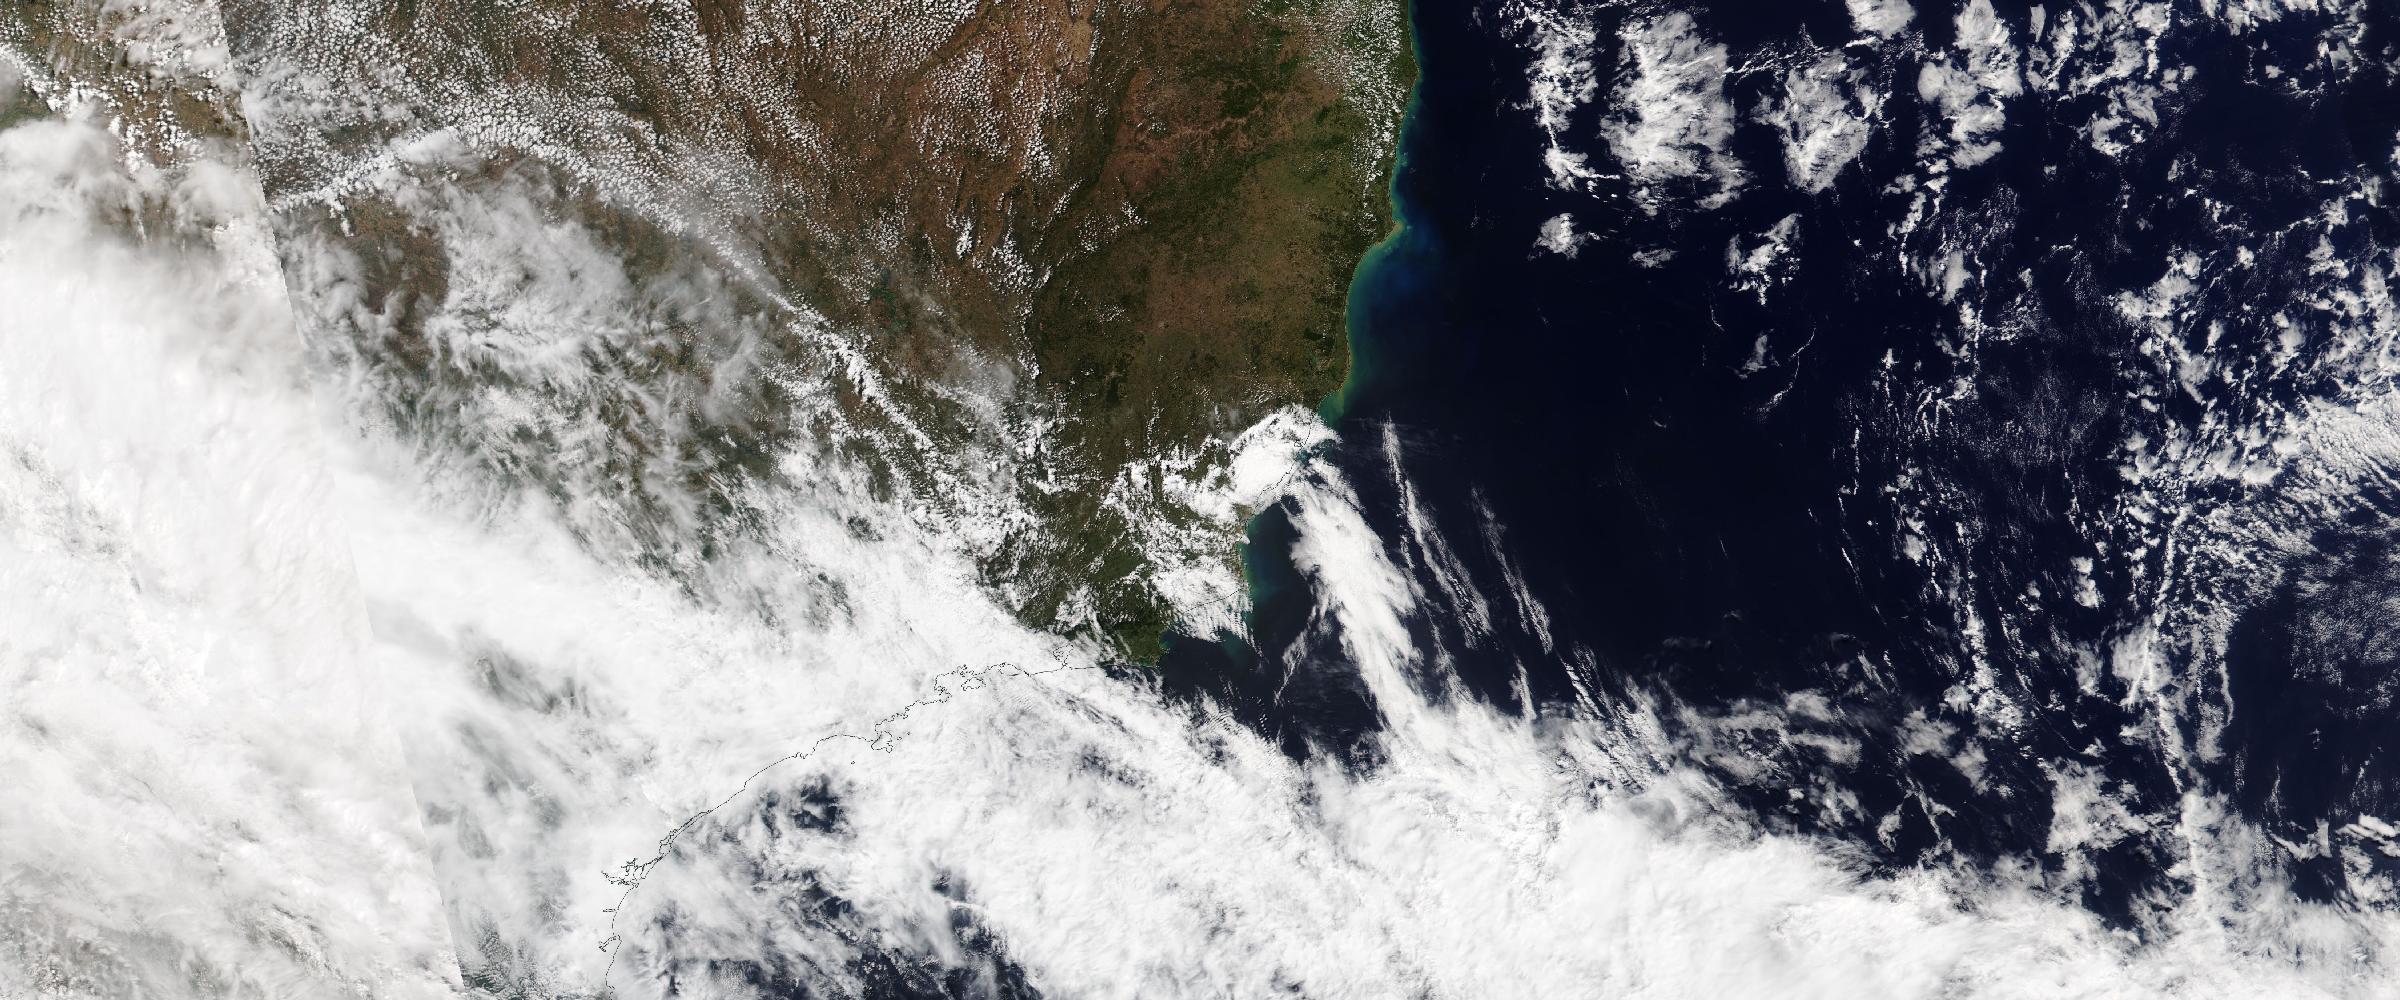
There was no day off. From September 4 through September 14, Brazil's National Institute of Meteorology (INMET) had at least one severe-thunderstorm or heavy-rain product in force on every single day of the window — eleven consecutive days, 25 distinct issued products once records are deduplicated across our feeds. Let us be precise about what that is and is not: these are alerts, not observed events — forecast products with defined footprints and modeled exposure, not reports of what happened. But the footprints were extraordinary. The September 9 thunderstorm advisory spanned Central, Southeast and South Brazil with an estimated 124 million people inside it — more than half the country under a single day's product. Nineteen of the 25 were advisory-tier; then the pattern sharpened: six warning-tier products in the window's final five days, INMET's higher-urgency class, converging on the São Paulo–Minas Gerais–Rio de Janeiro corridor. September 14 closed with a warning-tier double: a thunderstorm warning whose footprint held an estimated 60.9 million people and a heavy-rain warning holding 57.6 million, stacked over the same four states.
The honest headline is this: the weather over Brazil was severely unsettled for eleven straight days, the national alert apparatus ran continuously at national scale, and by day seven the country's richest state had moved its entire emergency structure into one room. What verified on the ground, footprint by footprint, sits outside this dataset's observed layer — and this brief will not pretend otherwise. What we can document is the alert siege itself, and what institutions did under it.
How to read every number in this brief: Alert-tier records (advisories, watches, warnings issued by INMET, the US National Weather Service, the Mekong River Commission, and other met services) are issued products: their populations are estimates of who sits inside the product's footprint, not counts of people affected. Observed-tier records — wildfire incidents and satellite heat detections, earthquake measurements, volcano activity reports, cyclone position fixes, damage reports — document things that happened. We label each number by its tier throughout, we never sum exposure across overlapping products, and where ground truth exists only in local reporting, we cite it as such. The 4,030 formal alert records our occurrence filter set aside are a separate, third pile — products the pipeline already classifies as pure context. The distinction between a warning, a report, and a footprint is not pedantry; it is the entire severe convective storm data problem, and this window is a live demonstration.
Observed tier:
Alert tier (issued products; populations are footprint estimates):
The sequence reads like a metronome — every timestamp below is a product issuance, not an observation. September 4: a heavy-rain advisory over northern and central Brazil, 6.4 million in the footprint. September 5: a multi-state thunderstorm advisory, 107 million. September 6: 105 million. September 7 and 8: the Amazon and adjacent northern regions join, then a central-north-southeast product, 35–47 million per footprint. September 9: the widest product of the window — Central, Southeast and South Brazil, an estimated 124 million people.
Then the tier changed. On September 10 INMET issued the window's first warning-class product — Paraná, Santa Catarina, São Paulo and Mato Grosso do Sul, 13.7 million in the footprint — and the same day, São Paulo's Civil Defense escalated to what local reporting called the state's most serious weather warning of the spring: severe thunderstorms forecast for Friday and Saturday with hail, lightning, microbursts and, in isolated areas, tornadoes. September 11 brought the window's largest warning-tier footprint, South and Southeast Brazil, an estimated 91.4 million people, alongside a second, tighter warning on the same states. September 12: Paraná through Minas Gerais, 41.9 million, warning tier again. And September 14 closed the window with the double — thunderstorm and heavy-rain warnings, 60.9 and 57.6 million, stacked over São Paulo, Minas Gerais, Espírito Santo and Rio de Janeiro.
Eleven days, 25 products, zero gaps — a national forecast apparatus running flat-out. For risk teams with assets or suppliers in the corridor — São Paulo state alone is roughly a third of Brazil's GDP — the operative question was never "is there an alert today?" The answer was always yes. The question was which footprint, at what tier, over which assets — and then, what actually happened there. The first three, alert-tier intelligence answers. The fourth needs an observed layer — and the gap between them is precisely why a warning is not a report, and a report is not a footprint.
See every hazard, everywhere, as it happens
DisasterAWARE monitors 30+ hazard types worldwide in real time — with the population, infrastructure, and assets exposed under each one.
What makes September 10 the hinge of this story is not meteorology — it's institutional behavior, and that part is fully observed. Facing a 36-hour severe-weather forecast, the government of São Paulo state convened all 645 of its municipalities plus every state secretariat for a same-day briefing on the scenario and each agency's role. The centerpiece was a Gabinete de Crise — a physical crisis cabinet seated inside the state's Emergency Management Center from Friday afternoon continuously through Saturday, holding the fire department, military police, the state water utility and transport agencies in one room for the duration.
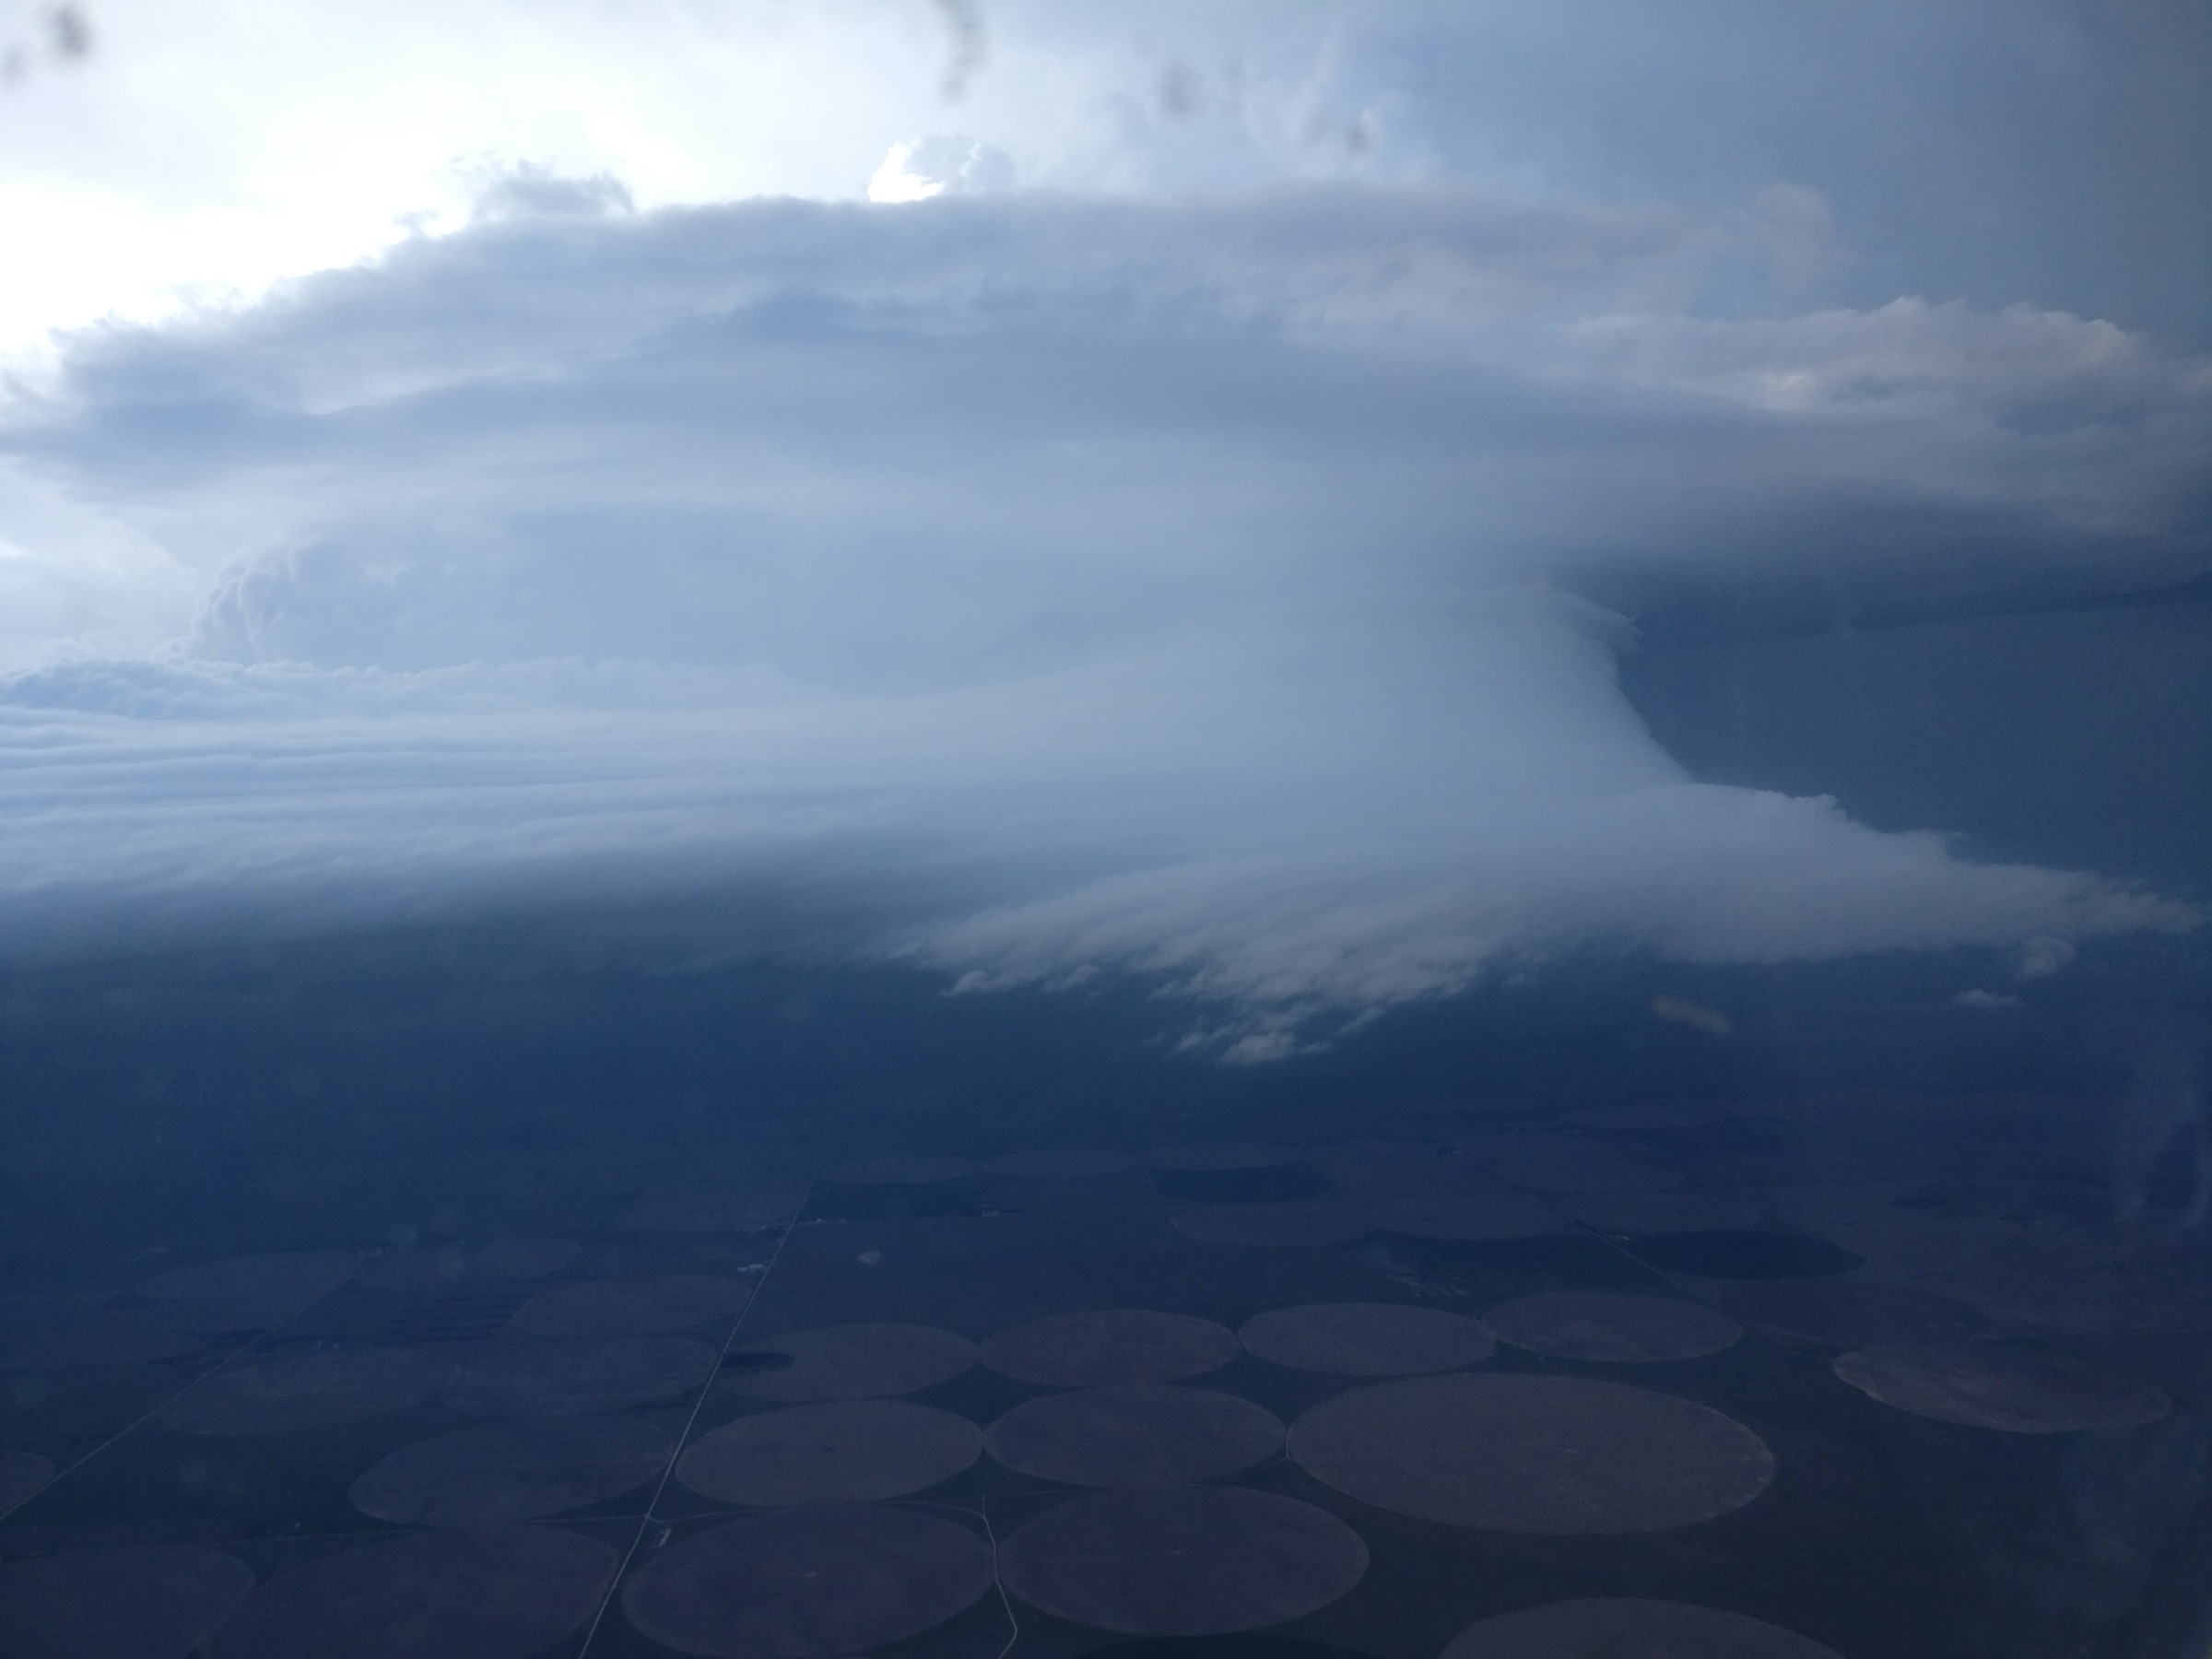
That is what serious risk posture looks like when a forecast includes the word "tornado" in a region where the word itself moves governments. Southern Brazil sits on South America's most active severe-convective corridor — the same dynamics that build United States supercells operate between the Andes and the Atlantic — but the institutional muscle memory is younger. A state that stands up a continuous crisis cabinet on a forecast has decided that mobilizing on warnings is cheaper than mobilizing on wreckage. It is also a case study in the cost of coarse footprints: event-level intelligence about which hazard, which corridor, which hour is the difference between briefing 645 municipalities and pre-positioning in the right forty.
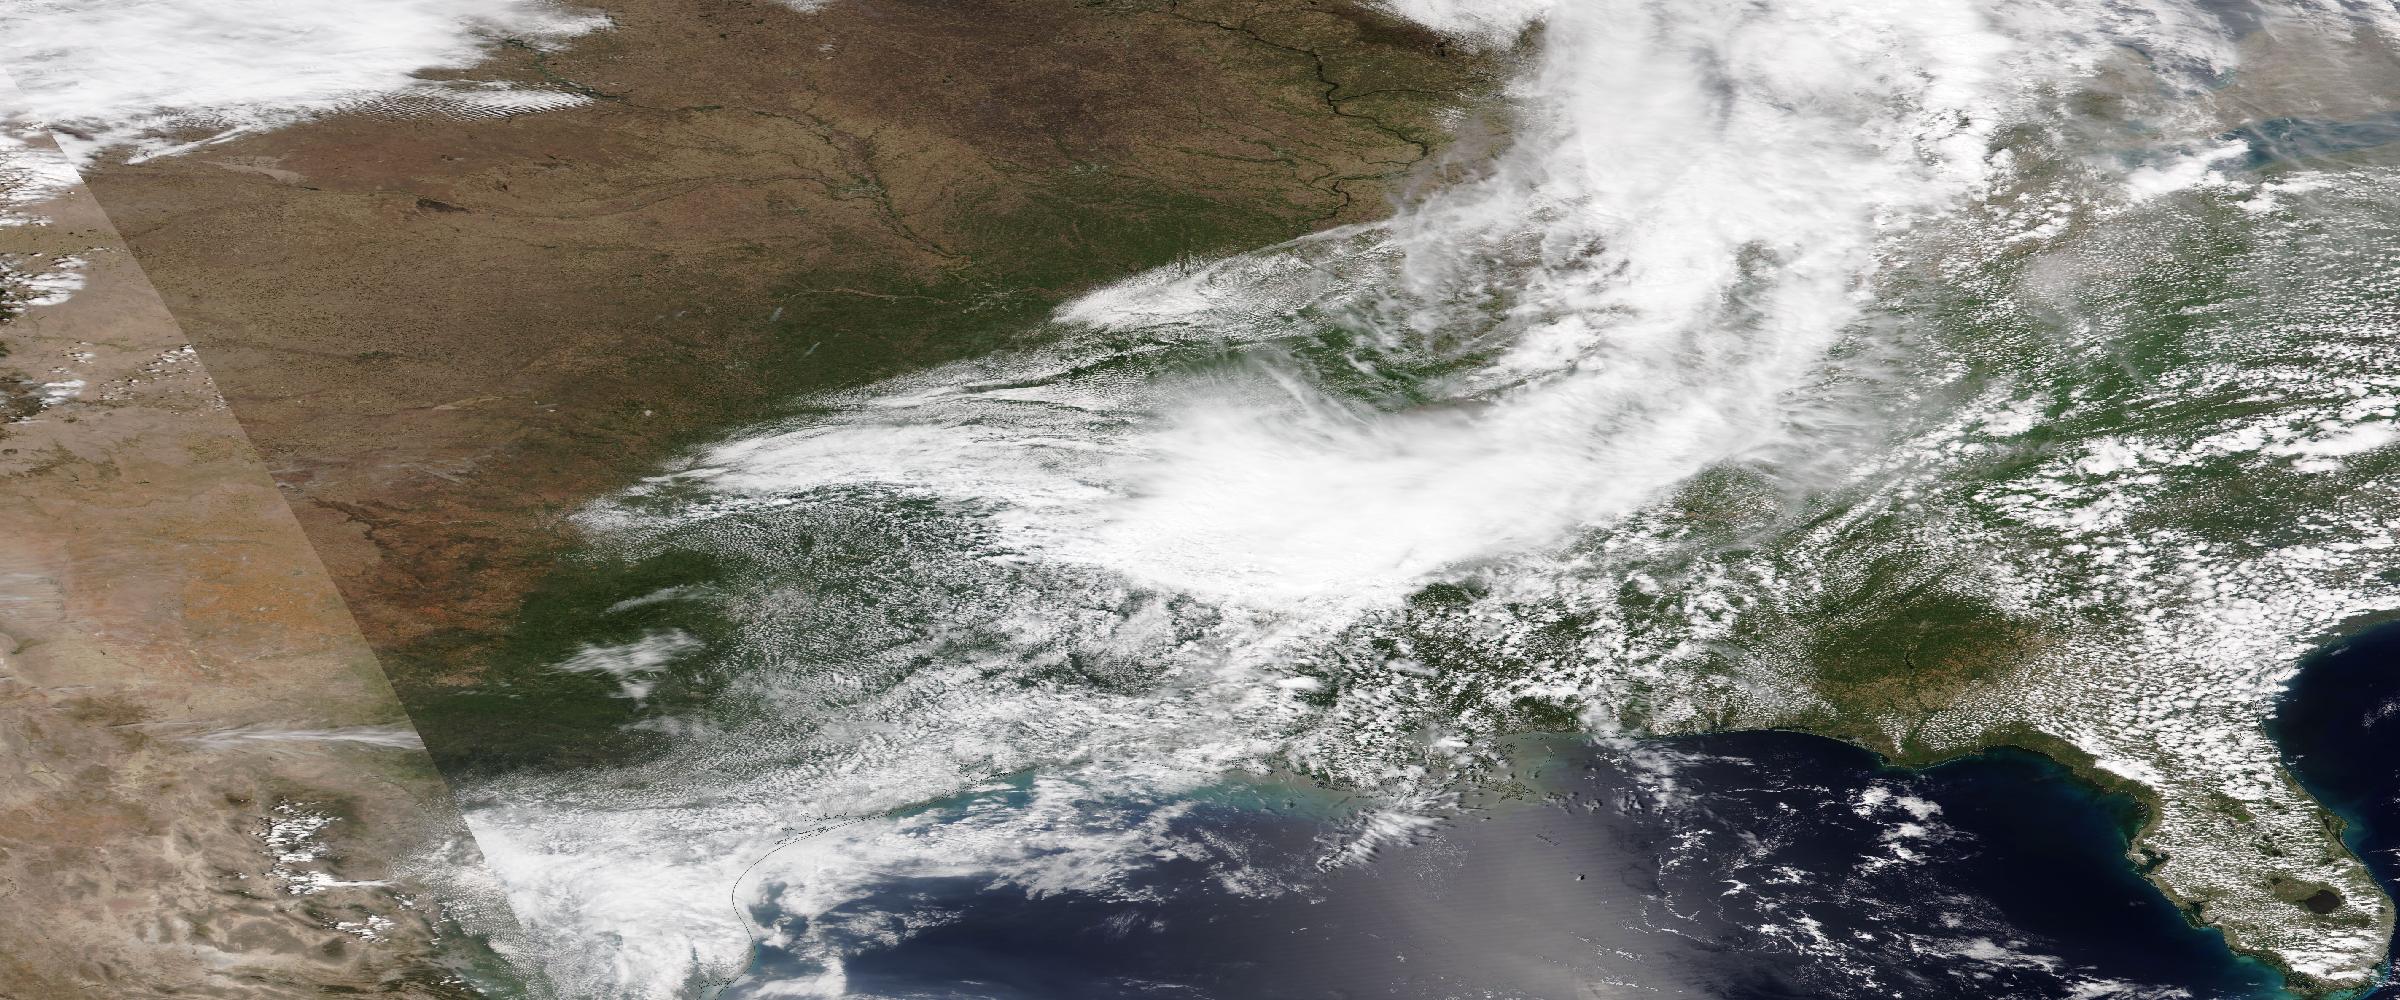
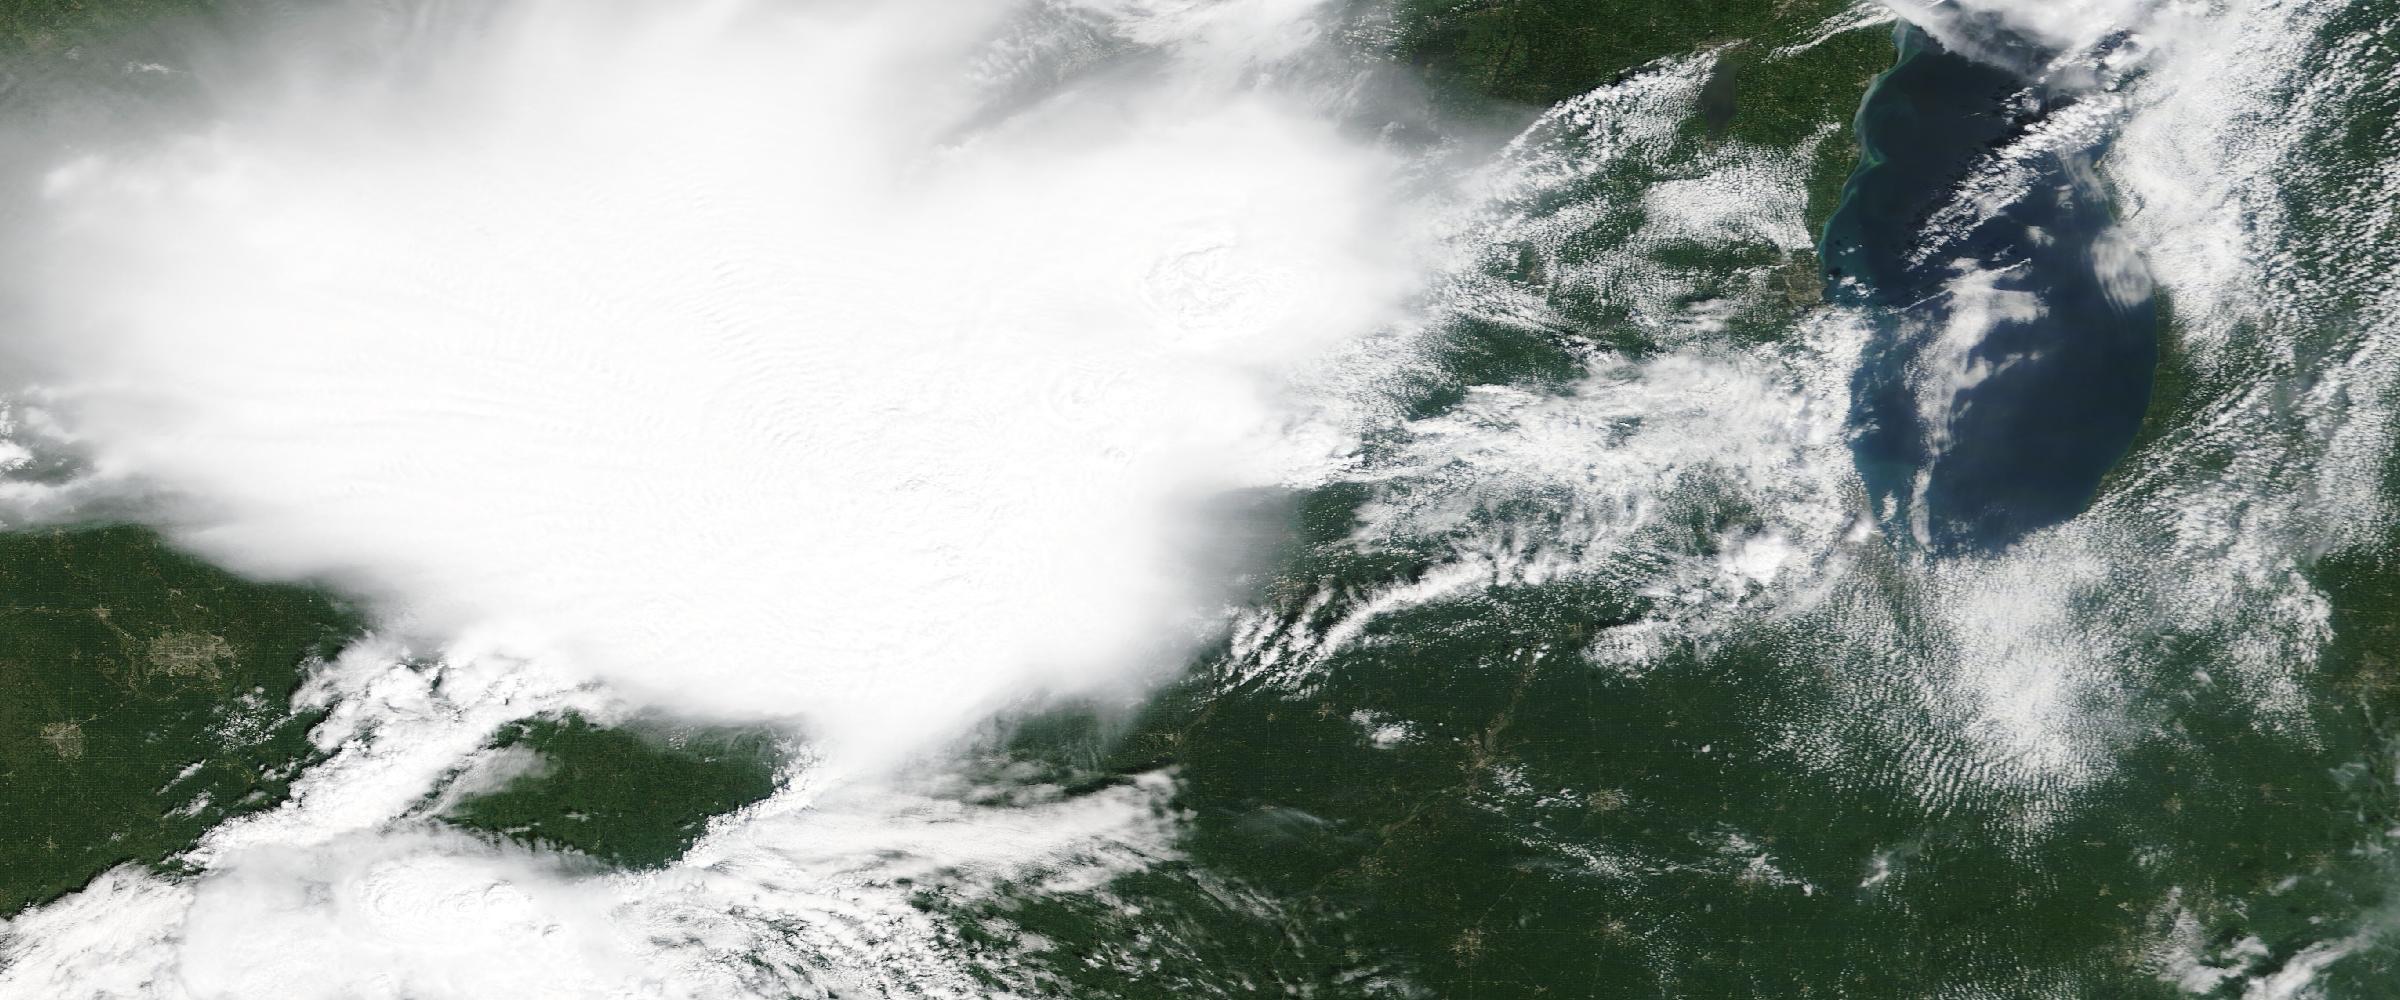
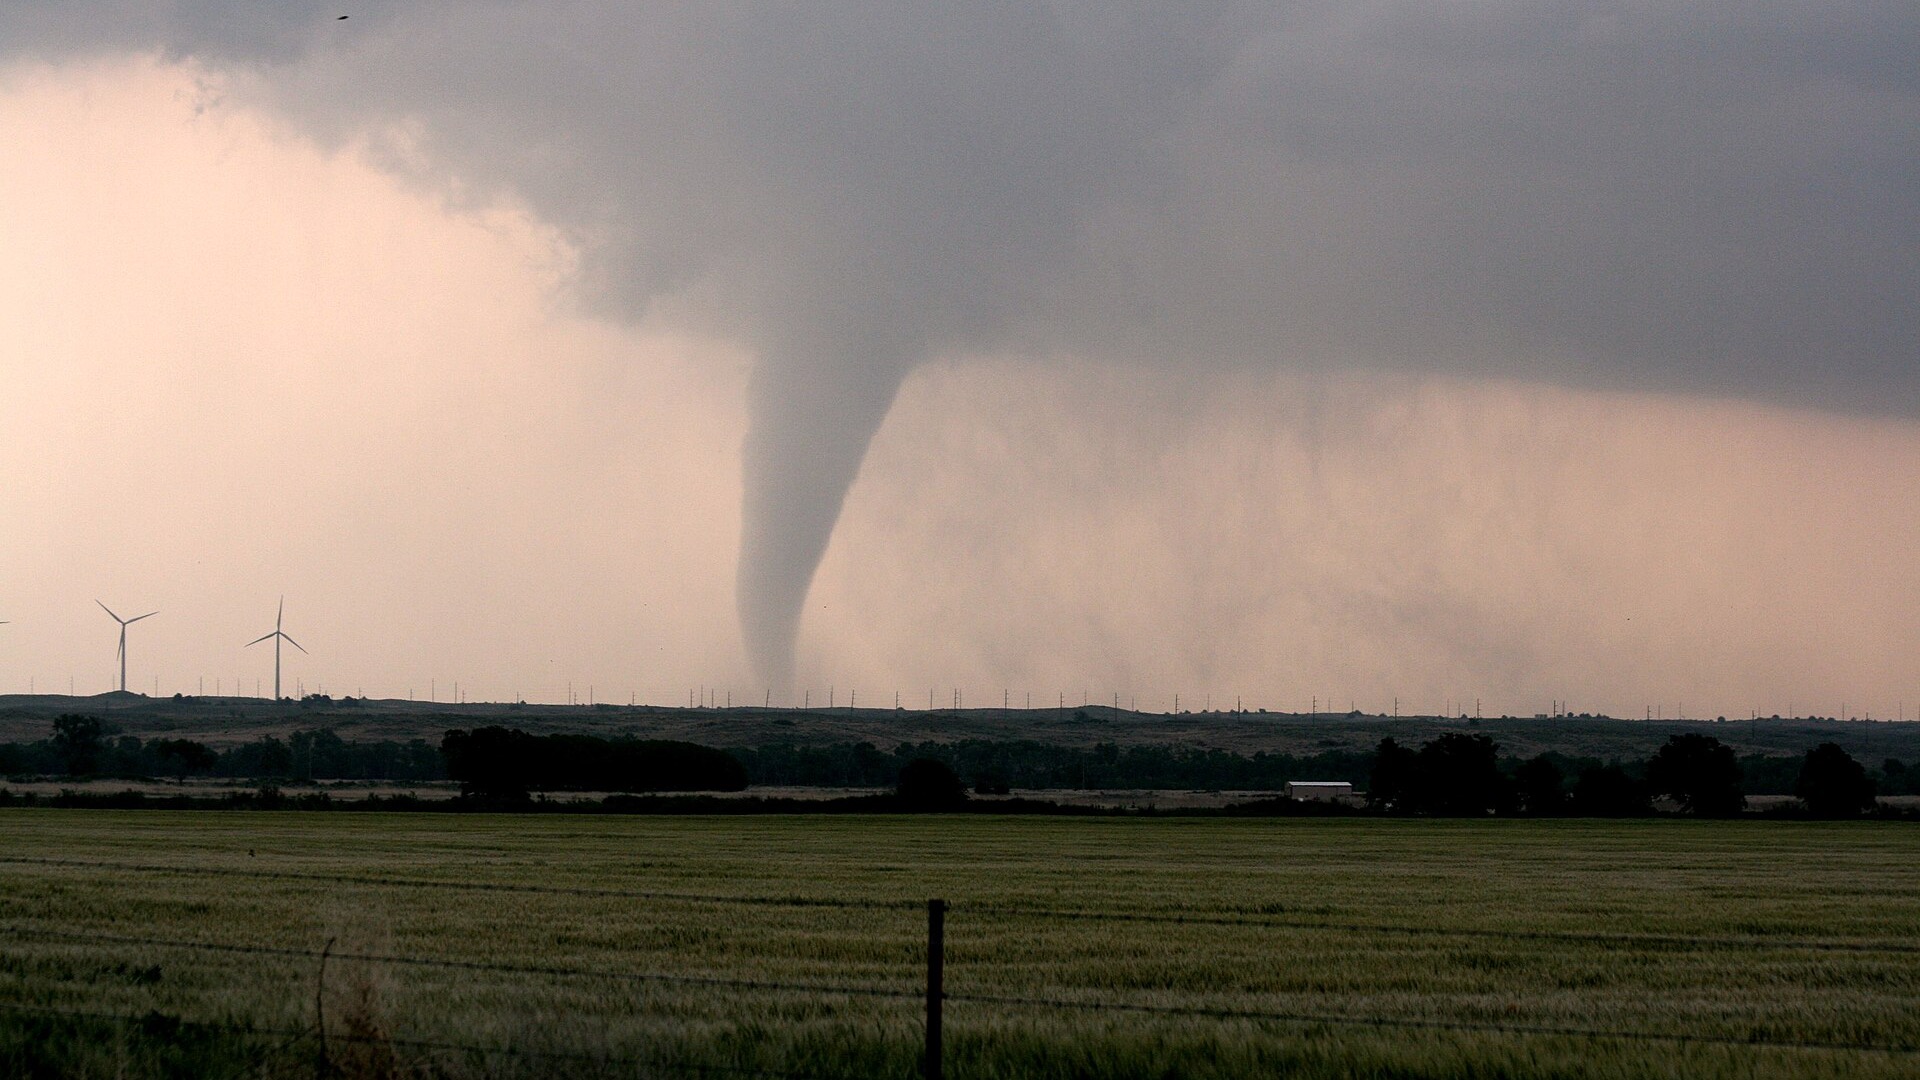
The United States ran the same two-tier story at retail scale. Over eleven days the National Weather Service issued nine tornado warnings across seven states — Wisconsin and southeastern Virginia (Sept 4), a three-warning cluster over Sheridan County, ND and Charles Mix and Bon Homme counties, SD (Sept 8 UTC), Licking County, OH plus two north-central Pennsylvania warnings (the night of Sept 9, local time), and west-central Minnesota (the night of Sept 11). Each was a short-fuse product — typically 25 to 40 minutes — with footprint populations from a few hundred people to a few thousand.
Behind the warnings, the observed layer filled in over the following days, the way tornado climatology always does — by survey. NWS teams confirmed a touchdown near Bradford Airport in McKean County, Pennsylvania on September 9; a tornado in Guernsey County, Ohio from the same Wednesday-night storms; a tornado in Stevens County (Artichoke), Minnesota; and an EF-0 along Route 10 in Surry County, Virginia on September 12, per local reporting of the surveys. North of the border, the same continental pattern produced a confirmed cluster across southern Manitoba and southwestern Ontario — including two Winnipeg-area touchdowns and an EF-1 near Monkton, Ontario, with one injury reported in Manitoba.
Add 48 NWS flood warnings and advisories — the Ohio Valley, the Washington, D.C. metro, coastal South Carolina, Arkansas, Arizona, New Mexico — and the window is a textbook illustration of dispersed severe-weather risk: no single headline event, just a steady drumbeat of short-fuse warnings, a handful of verified touchdowns, and the accumulation problem that pattern creates for portfolios.
Southeast Asia's monsoon tail put the Mekong system under a chain of 29 Mekong River Commission riverine flood products this window — 28 watches and one warning, stepping downstream from Ban Mai Singsamphan in Laos through My Thuan, Tan Chau, Chau Doc and Can Tho in Vietnam's delta. The delta watch footprints each held roughly 19.5 million people — one of the planet's densest concentrations of population, rice production and aquaculture, at elevations measured in single-digit meters.
A river-flood watch is the most honest kind of alert product there is: the crest that reaches Can Tho was measurable at Tan Chau days earlier, so the watch is anchored in an observed upstream state. That is also its limit — the watch tells you the river; it does not tell you which fields, roads and mills sit inside the water's path. Footprint intersection is what turns a gauge reading into a decision.
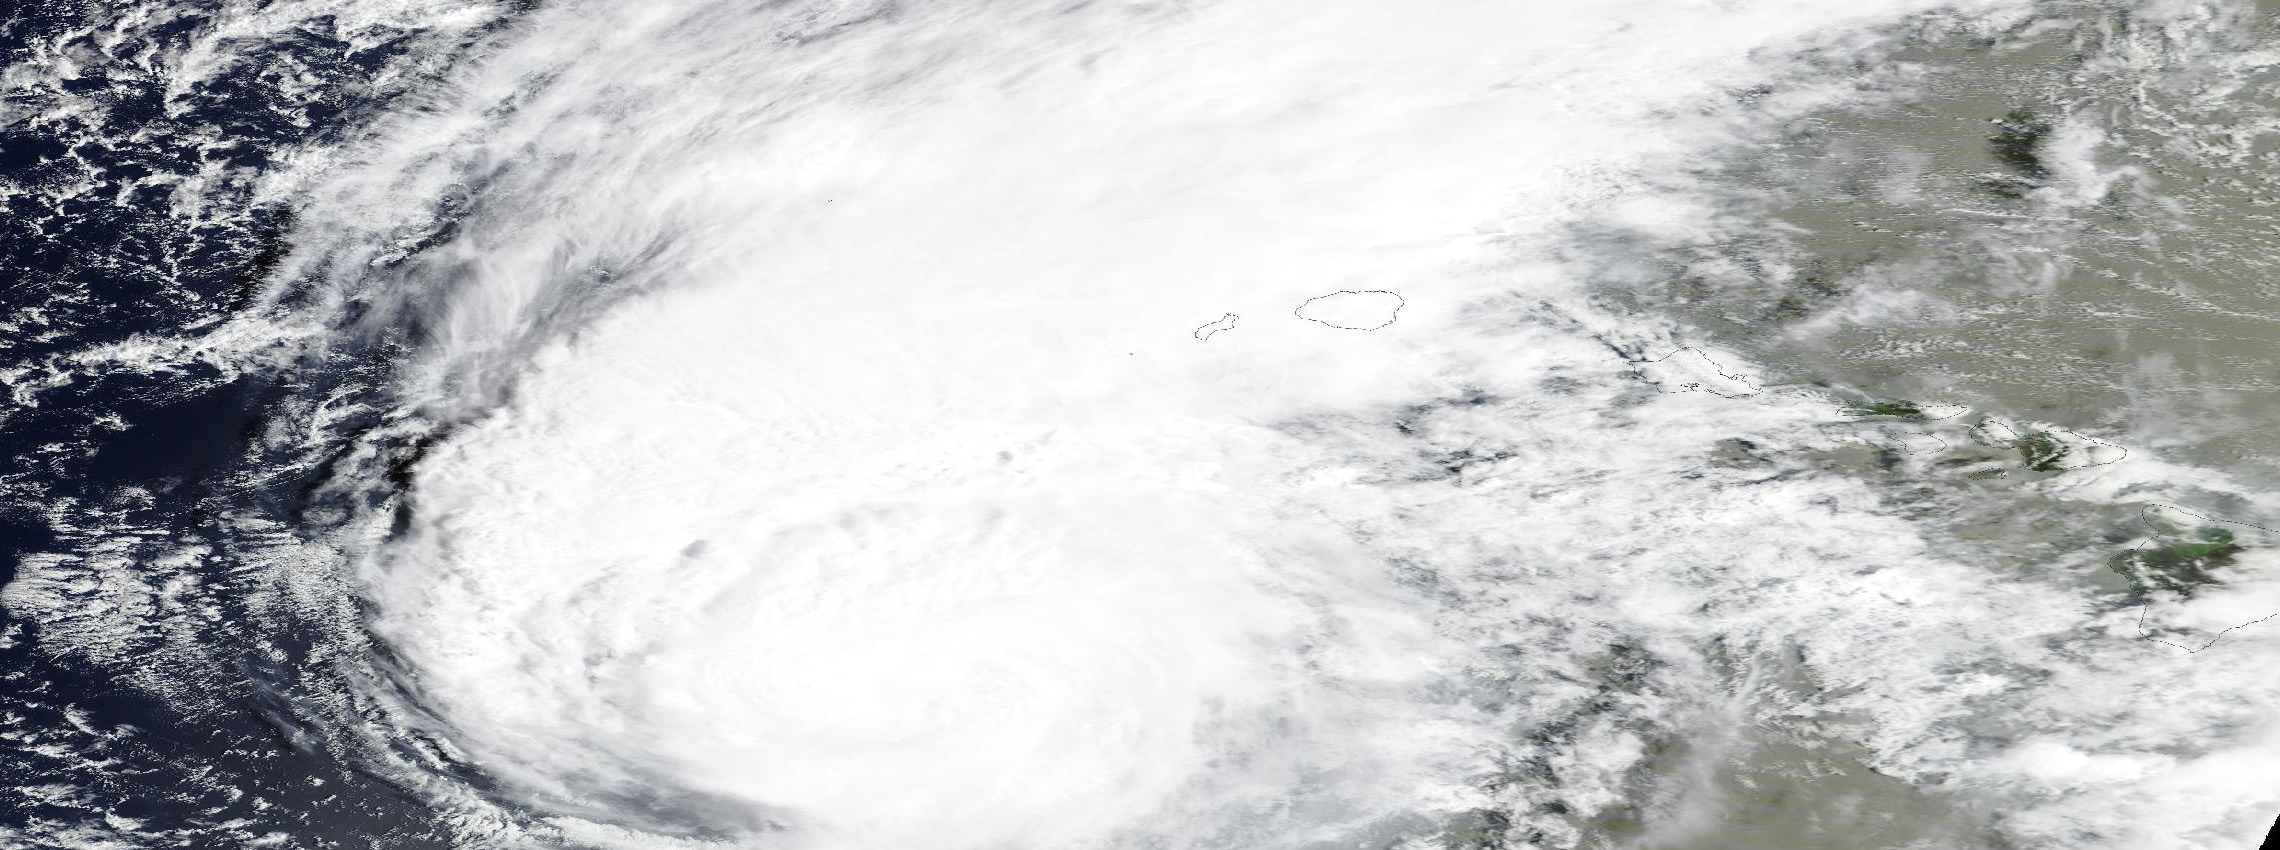
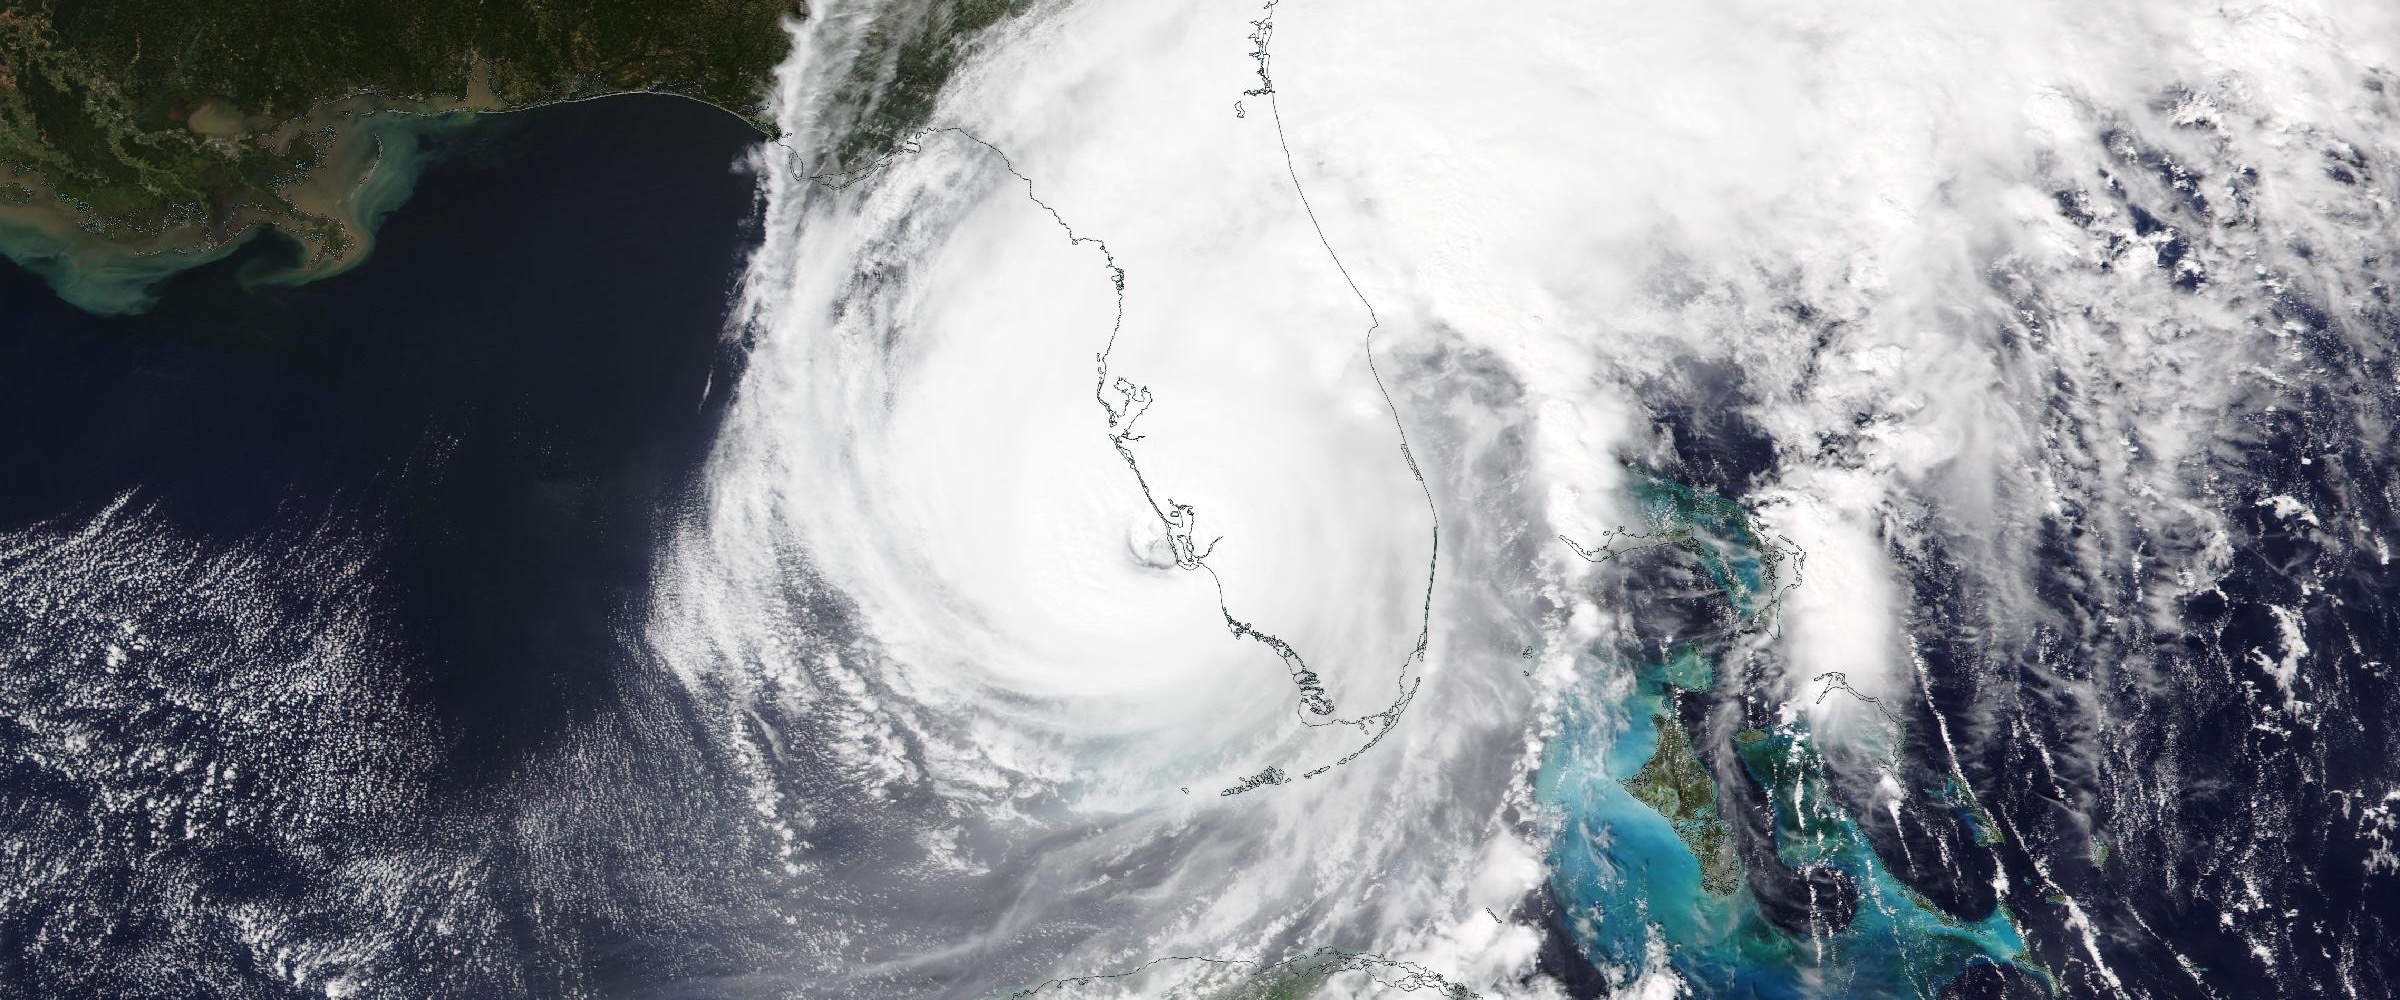
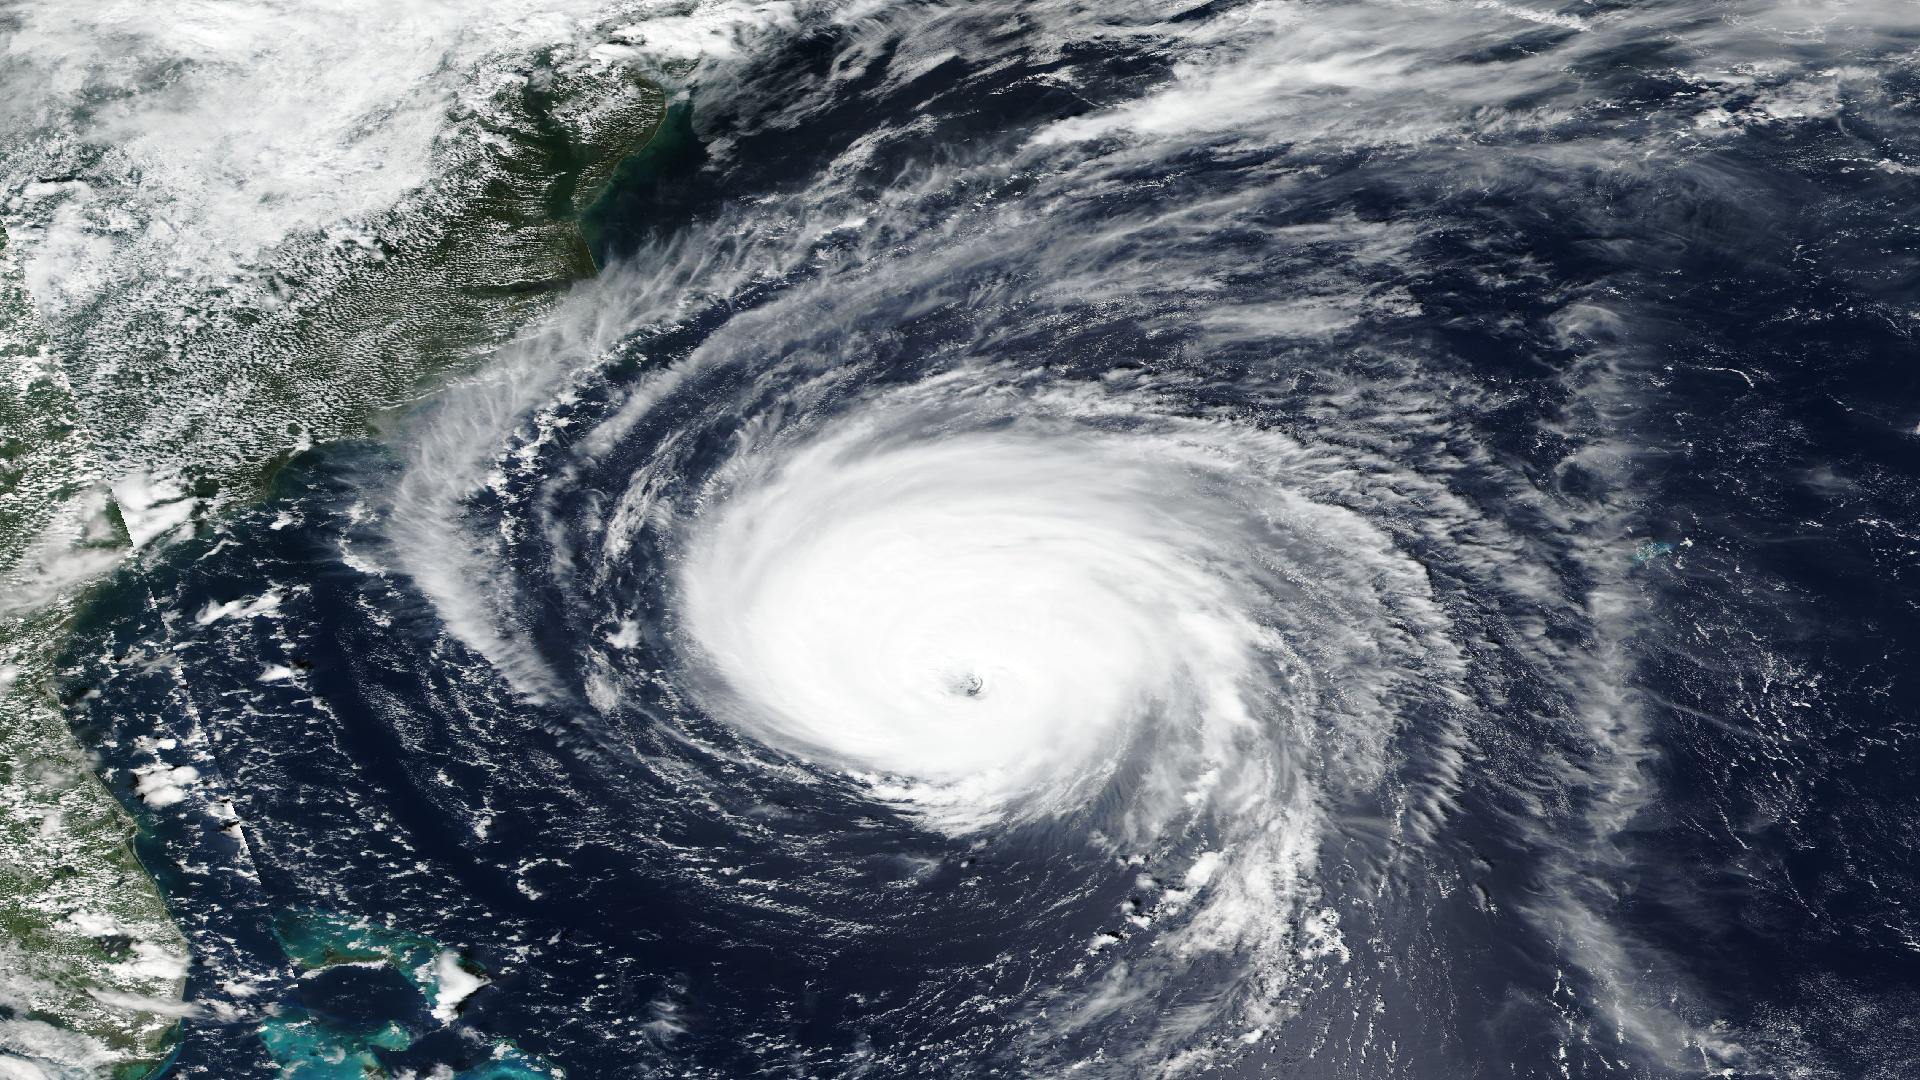
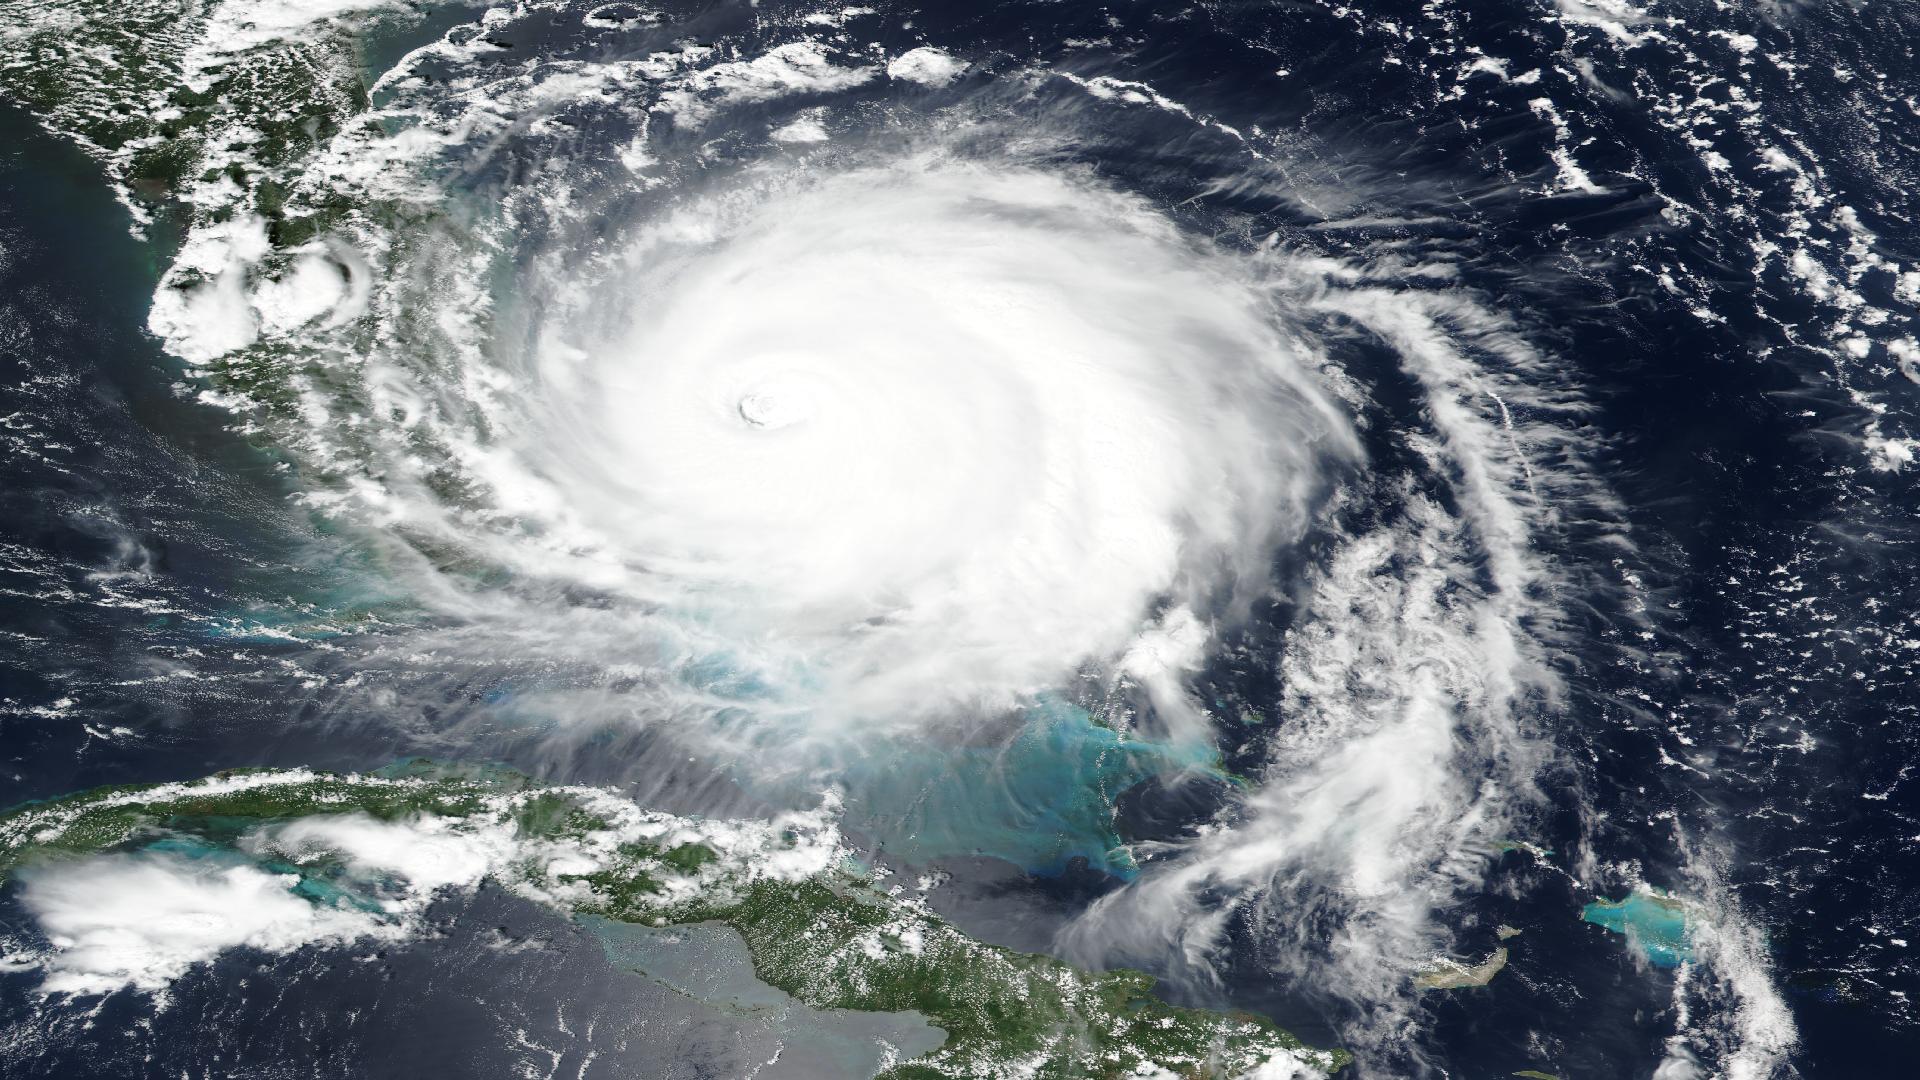
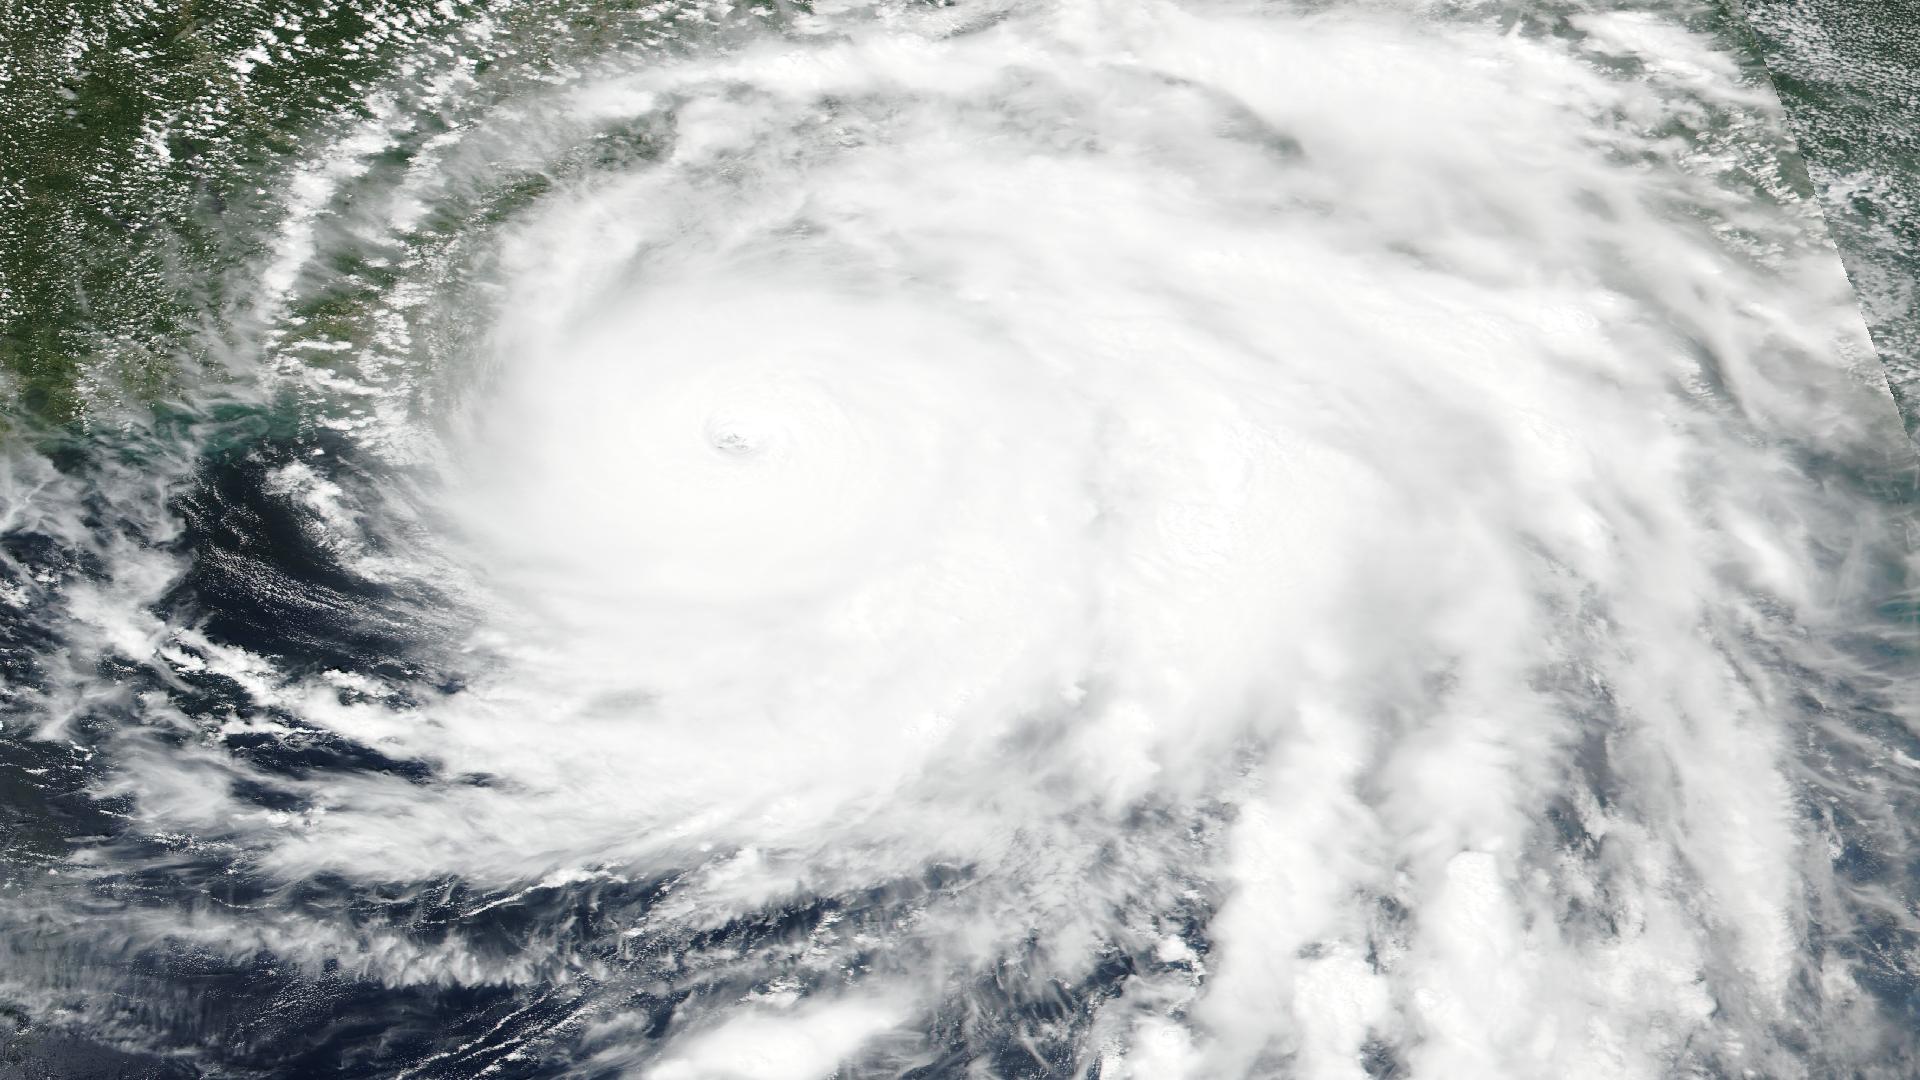
The Northwest Pacific produced two systems under JTWC advisories — Tropical Depression Krovanh (from September 9) and Tropical Depression Twentythree (from September 5) — real, observed circulations whose forward tracks are forecast products; both were modest at advisory time in a basin where October remains prime season. The Atlantic's Edouard closed out as remnants. And in the Central Pacific, post-tropical Lowell spun down by September 11 — the twice-over Category 5 whose 40-mile near-miss of Kauaʻi we covered in last week's full analysis.
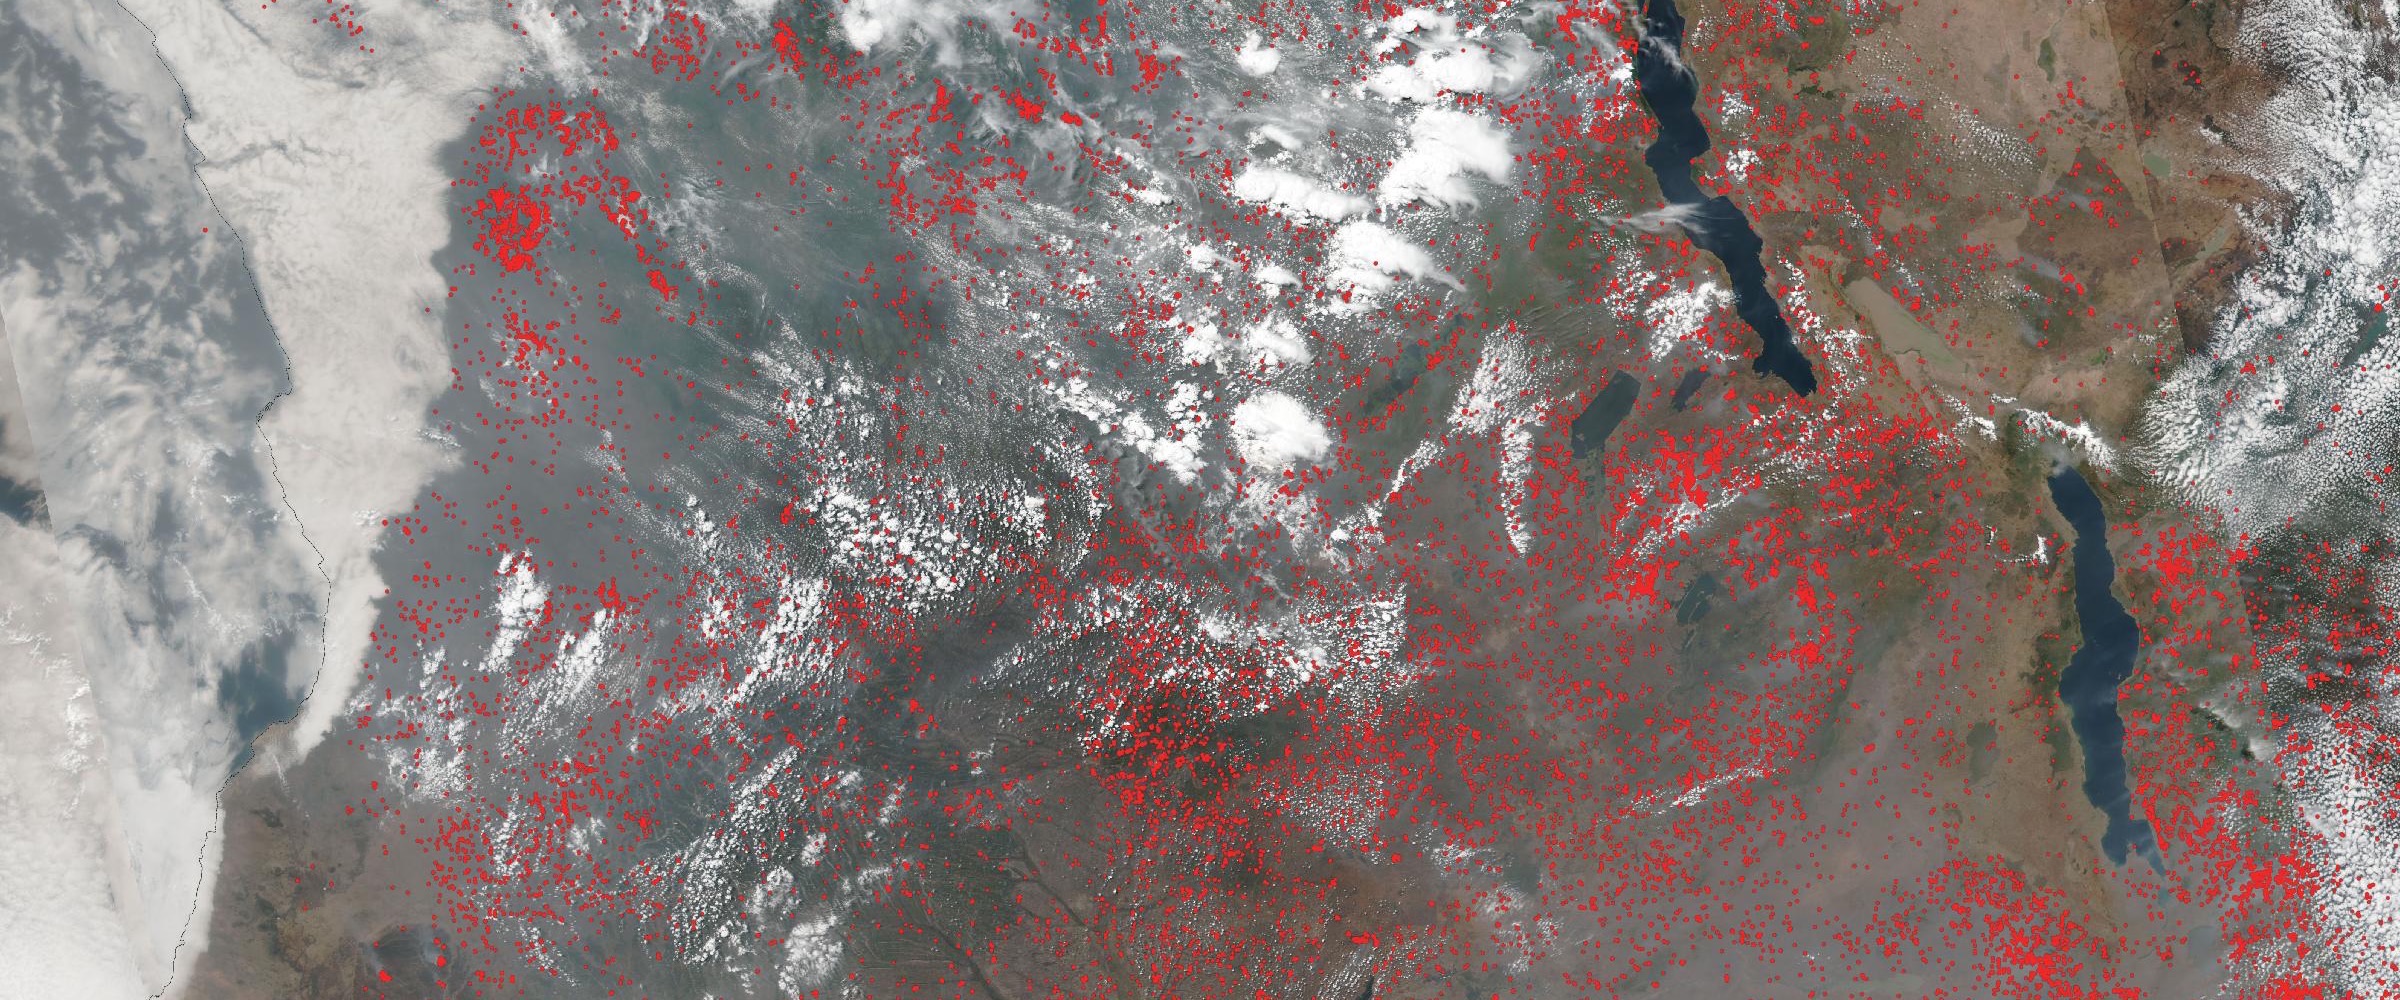
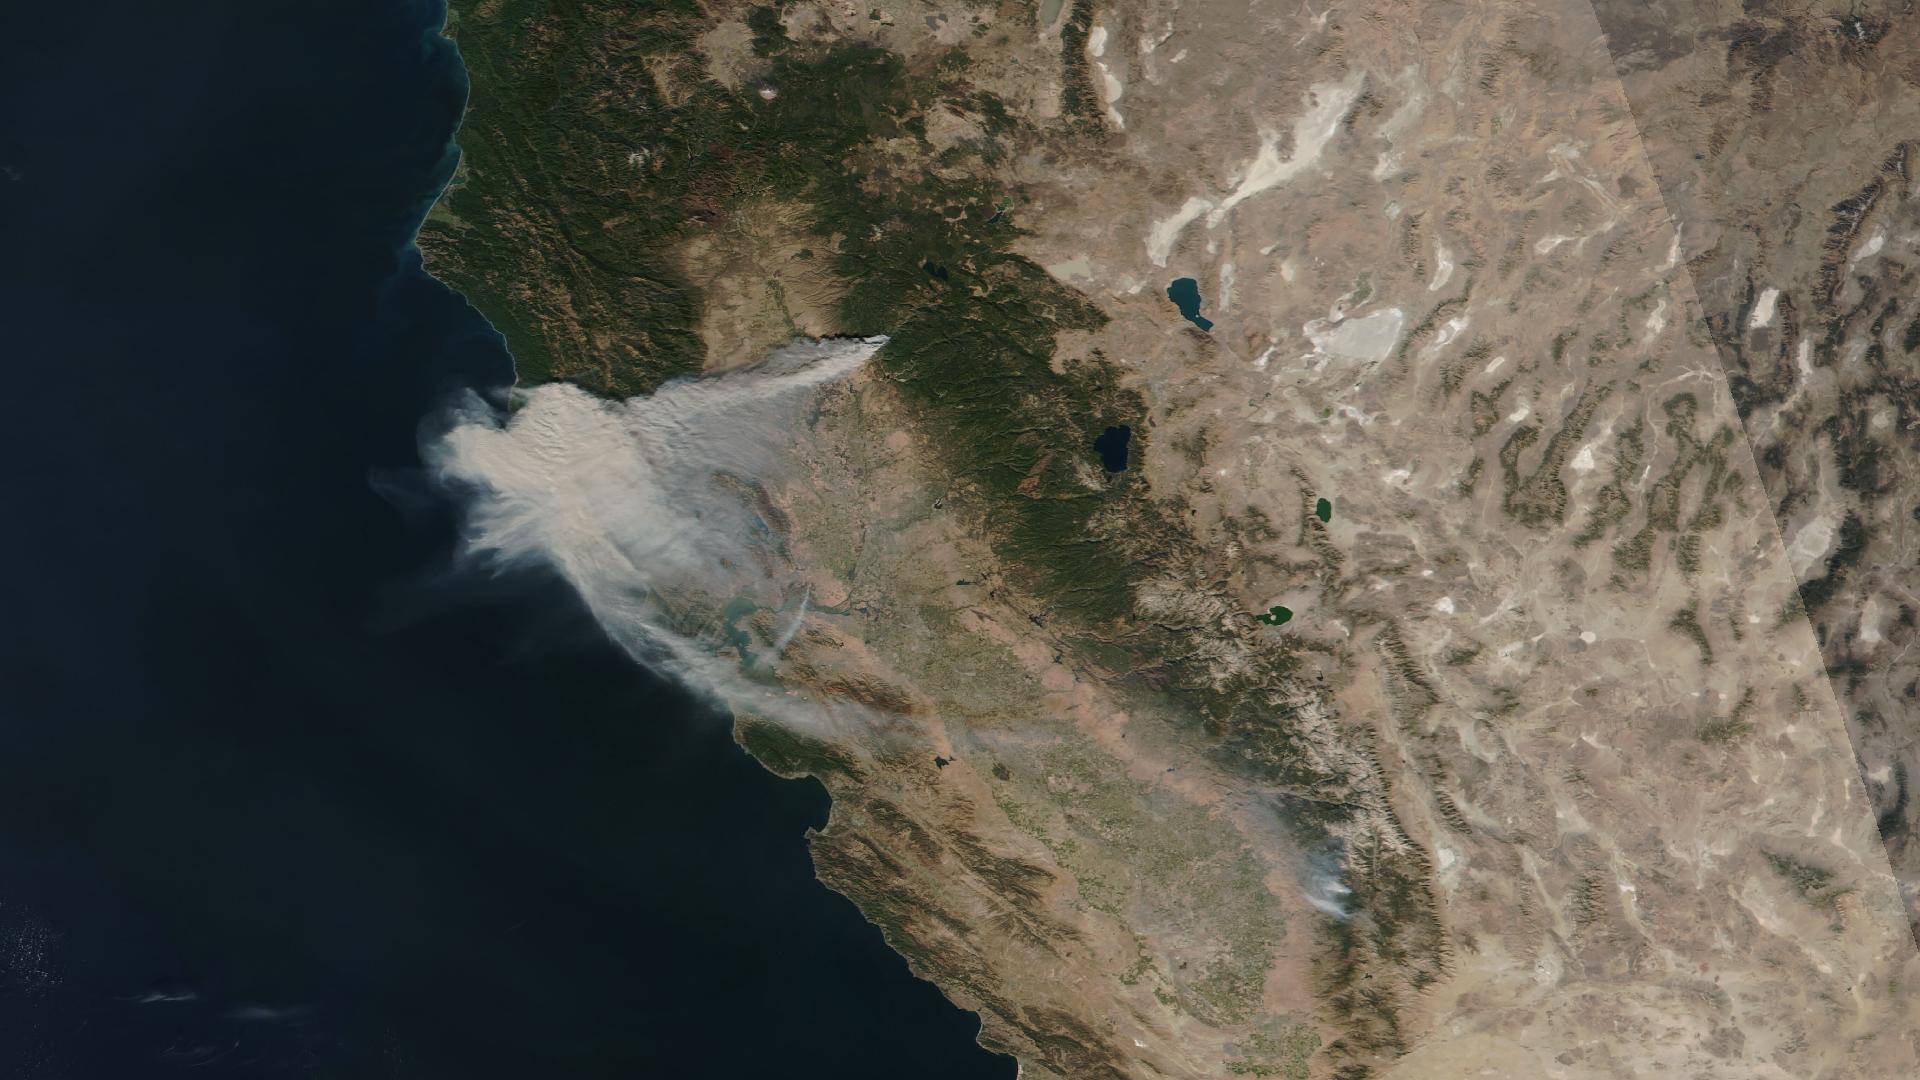
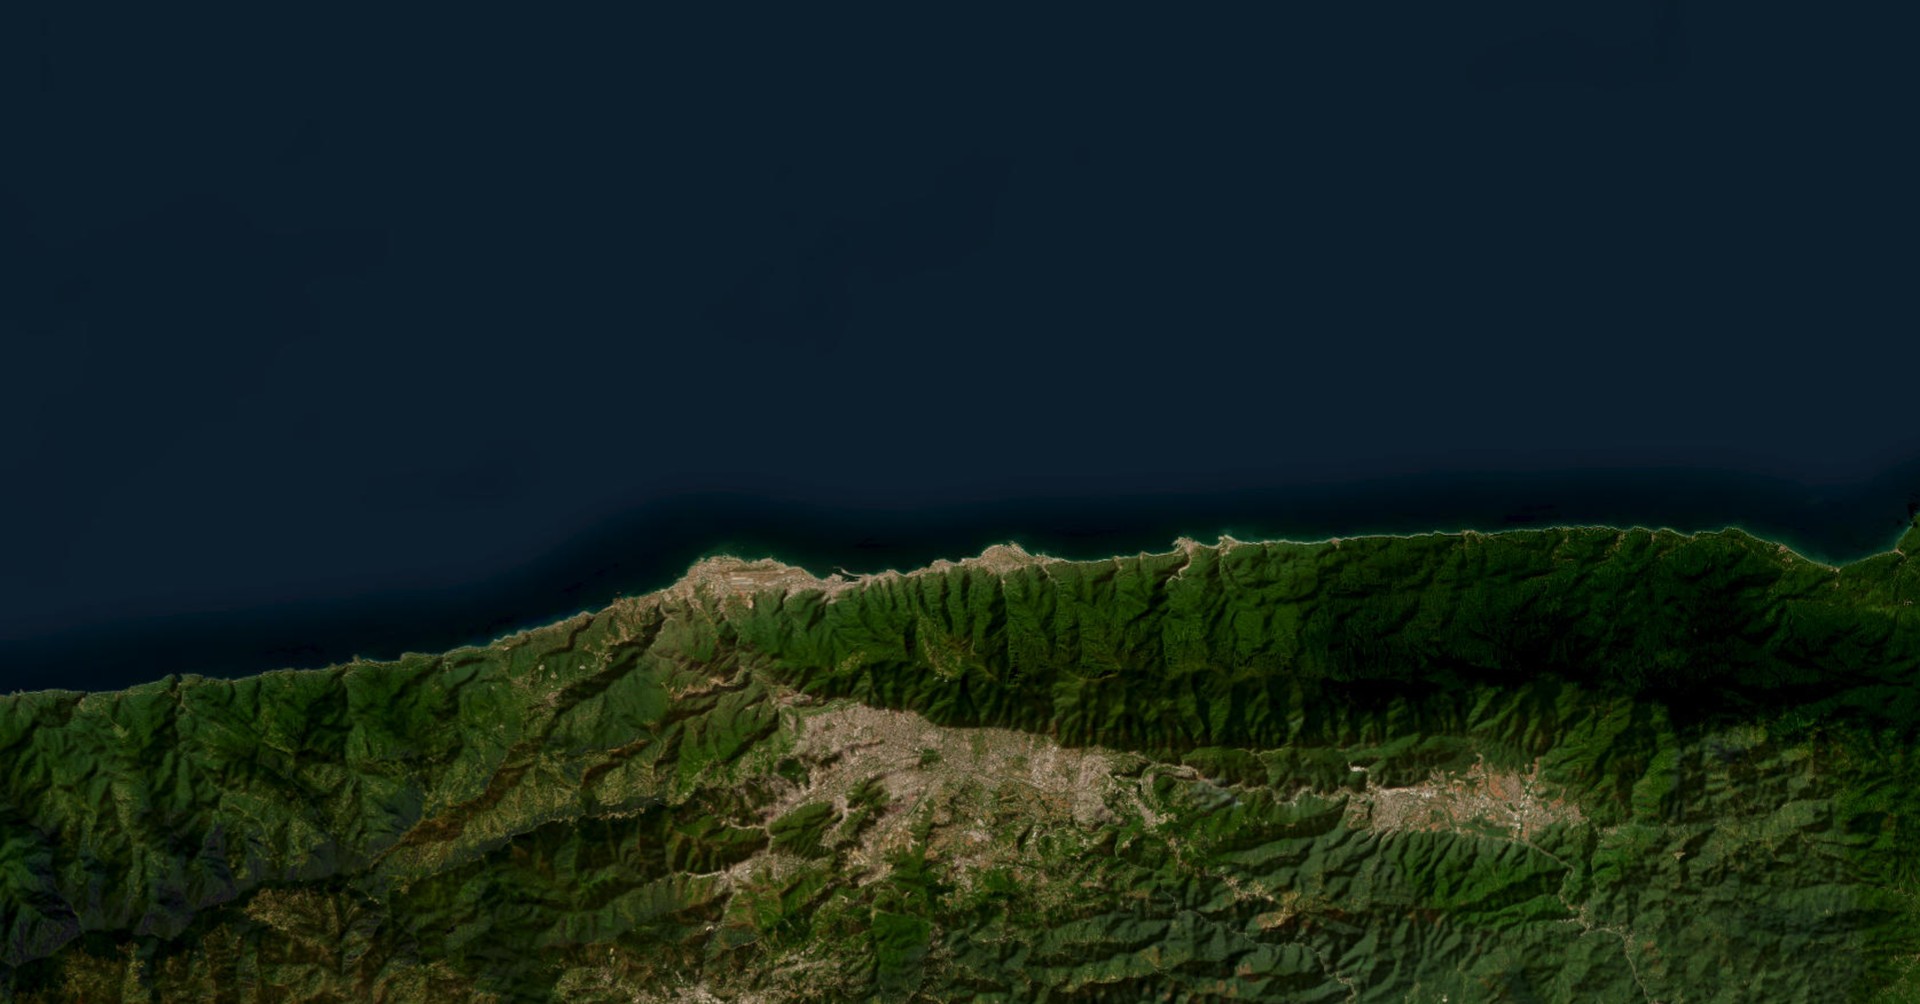
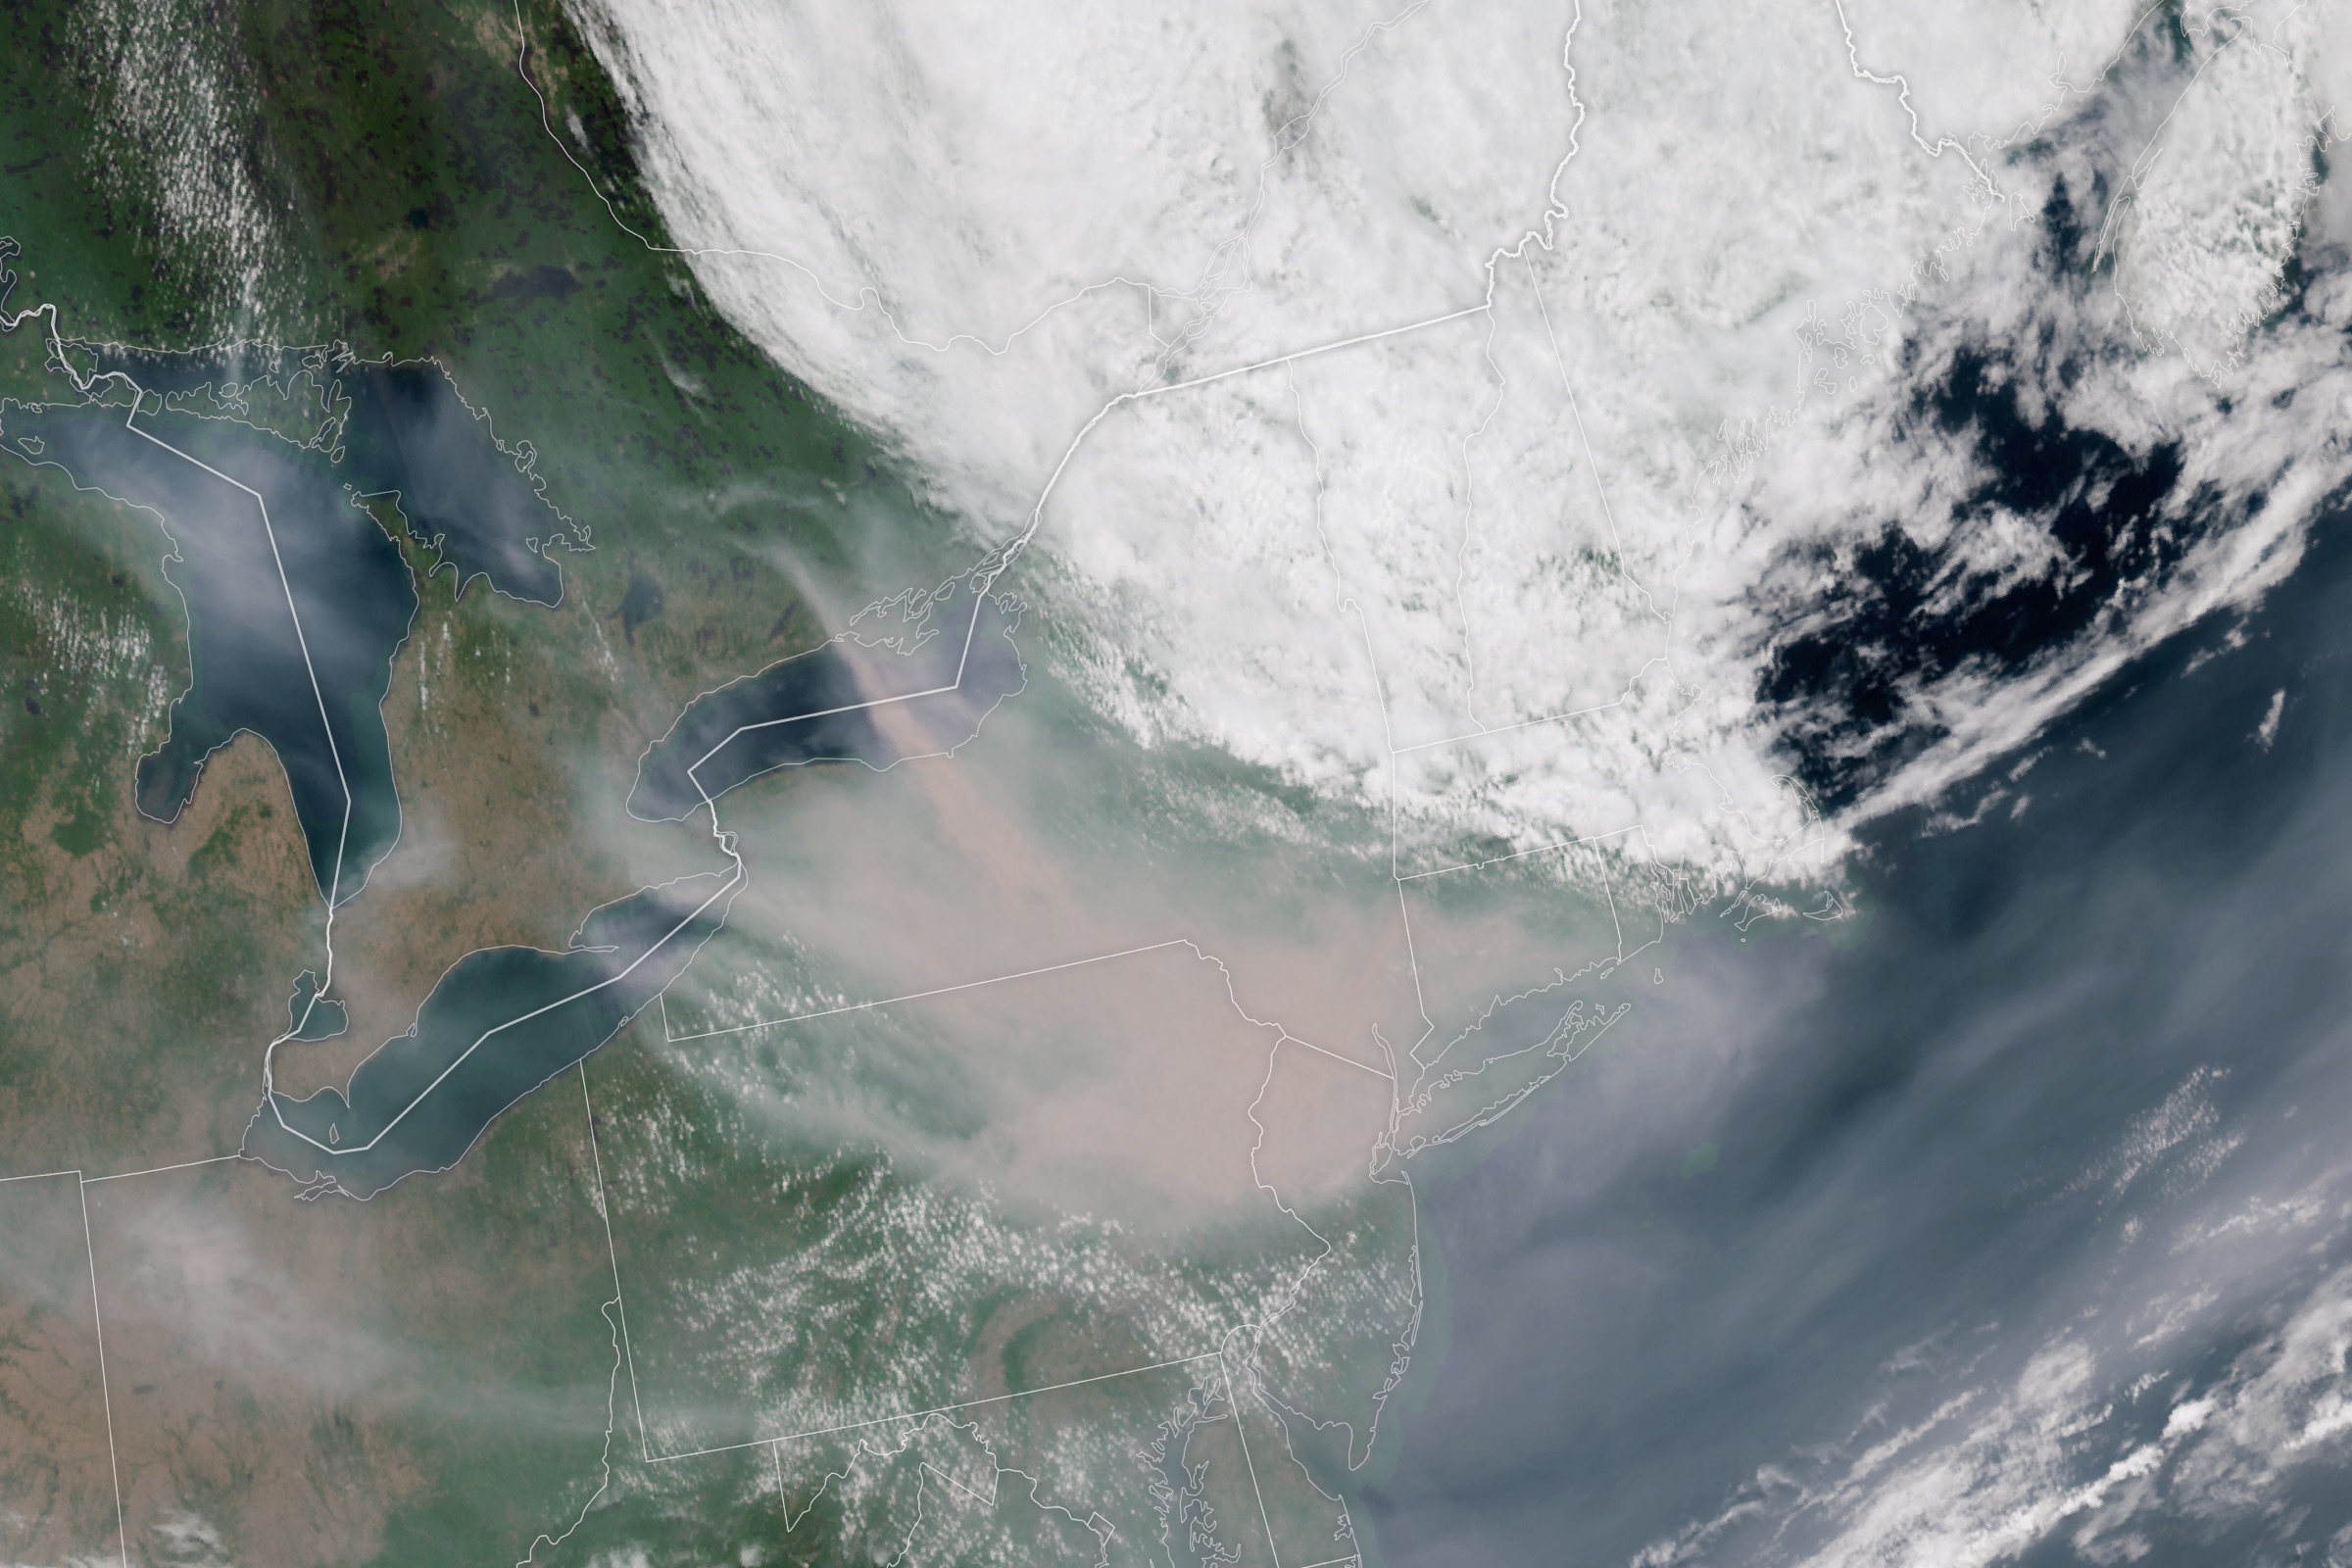
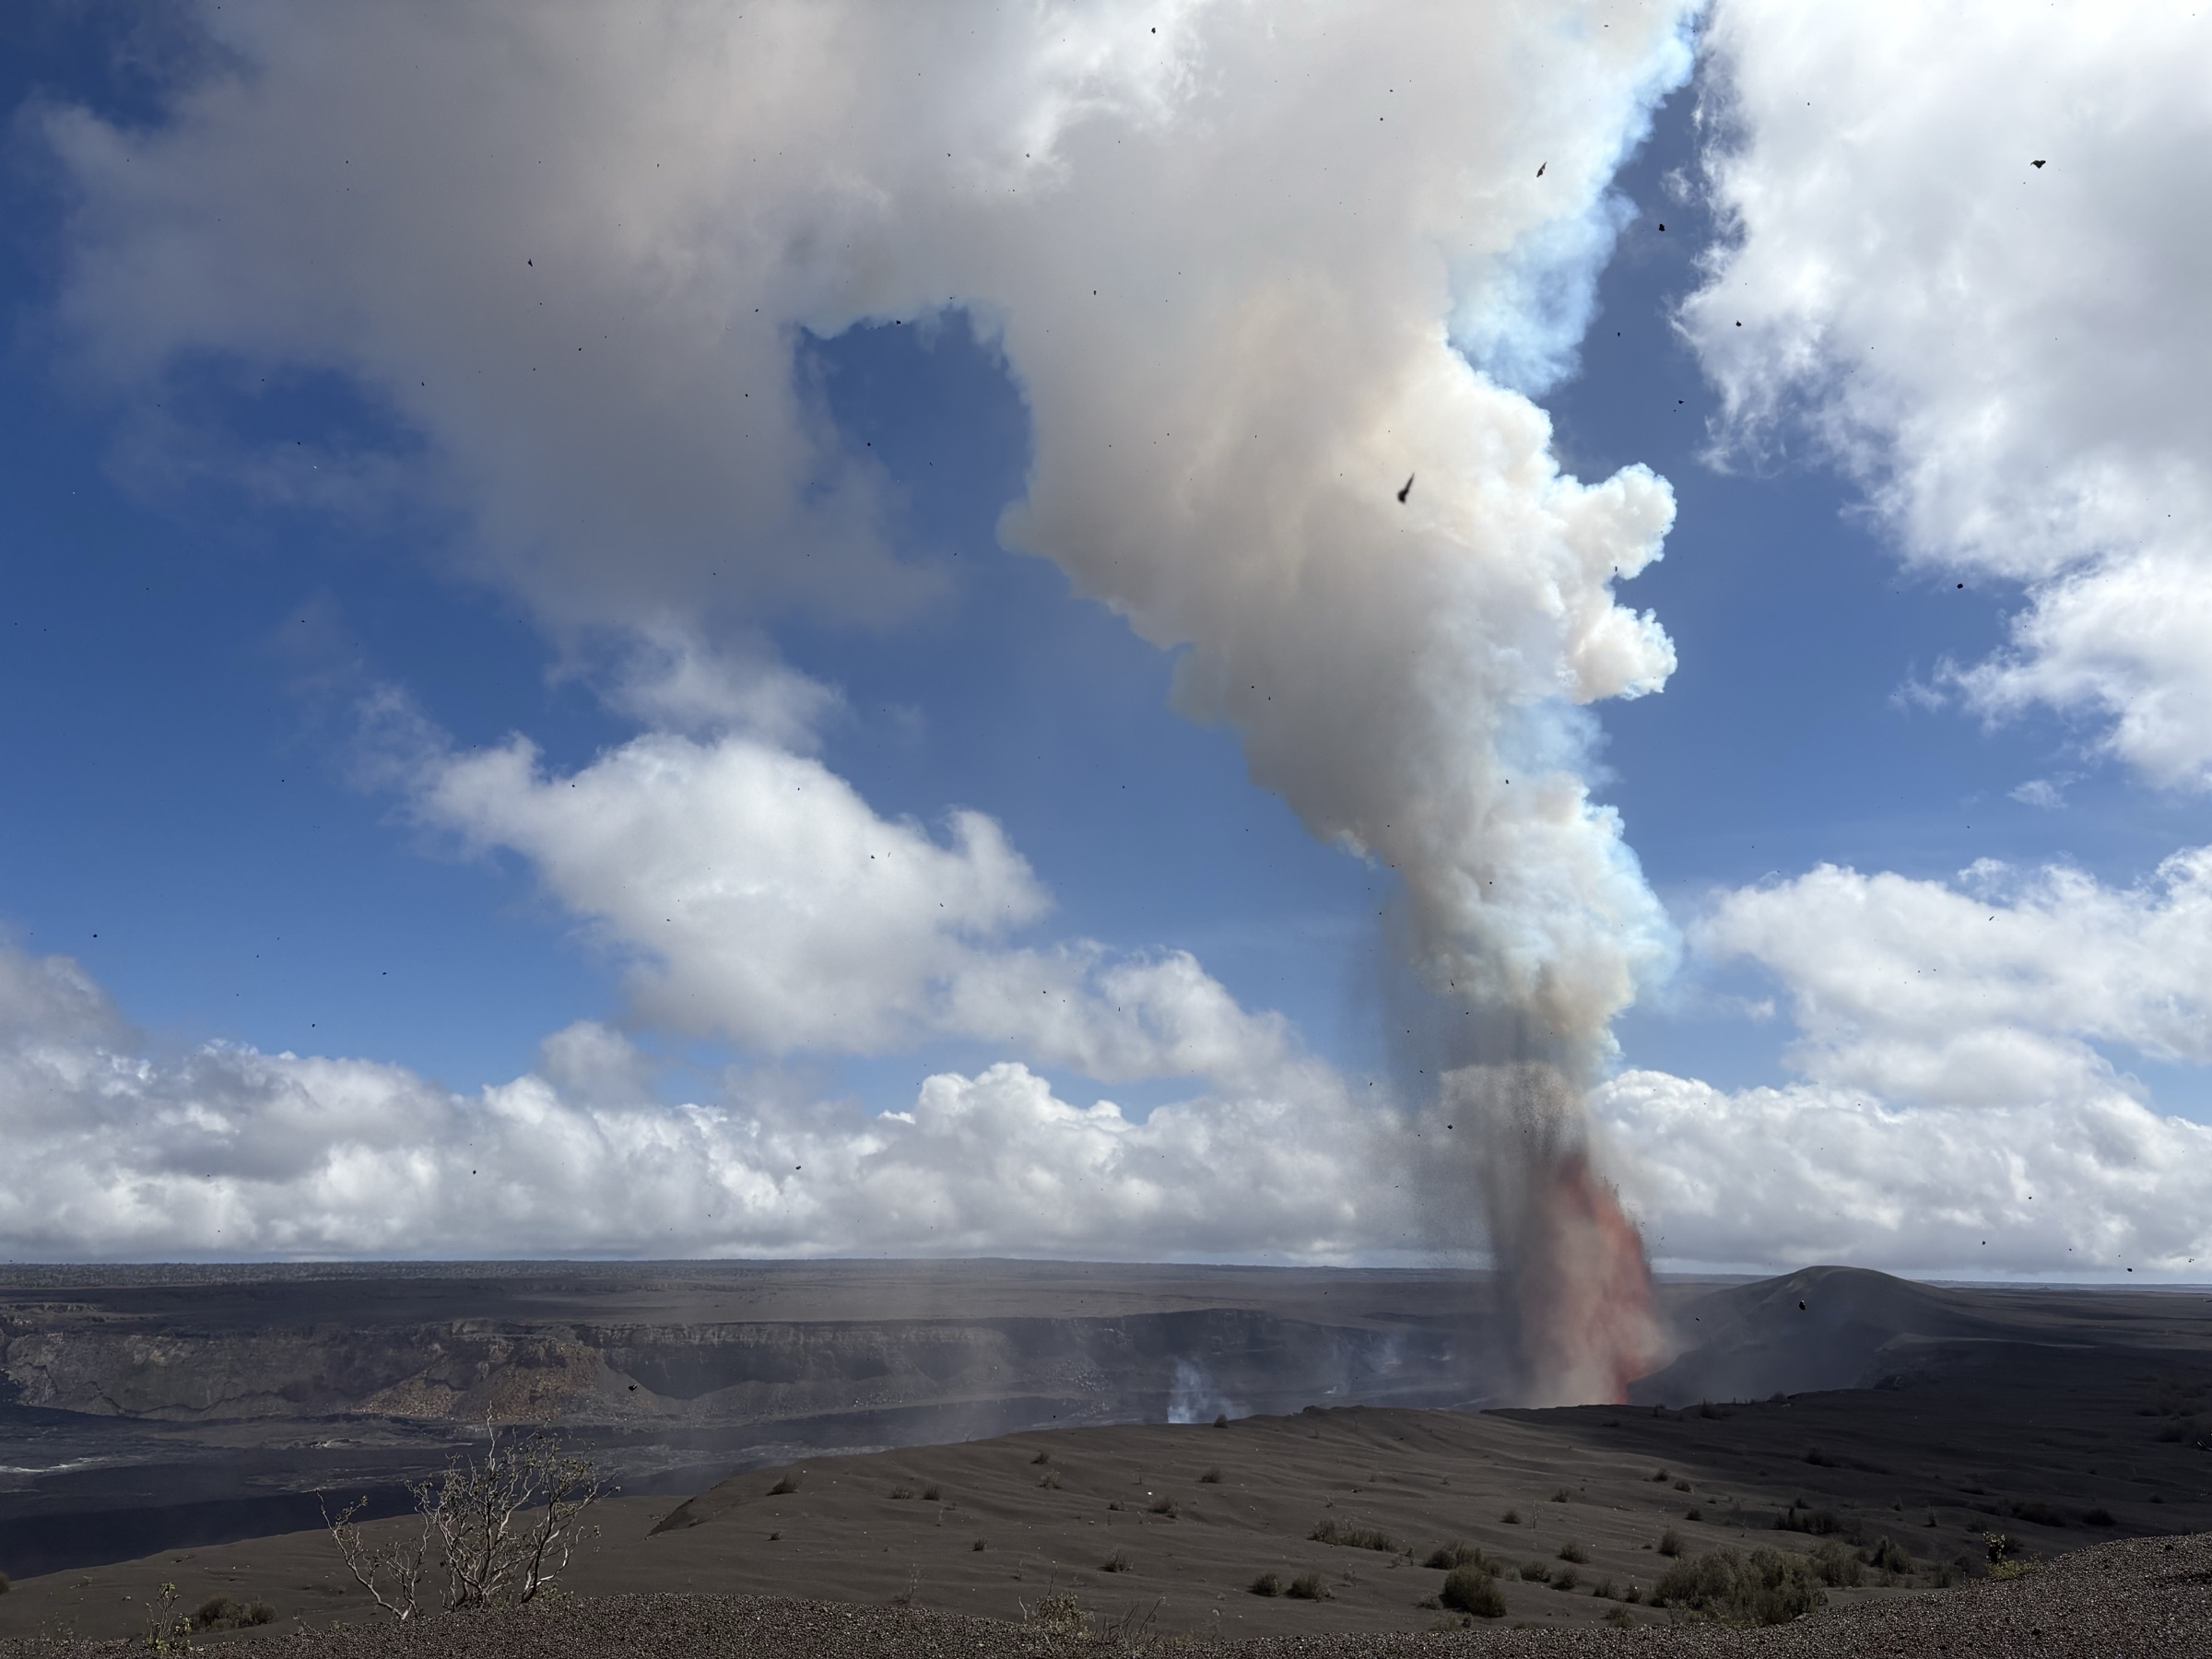
The observed board did not pause for anyone's forecasts. Wildfire remained 78% of all records — 2,337, split 393 warning-level incidents against 1,918 advisory-tier satellite detections, the vocabulary we committed to last window. The southern-Africa fire belt we profiled then is still burning: Angola (298 in-window ignitions) and the DRC (234) again led every country on Earth — ahead of the United States' 184 — with Mozambique, Indonesia and continuing conflict-zone fires in Ukraine and Russia filling out the top tier. Twenty volcanoes logged activity records from Etna to Fuego to Kanlaon. Two M7-class earthquake responses stayed open — the M7.5 near Yumare, Venezuela and the M7.4 at San José del Palmar, Colombia — alongside the continuing Rasuwa–Trishuli glacial-outburst flood response in Nepal, whose response footprint still counts 43,500 people. Health monitoring carried ten biomedical events — cholera across four African countries, dengue across three Pacific and South Asian territories among them.
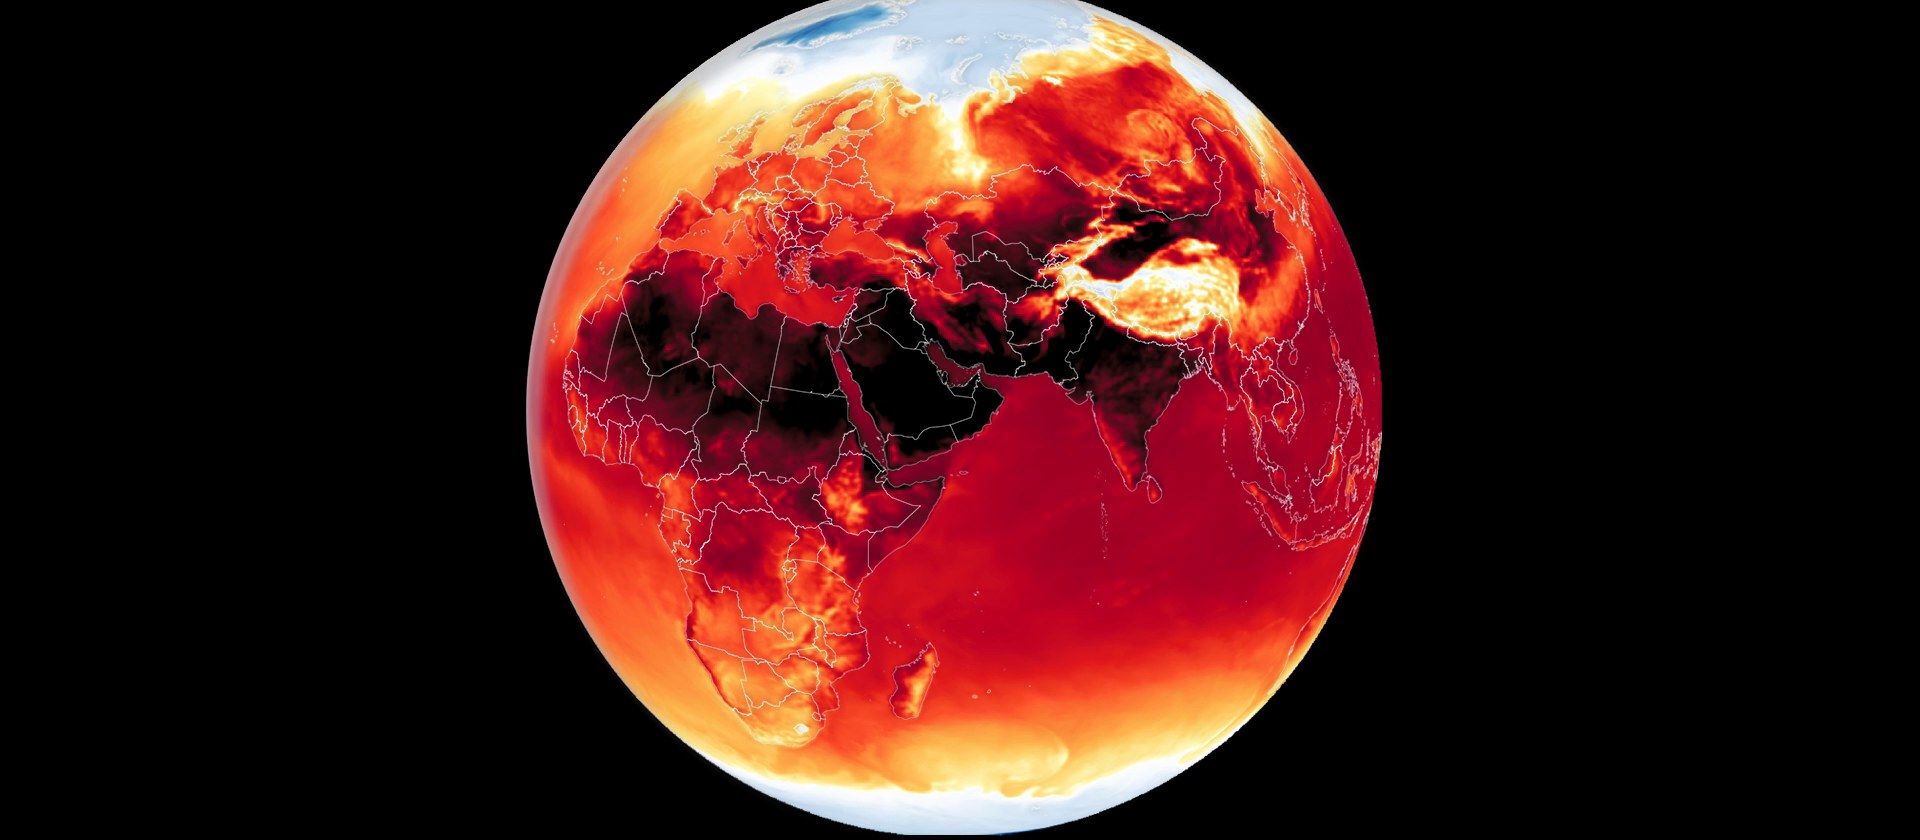
The filtered layer adds forward context the counts above don't: heat warnings across Spain, Portugal's Madeira, and the central and southern United States suggest late-season heat has one more act. Eighteen drought advisories, all filtered as forecasts rather than events, round out the quiet end of the board.
Hold the two tiers side by side and the lesson writes itself. Brazil shows what the alert tier does at its best: eleven days of continuous, footprint-defined warning coverage, sharp enough to move a state government into one room before anything hit. The US shows what the alert tier cannot do alone: nine warnings whose ground truth arrived days later, one survey at a time. And the Mekong shows the bridge: alerts anchored in observed upstream reality, degrading gracefully from measurement to forecast as the water moves.
Alerts move institutions; observations settle accounts. A complete intelligence picture needs both, joined at the footprint — knowing where the product was drawn, what the sensors saw, and what sat inside each. That is the entire argument for event-level hazard intelligence, and this window made it from three continents at once.
Was Brazil actually hit by severe storms in September 2026? Brazil's National Institute of Meteorology had severe-thunderstorm or heavy-rain products in force every day from September 4 to 14, escalating to warning tier over the São Paulo–Minas Gerais–Rio corridor from September 10, and local media reported supercell storms sweeping Paraná and São Paulo states around September 10–11. Ground-verified impact reporting sits outside this dataset's observed layer, so this brief documents the alert siege and the institutional response — including São Paulo's crisis cabinet — rather than claiming damage outcomes it cannot verify.
What is the difference between a weather alert and an observed event? An alert is an issued forecast product — an advisory, watch, or warning with a defined footprint and an estimated population inside it. An observed event is something documented as having happened: a satellite heat detection, a measured earthquake, a surveyed tornado track, a damage report. Both matter, but they answer different questions: alerts drive preparation and mobilization; observations settle what actually occurred, where, and to whom.
How many people were affected by Brazil's September 2026 storms? That is precisely the number an alert product cannot give you. The figures in this brief — up to 124 million people under a single day's advisory, 91.4 million under the September 11 warning — are estimates of the population inside each product's footprint, not counts of people harmed or disrupted. Determining actual impact requires observed, event-level data: what fell, where it fell, and which locations sat inside each verified hazard footprint.
Did any tornadoes touch down in the United States in early September 2026? Yes. Behind the window's nine NWS tornado warnings, National Weather Service survey teams confirmed touchdowns including near Bradford Airport in McKean County, Pennsylvania (September 9), in Guernsey County, Ohio (the same night's storms), in Stevens County, Minnesota, and an EF-0 along Route 10 in Surry County, Virginia (September 12), per local reporting. A parallel confirmed cluster hit southern Manitoba and southwestern Ontario, including an EF-1 near Monkton, Ontario.
Why do tornado confirmations arrive days after the warnings? Tornado warnings are issued in real time from radar signatures and spotter reports, typically lasting under an hour. Confirmation that a tornado actually touched down — and its rating — comes from ground surveys of the damage path, which take days. That lag between the alert tier and the observed tier is structural, and it is exactly why post-event intelligence is a distinct product from warning feeds.














-min.png)


.png)


.png)




Decision-ready intelligence for understanding what's happening, what is impacted, and what to do next. Global hazard, severe weather, catastrophe, and physical risk intelligence trusted by governments, enterprises, insurers, humanitarian organizations, and technology platforms worldwide.
Request DemoContact Us

