


Why Insurers Need Better Event-Level Intelligence for Hail, Tornadoes and Severe Wind
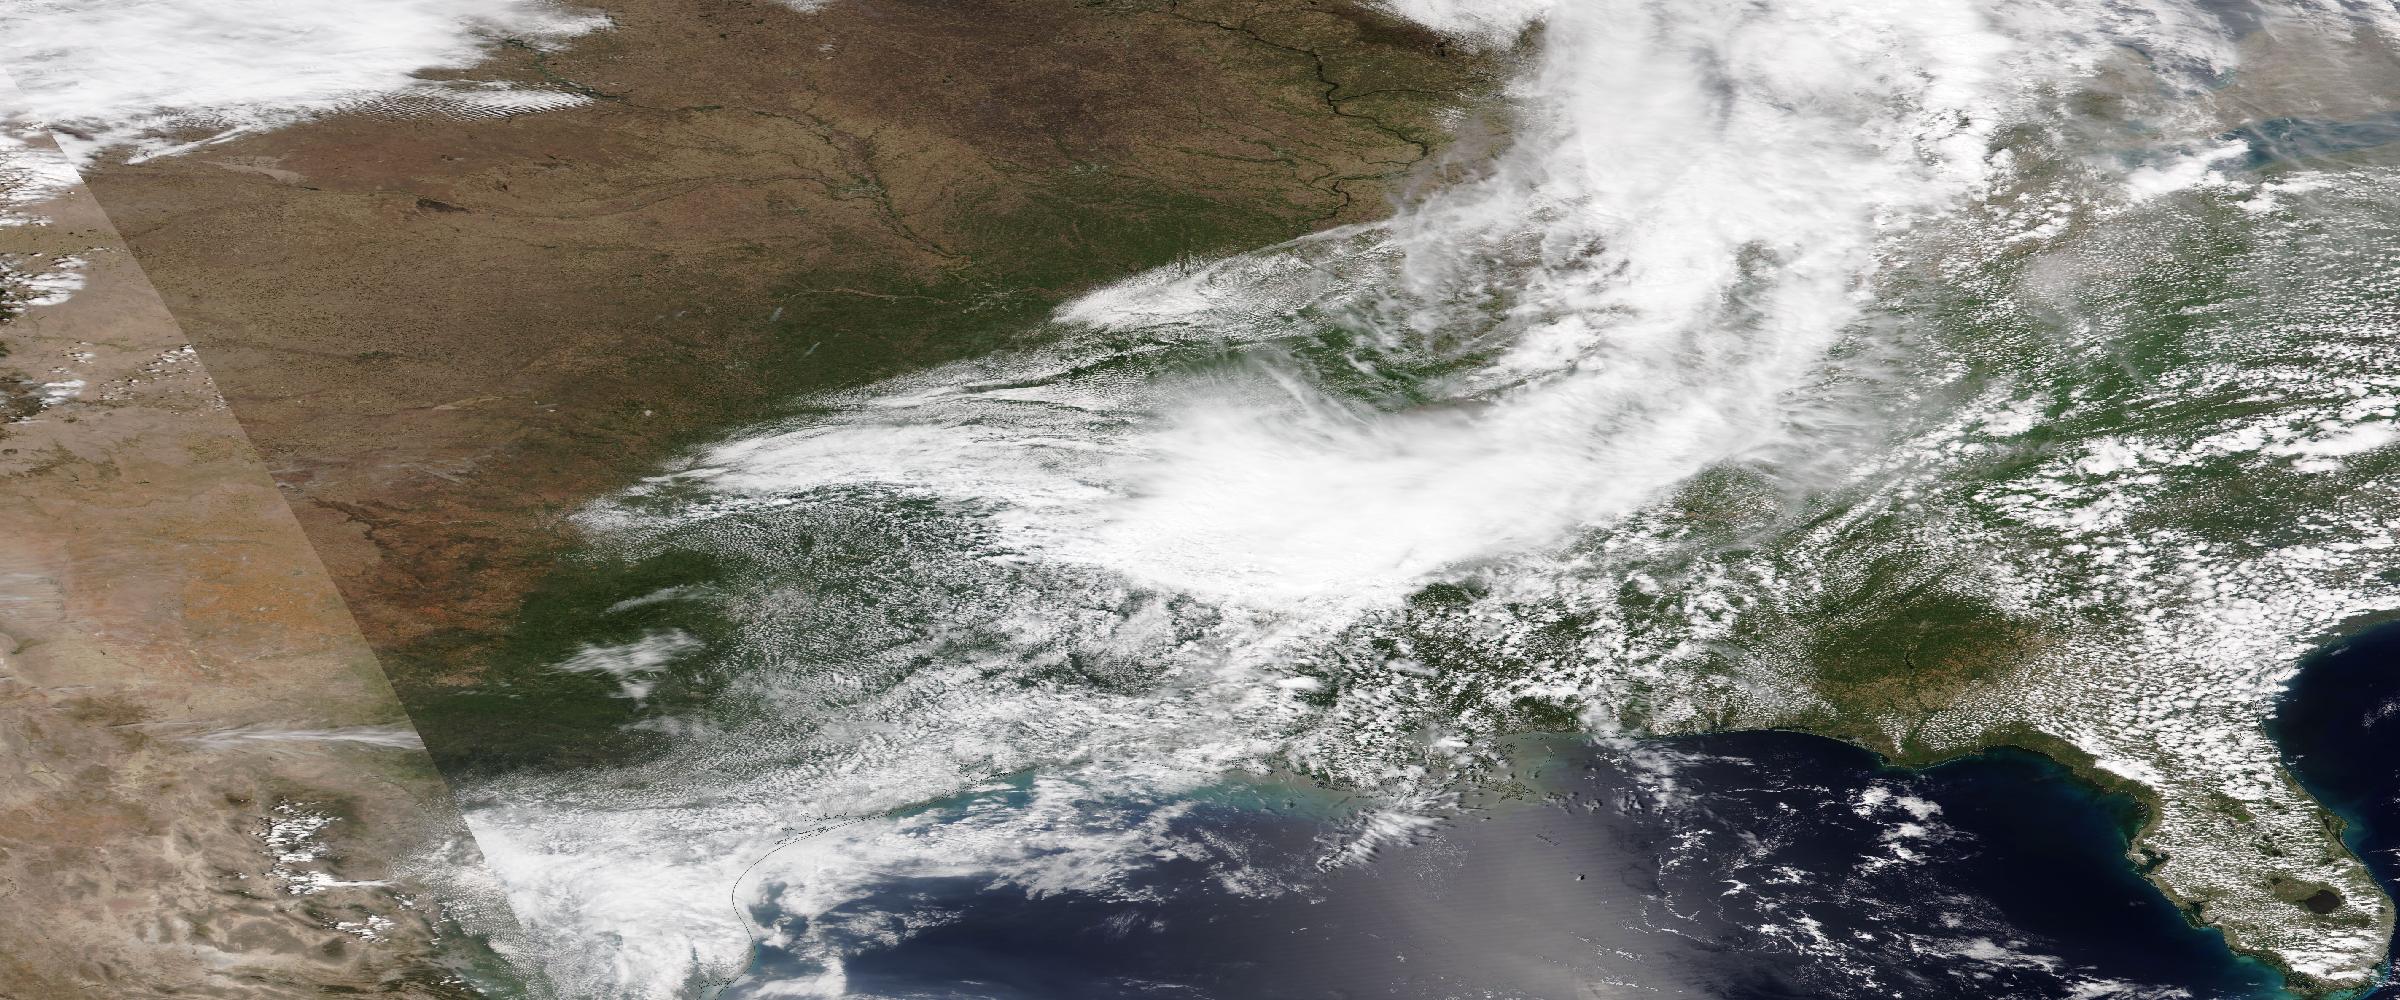
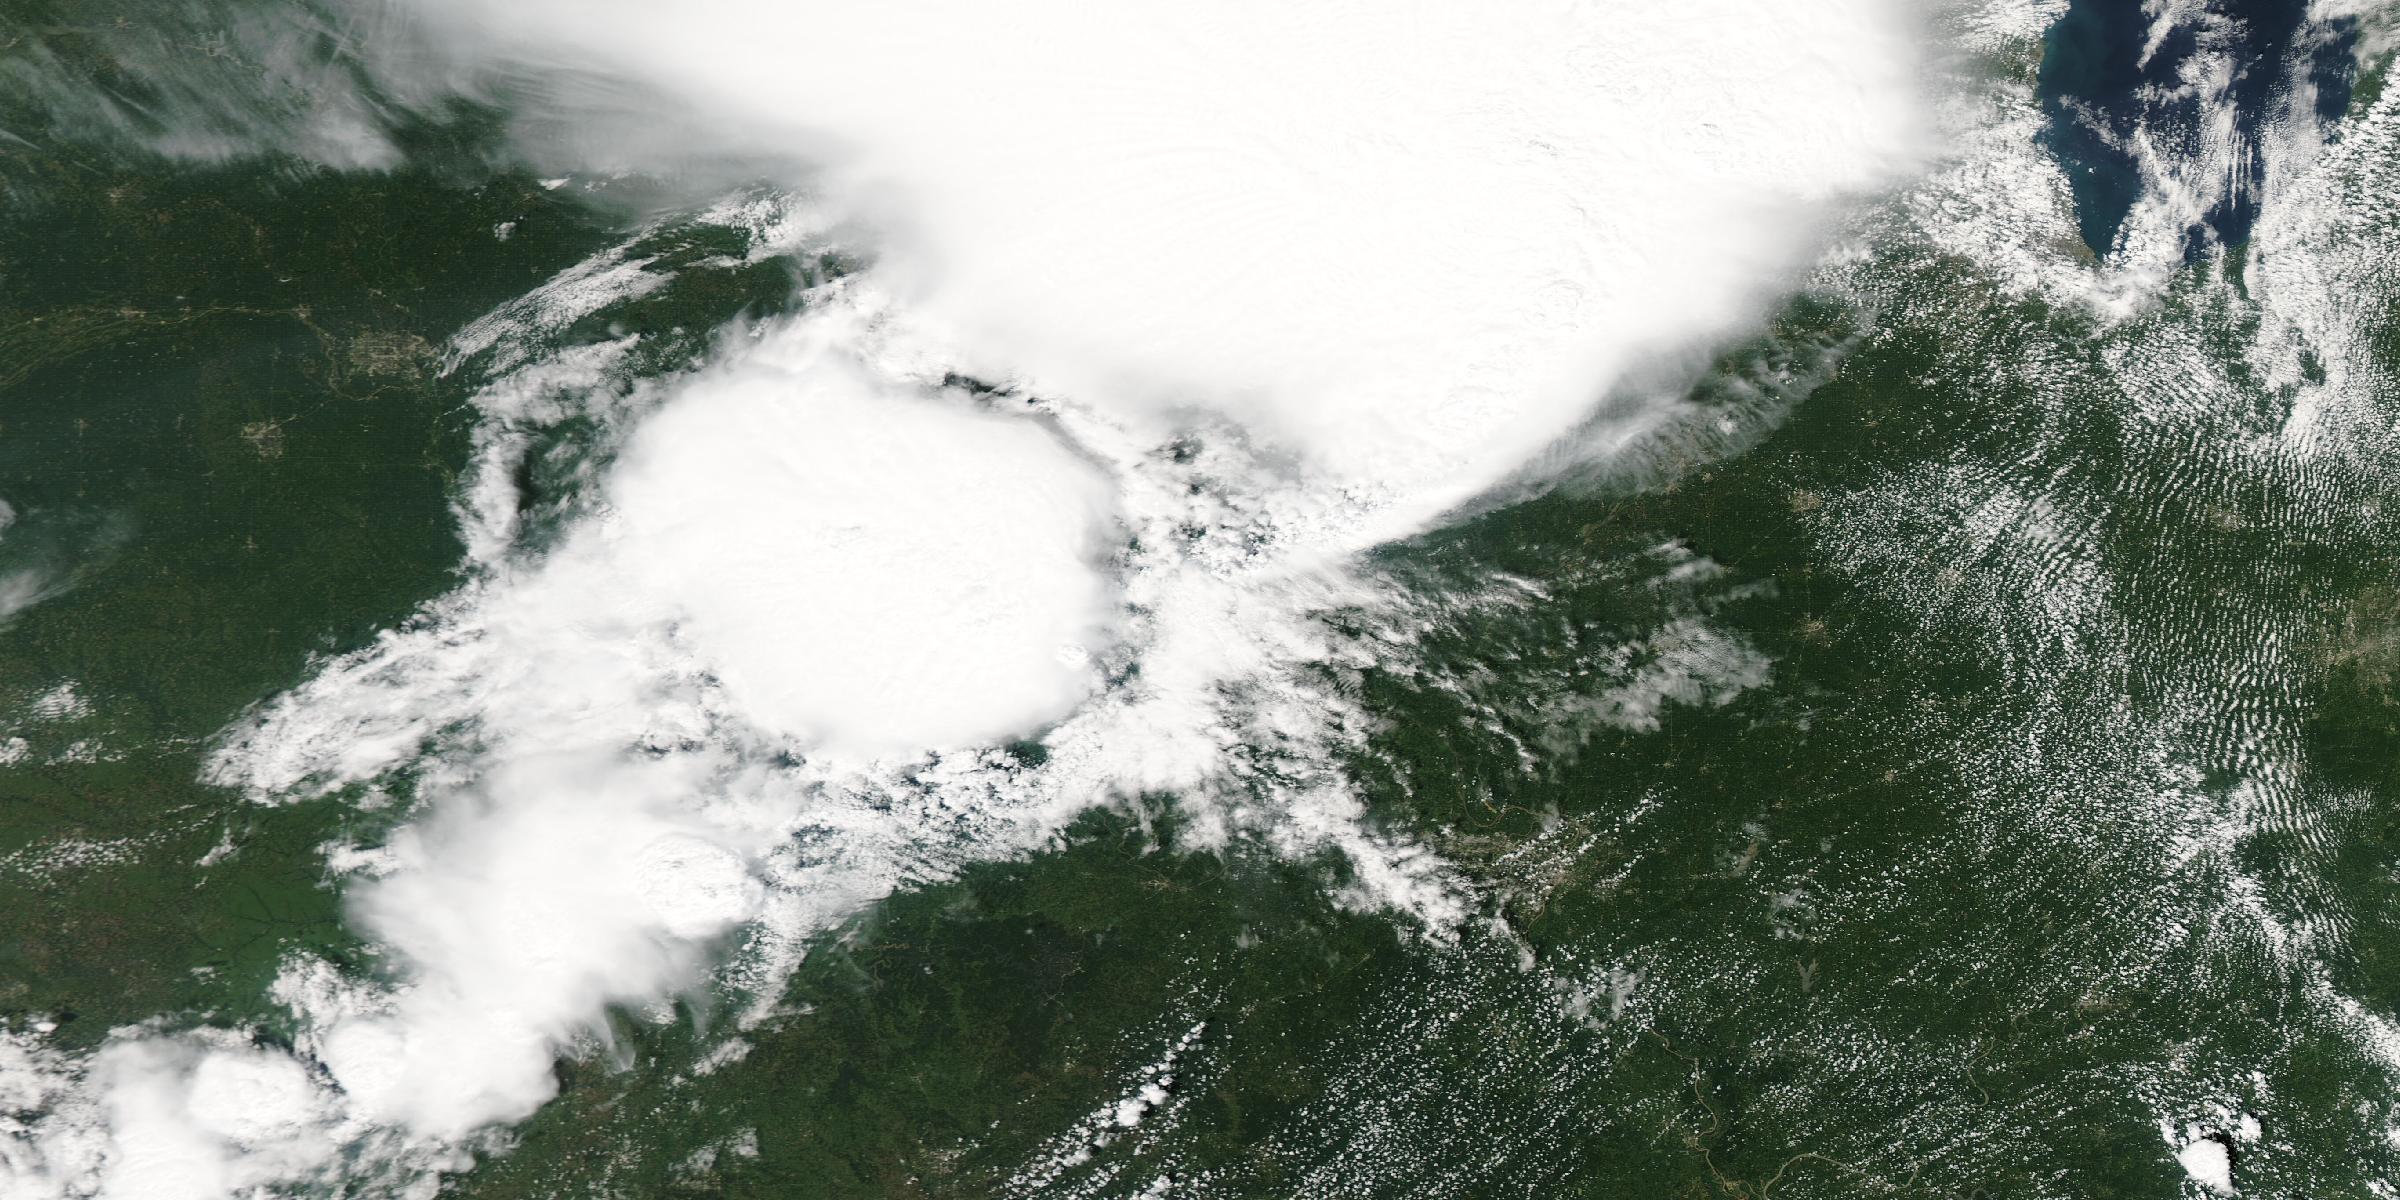
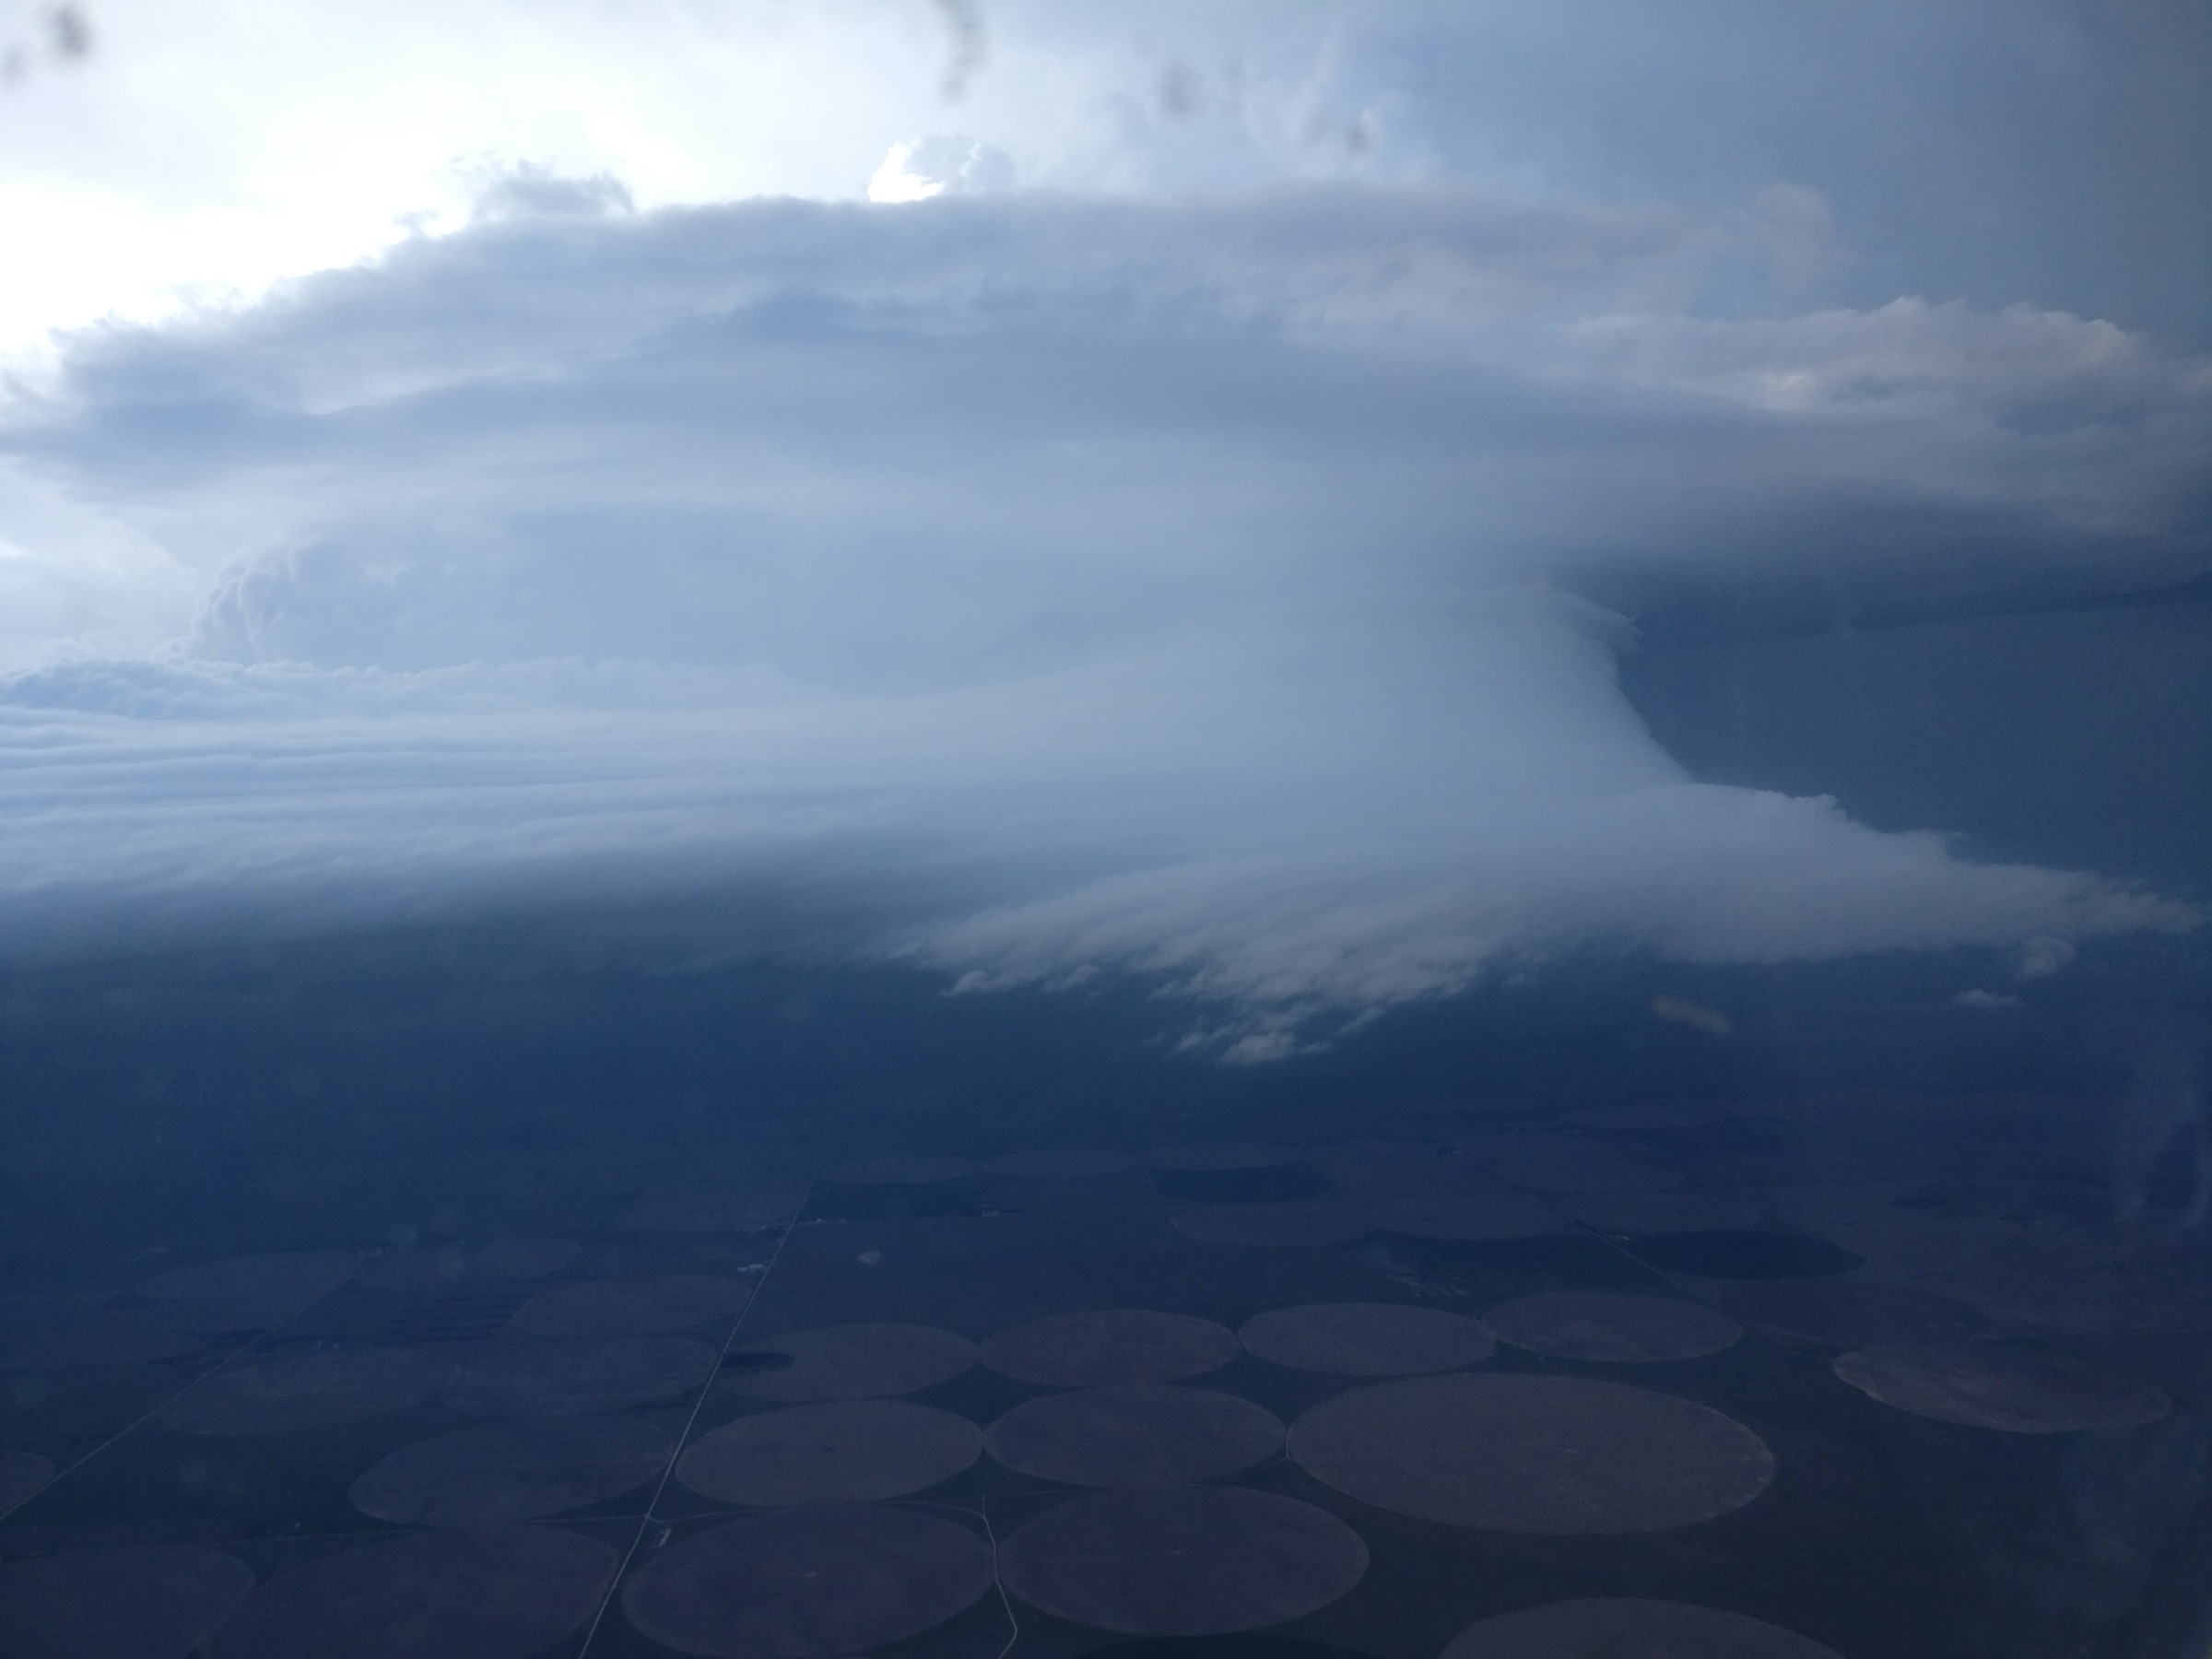
Severe convective storms have become one of the insurance industry's most persistent catastrophe challenges. Unlike a major hurricane or earthquake, a severe convective storm event can be difficult to define. It may not have a single, clearly bounded footprint. It can produce multiple hazards at the same time. And the most damaging conditions can vary dramatically across relatively short distances.
A single storm system can generate:
Hail → Tornadoes → Damaging Wind → Extreme Rainfall → Flash Flooding
For insurers, understanding the resulting loss potential requires much more than knowing that a storm passed through a particular state or county. It requires knowing what happened, where it happened, when it happened, and which insured locations were exposed to each hazard. That is where the industry's severe convective storm data problem begins…
One of the fundamental challenges is that "severe convective storm" describes a broad category of weather rather than a single hazard. A single convective system can produce several distinct perils.
Hail
Hail can create widespread property and vehicle damage, with severity varying substantially across the storm footprint.
Tornadoes
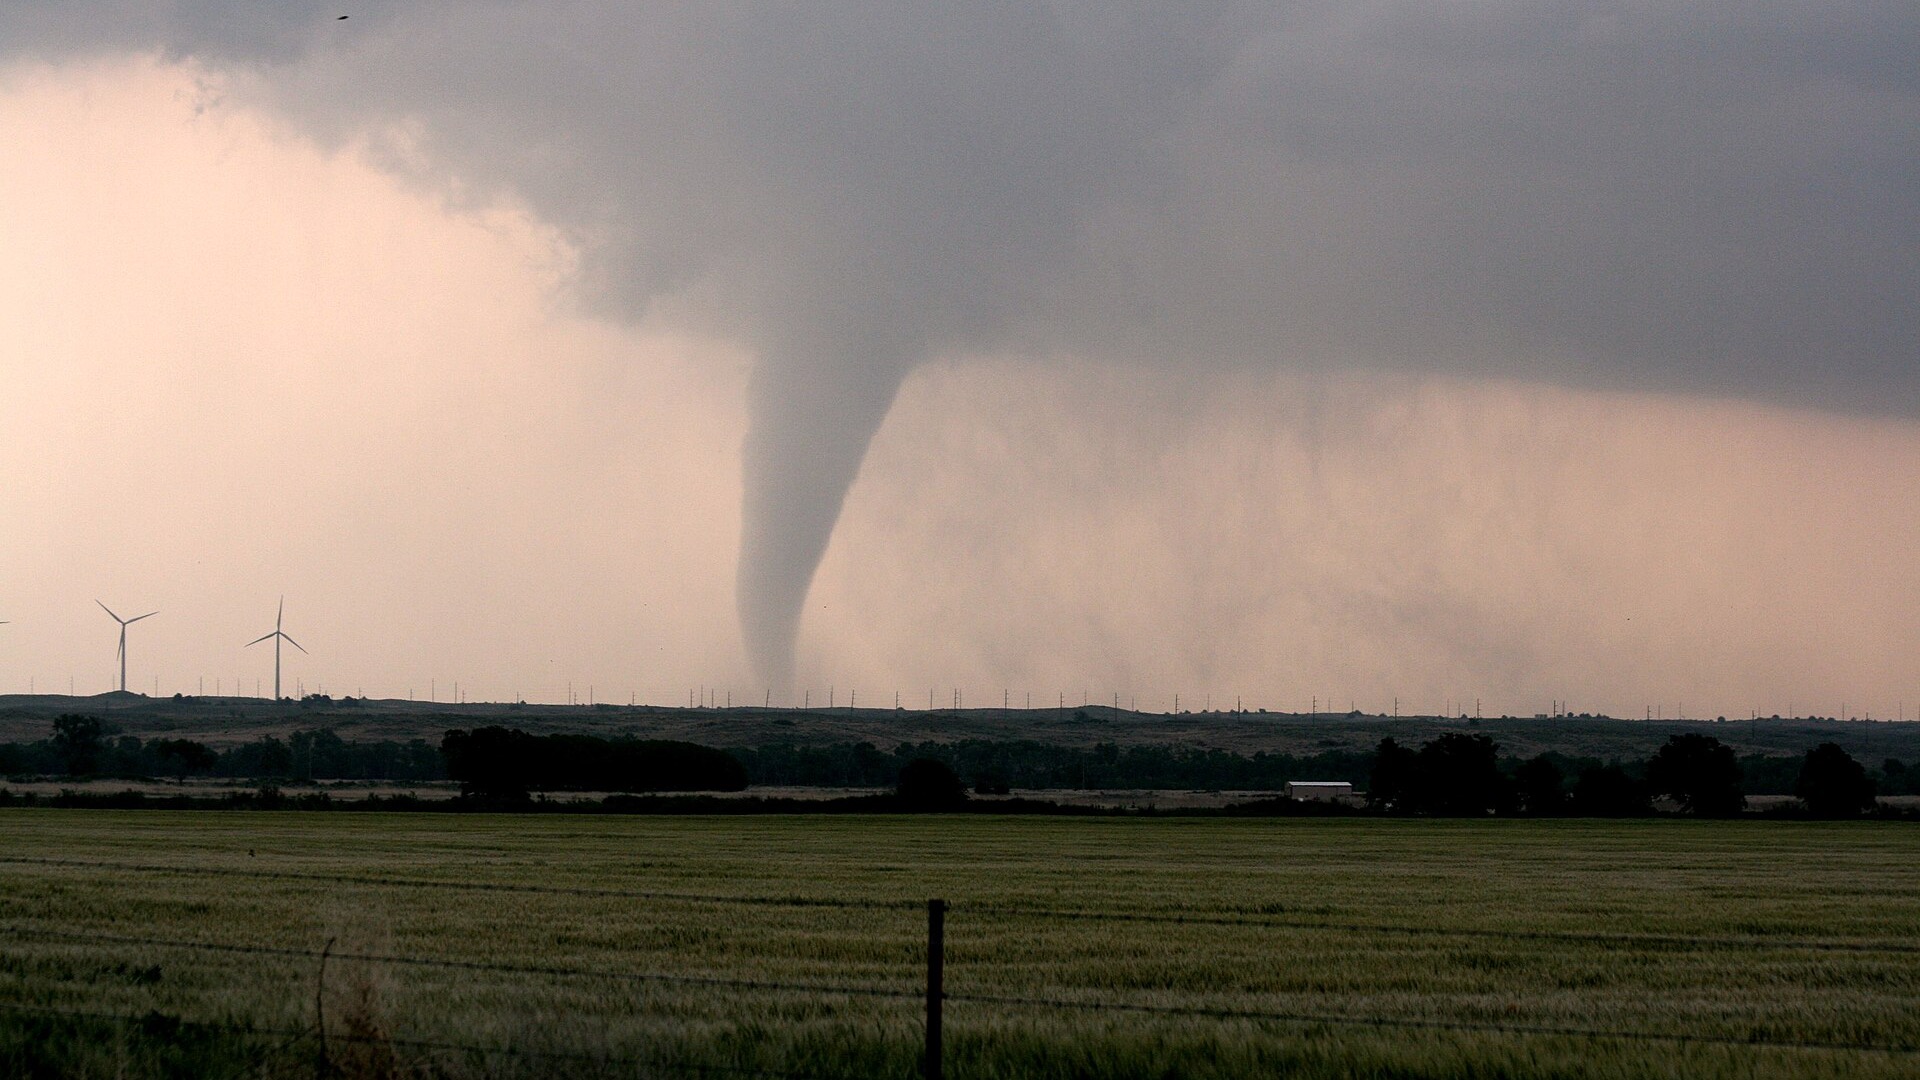
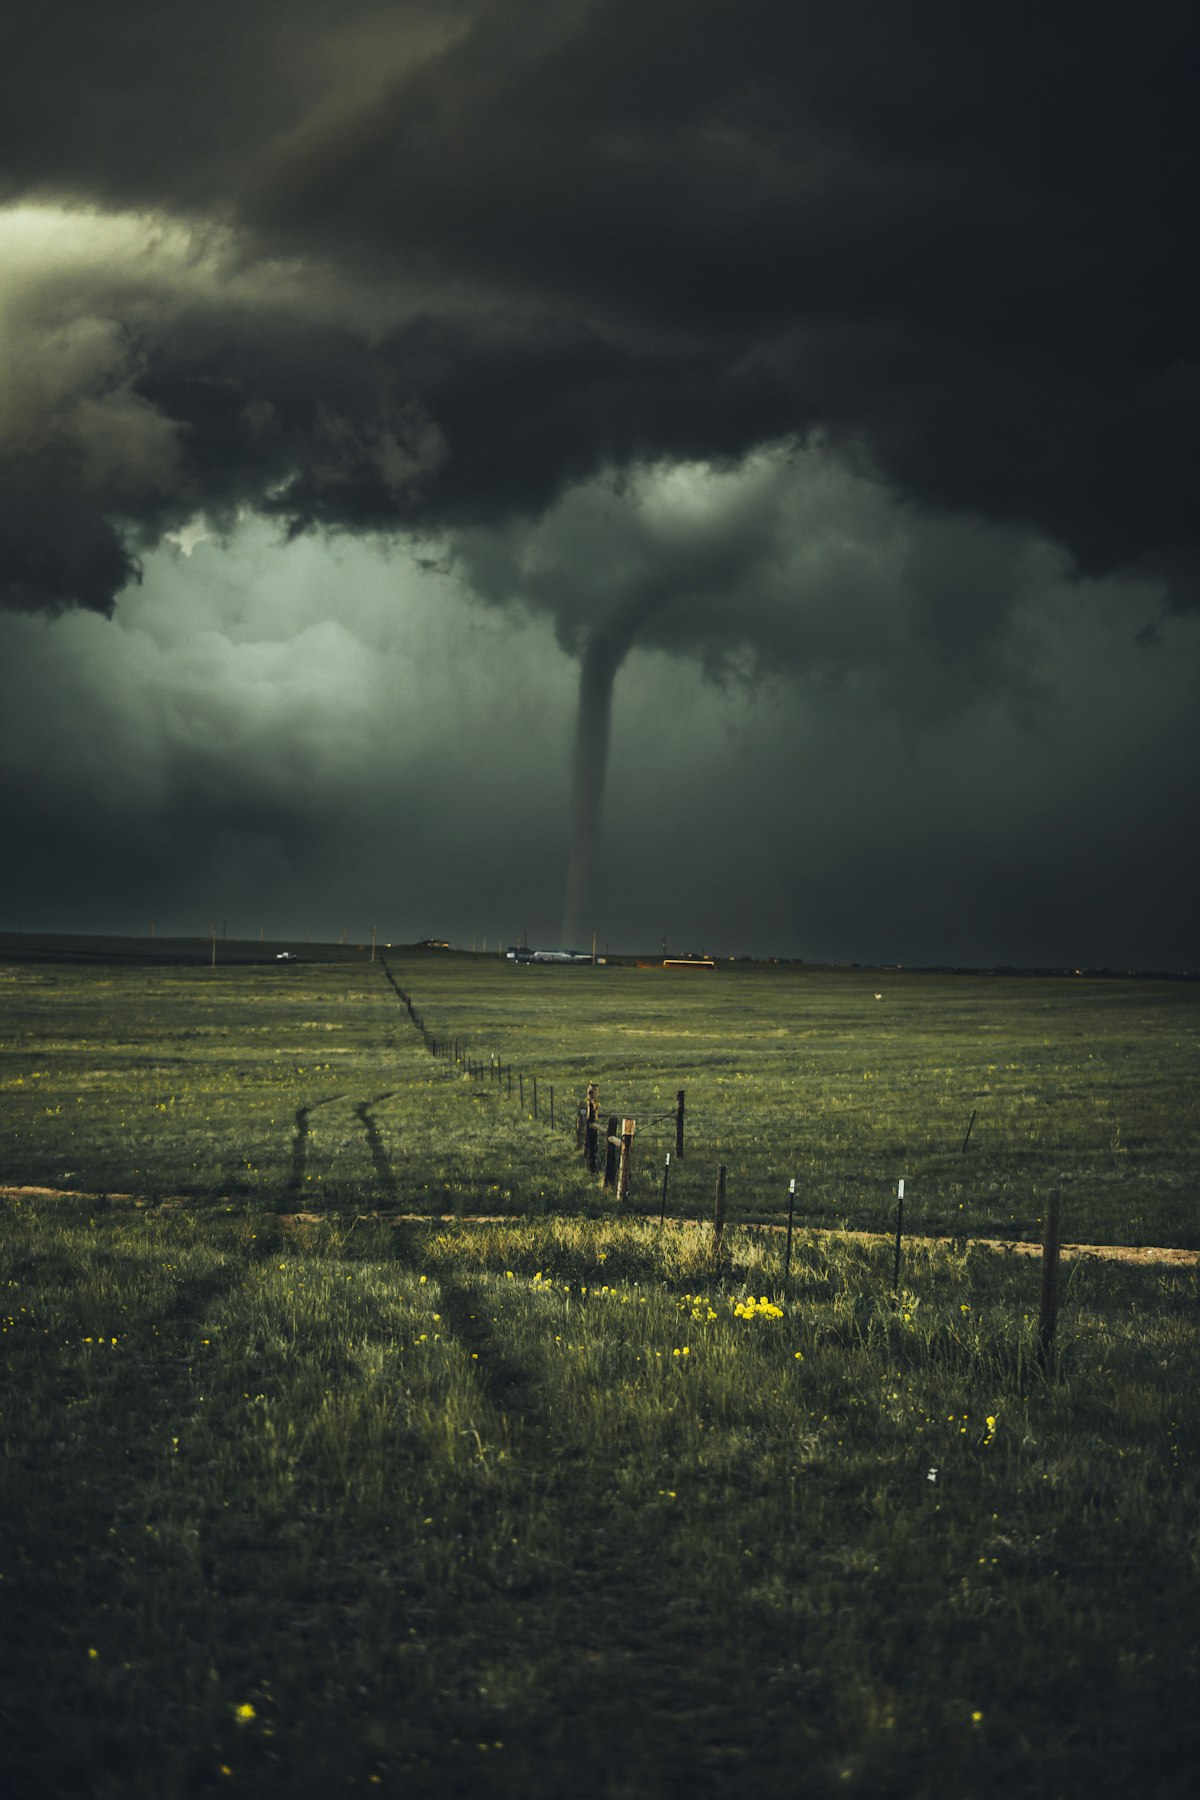
Tornadoes can create highly concentrated areas of extreme damage along relatively narrow tracks.
Severe Wind
Straight-line and other damaging winds can affect much larger areas than tornado tracks.
Heavy Rainfall
Extreme precipitation can produce flash flooding and property damage well beyond the most severe portion of the storm.
These hazards may occur independently or as part of the same weather system. For insurance purposes, they cannot always be treated as interchangeable.
A common way to represent a catastrophe is through an event polygon. But severe convective storms challenge that approach.
Consider a multi-state storm system. Within the broader system:
There may be no single polygon that accurately represents the entire event. Instead, there may be multiple overlapping hazard footprints evolving through time.
For insurers, that distinction matters. A policyholder may be exposed to hail but not tornadoes. Another may be exposed to damaging wind. Another may experience flooding from the same storm system.
Treating all three locations as simply "affected by the storm" loses valuable information.
One of the biggest problems is not necessarily the absence of data. It is the fragmentation of data. Severe convective storm information can come from many different sources and systems:
Each source may describe a different part of the event. One source may tell you that a tornado occurred. Another may provide a radar-derived hail footprint. Another may provide severe weather warnings. Another may contain observed damage. Another may provide modeled estimates.
The challenge for insurers is bringing these pieces together into a coherent event record.
This distinction is particularly important.
A weather report might tell an insurer:
Hail was reported in this location.
But a report is a point. The actual hail-producing storm may have affected a much larger area.
Similarly, a tornado report identifies an observation or reported occurrence. It does not necessarily describe the full spatial and temporal evolution of the storm system that produced it.
For portfolio analysis, point reports alone may not be sufficient.
Insurers need to understand the hazard footprint.
Weather radar provides an important source of information about severe convective storms. Radar can help identify characteristics of storms and estimate where precipitation and potentially severe conditions occurred.
But raw radar data is not necessarily an insurance-ready event record.
Insurance organizations typically need information that is:
The challenge is transforming complex meteorological information into actionable catastrophe intelligence. That requires processing, classification, geospatial analysis, and event reconstruction.
Meteorologists may ask:
How did the storm develop?
Insurers may need to ask:
Which of our insured locations were exposed?
A meteorological system might contain thousands of observations and measurements. An insurer needs to translate those observations into decisions.
For example:
Storm detected
↓
Hazards identified
↓
Hail / tornado / wind footprints generated
↓
Event locations intersected with exposure
↓
Potentially affected policyholders identified
↓
Claims and response workflows prioritized
This is the bridge between weather data and insurance intelligence.
Every hazard in every storm, mapped to your portfolio
Reconstructed, verified historic catastrophes plus real-time monitoring across 30+ hazard types — delivered through APIs, GIS services, and dashboards your teams already use.
The challenge becomes even more significant at portfolio scale. Consider an insurer with hundreds of thousands of property locations.
A single storm may intersect:
And the same portfolio may experience dozens of significant storm events throughout the year. This creates cumulative exposure.
The insurer therefore needs to answer two different questions:
Event level
What did this storm do?
Portfolio level
What has the portfolio experienced across all storms?
Answering the second question requires standardized historical event data.
Historical data provides the foundation for understanding how frequently and severely a portfolio has been exposed to convective storms.
An insurer might want to know:
These questions are difficult to answer efficiently when historical storm information is fragmented across different datasets. They become much easier when severe weather is represented as structured, event-level intelligence.
One of the most valuable improvements insurers can make is establishing a common structure for representing severe weather events.
Instead of storing separate datasets for:
the insurer can create a connected event record.
For example:
Event
Severe Convective Storm — June 15
Hazards
Hail. Tornado. Severe wind. Heavy precipitation.
Footprints
Each hazard receives its own geospatial representation.
Timeline
Each hazard is associated with its timing.
Exposure
The event is intersected with insured locations.
Impact
Observed or derived impacts can be attached to the event.
This creates a much more useful representation of what actually happened.
Another important distinction is between observed and modeled information. Insurers increasingly have access to highly sophisticated modeled estimates of severe weather risk. These are valuable for understanding potential future loss.
But after an event, insurers also need evidence.
Historical and near-real-time event intelligence can provide that observational layer. The goal is not to replace modeled risk. It is to connect modeled risk with actual event experience.
The claims organization is often where the limitations of fragmented storm data become most visible. After a severe storm, an insurer may receive thousands of claims.
The claims team needs to quickly determine:
Event-level intelligence can help provide a common geospatial reference point.
A property may be inside the hail footprint but outside the tornado track. Another may be inside the tornado track and inside the damaging wind footprint. Another may be outside both but inside a significant rainfall or flood footprint.
These distinctions can provide valuable context for claims operations. They do not determine coverage or causation by themselves, but they can help insurers investigate losses more efficiently.
The same intelligence can support underwriting. Traditional underwriting often relies heavily on geographic characteristics and modeled risk. But historical event experience can provide another layer.
For example:
How many significant hail events have affected this location over the last 10 years?
is a different question from:
What is the modeled annual probability of damaging hail?
Both are valuable. One describes historical experience. The other describes modeled future risk. Combining the two can provide a more complete view of exposure.
Severe convective storms are a prime example of why secondary perils are changing insurance. These events are often:
As a result, geographic granularity matters.
A county-level designation of "high storm risk" is useful. But it does not tell an insurer what happened to an individual property during a particular storm. Event-level intelligence can bridge that gap.
The industry's challenge is therefore not simply obtaining more weather data. There is already enormous amounts of weather data. The challenge is turning that data into something insurance organizations can use.
That means transforming raw observations into hazard intelligence, and then connecting that intelligence to:
Events → Locations → Exposure → Impact → Decisions
This is where geospatial intelligence becomes particularly important. The value is not simply knowing that severe weather occurred. The value is knowing where the hazard occurred relative to the insured portfolio.
A modern insurance approach to severe convective storms should ideally connect four layers.
Identify severe weather activity as quickly as possible.
Determine which hazards occurred: hail, tornado, wind, heavy precipitation, flooding.
Create geospatial representations of each hazard.
Intersect those footprints with:
This creates an end-to-end intelligence chain:
Detect → Characterize → Map → Intersect → Act
The insurance industry does not need another isolated source of weather information. It needs a better way to connect the information it already has. As severe convective storms continue to drive significant insurance losses, insurers will increasingly need to move beyond broad event classifications and fragmented reports.
They will need to understand the individual hazards within each event. They will need historical event records. They will need high-resolution footprints. They will need timely intelligence during active events. And they will need to connect all of that information to their portfolios.
The future is not simply better weather data. It is better event intelligence.
Explore the historical record
Decades of reconstructed, verified catastrophes — browse the Historical Event Intelligence overview, or request sample data for your own portfolio.
What is the severe convective storm data problem in insurance? Severe convective storm information is fragmented across radar, point reports, warnings, satellite observations, damage assessments, claims data, and catastrophe models — and a single storm system produces several distinct hazards, each with its own footprint. Insurers struggle to combine these pieces into one coherent, geospatial event record they can intersect with insured locations.
Why can't a single event polygon represent a severe convective storm? Within one multi-state storm system, hail may affect one corridor, tornadoes may occur hundreds of miles apart, damaging winds may span a much larger area, and extreme rainfall may flood areas downstream — all evolving through time. No single polygon captures that; the event is better represented as multiple overlapping hazard footprints with timelines.
What is the difference between a storm report and a hazard footprint? A report is a point observation — hail was reported at this location. A footprint is a geospatial representation of where the hazard actually occurred, how large and intense it was, when it happened, and how it moved. Portfolio analysis needs footprints, because the question is which insured locations intersected the hazard, not just where an observer happened to be.
How does event-level storm intelligence help claims teams? It provides a common geospatial reference point after a storm. Claims teams can determine which properties were inside the hail footprint, the tornado track, or the wind and flood footprints — and which hazard affected each location — so they can associate claims with the event, prioritize responses, and deploy adjusters where the hazard was most severe.
Why do insurers need both observed and modeled severe storm data? Modeled estimates describe potential future loss and are essential for pricing and capital decisions. Observed event intelligence describes what actually happened — where hail fell, where tornadoes tracked, where winds and flooding were documented. Combining historical event experience with modeled risk gives a more complete view of exposure than either alone.














-min.png)


.png)


.png)




Decision-ready intelligence for understanding what's happening, what is impacted, and what to do next. Global hazard, severe weather, catastrophe, and physical risk intelligence trusted by governments, enterprises, insurers, humanitarian organizations, and technology platforms worldwide.
Request DemoContact Us

