


Insurers buy catastrophe models to understand what could happen. What the models don't provide is what is happening — the verified, real-time, global event data that exposure managers need at landfall-minus-72-hours, that CAT claims teams need at impact-plus-6, and that underwriters need in the growing set of markets where no commercial cat model exists at all. That observed-event layer is what DisasterAWARE provides: global, multi-hazard, independently sourced, delivered as a platform and as APIs — and already in production inside products built by the world's largest insurance broker.
"DisasterAWARE's intelligence is a core component of our real-time risk dashboard and analytics modeling, giving clients an edge in hazard response and planning." — SVP, Digital Products, Marsh (Blue[i] case study)
This page lays out where observed event data fits in an insurance workflow — before the event, after the event, and in the places the stochastic models don't reach.
The catastrophe analytics market is dominated by modeled data: stochastic event catalogs, vulnerability curves, exceedance-probability curves — the machinery of annual risk pricing from Verisk, Moody's RMS, and their peers. That machinery is essential, and we don't replicate it.
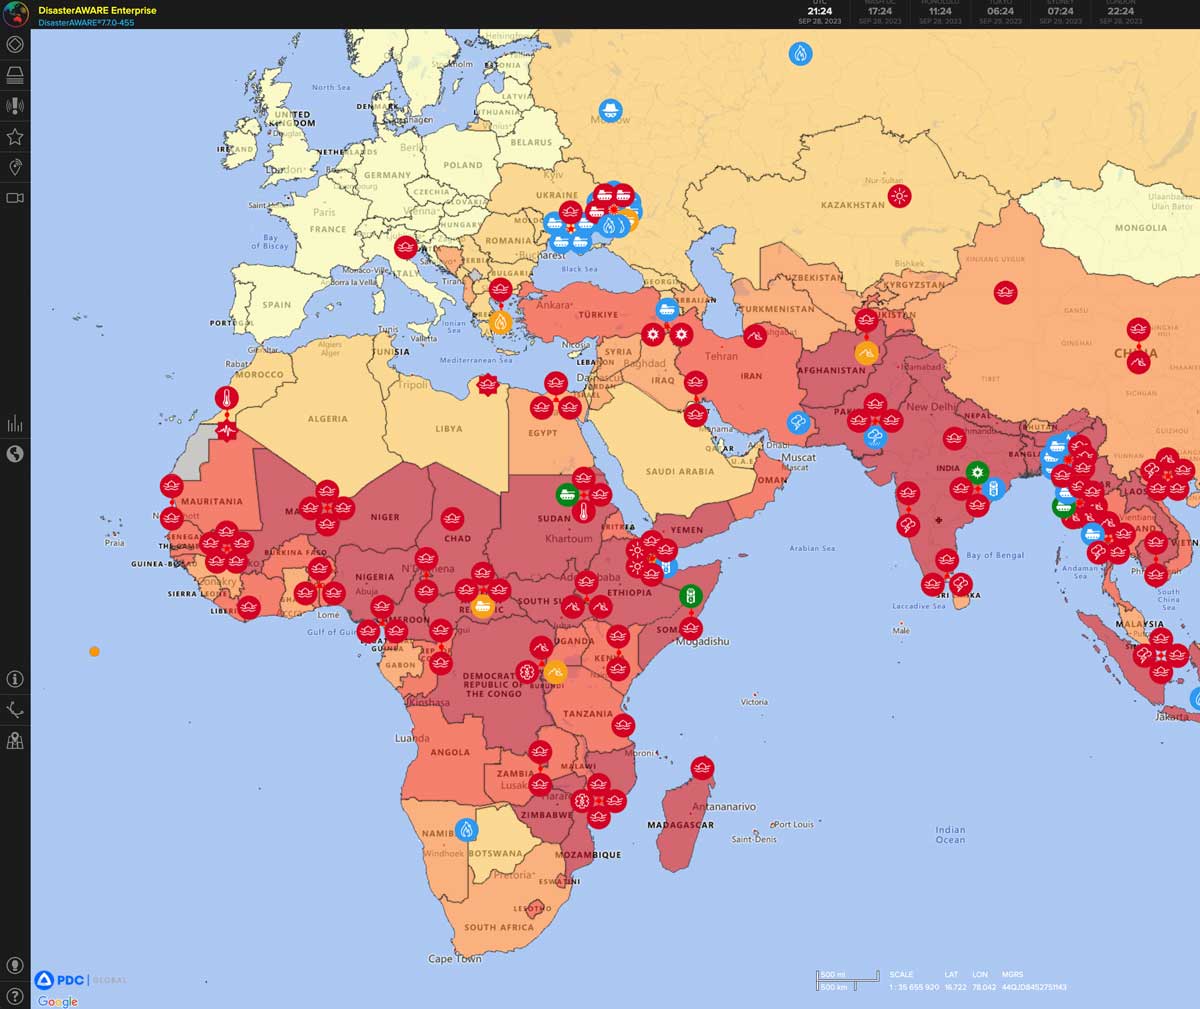
Observed event data is the other half of the stack: the record of what is actually happening (and what actually happened), detected from authoritative scientific sources, verified, and enriched with impact context. It differs from modeled data on every operational axis: it updates in minutes rather than annually; it describes real events with real footprints rather than simulated seasons; and it covers the whole world's hazards — earthquake, tsunami, cyclone, flood, wildfire, volcano, and more — rather than the perils and territories a model vendor has chosen to build. (For the full anatomy of how observed events are detected, verified, and impact-scored, see What Is Event Intelligence?)
Most insurance workflows need both halves. Here are the three moments where the observed half earns its keep.
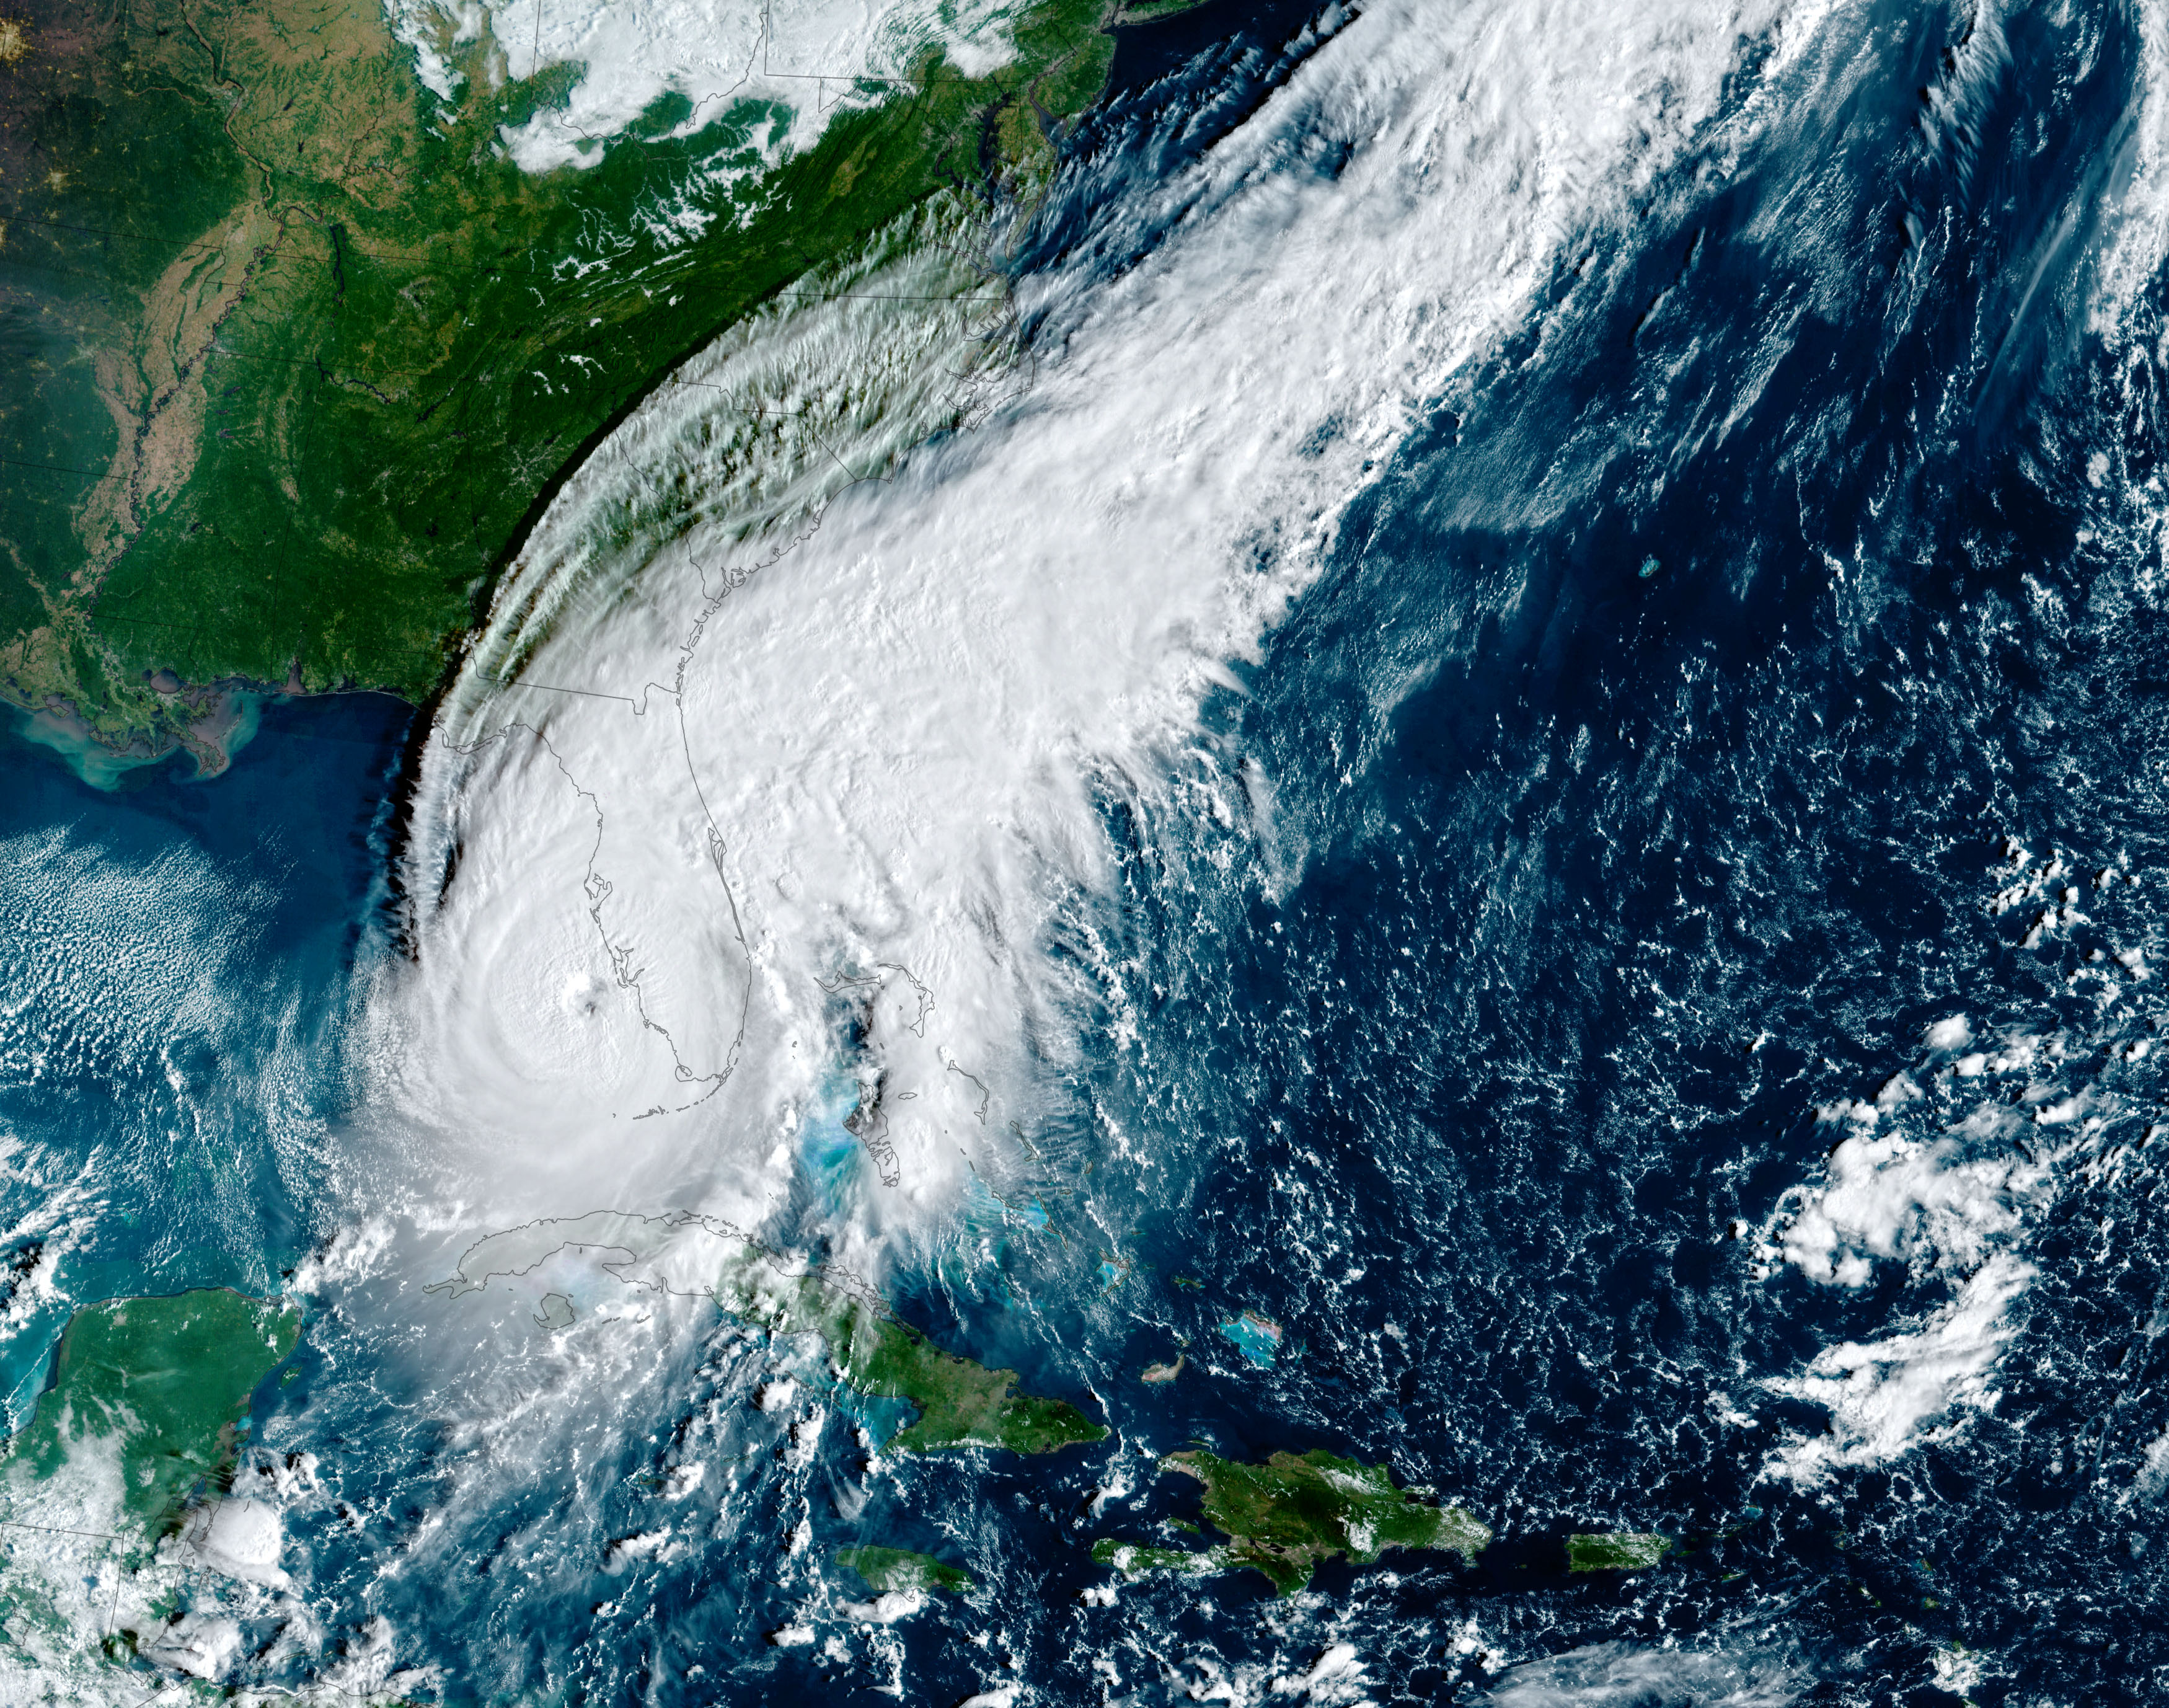
A tropical cyclone forms and the forecast tracks begin to converge. From that moment until landfall, the exposure management team is answering the same question on repeat: how much of the book sits in the projected impact zone, and does the answer change with this forecast update?
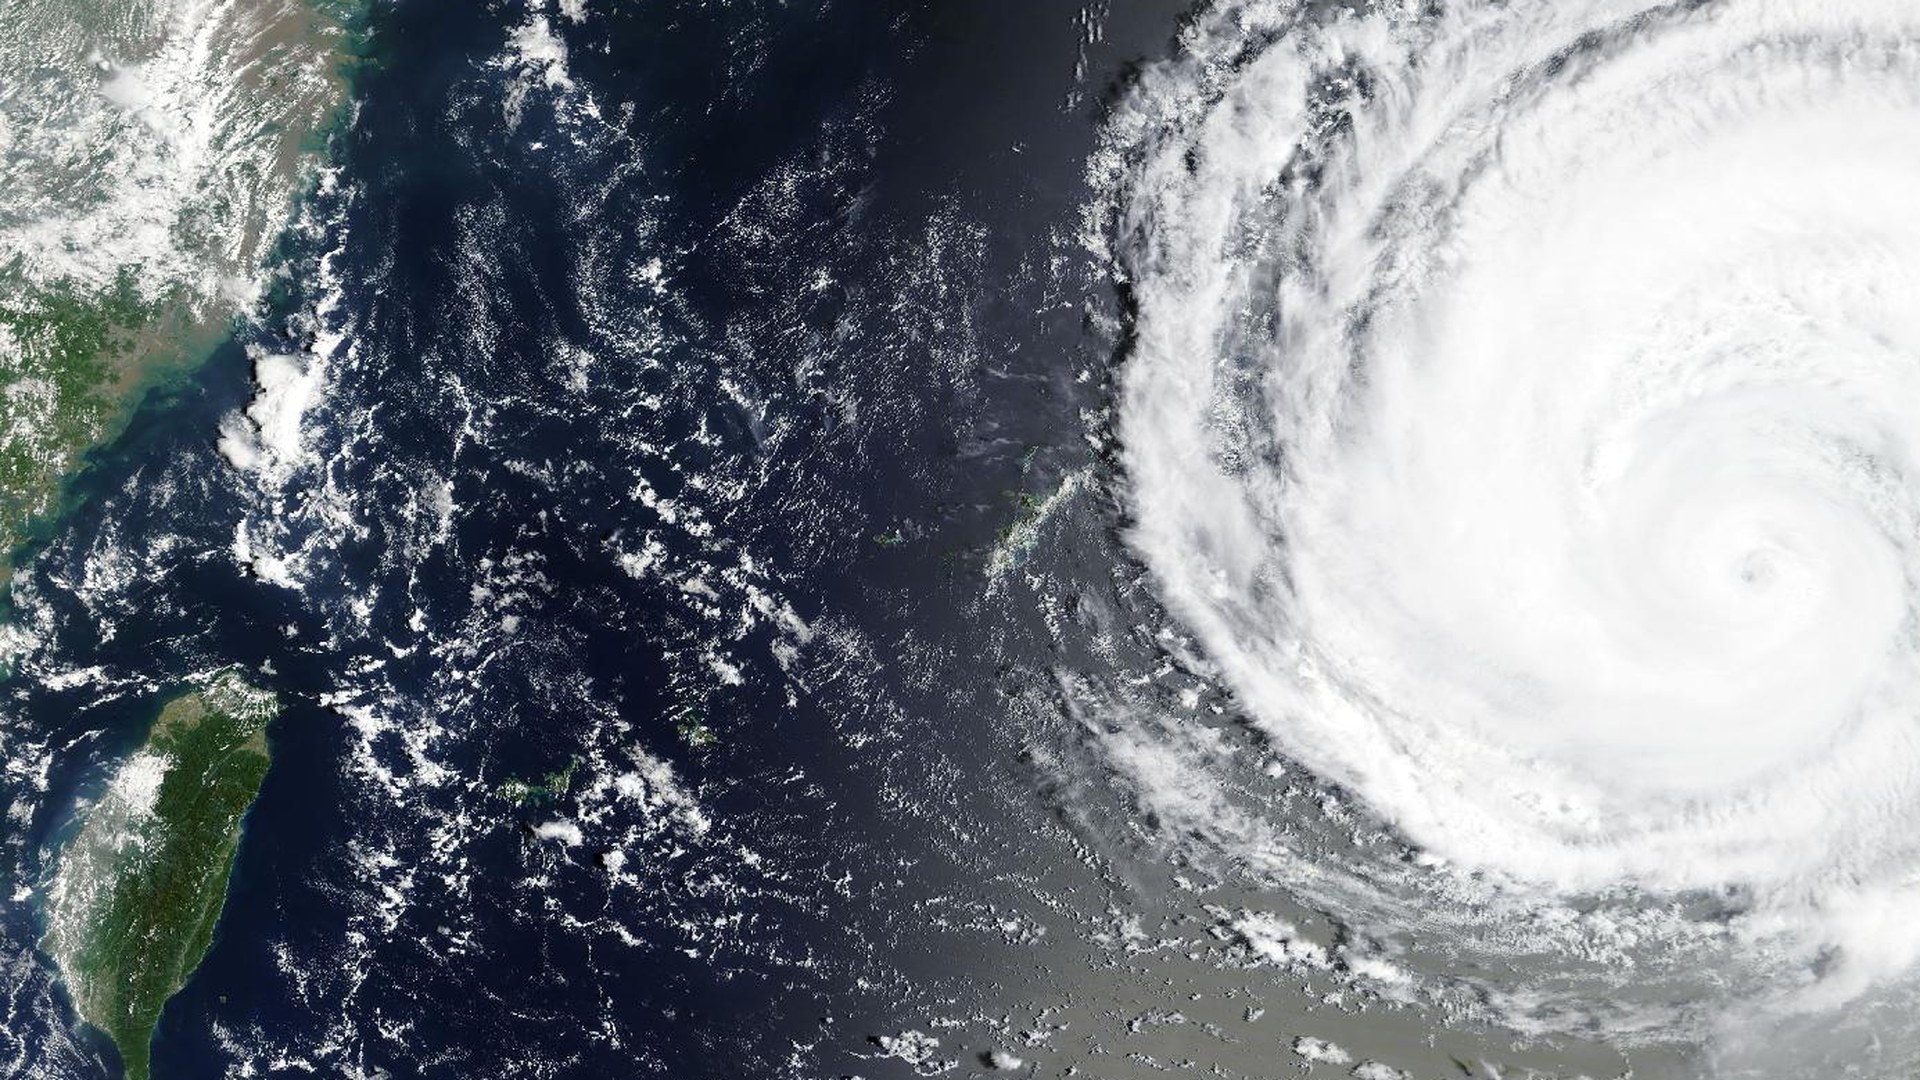
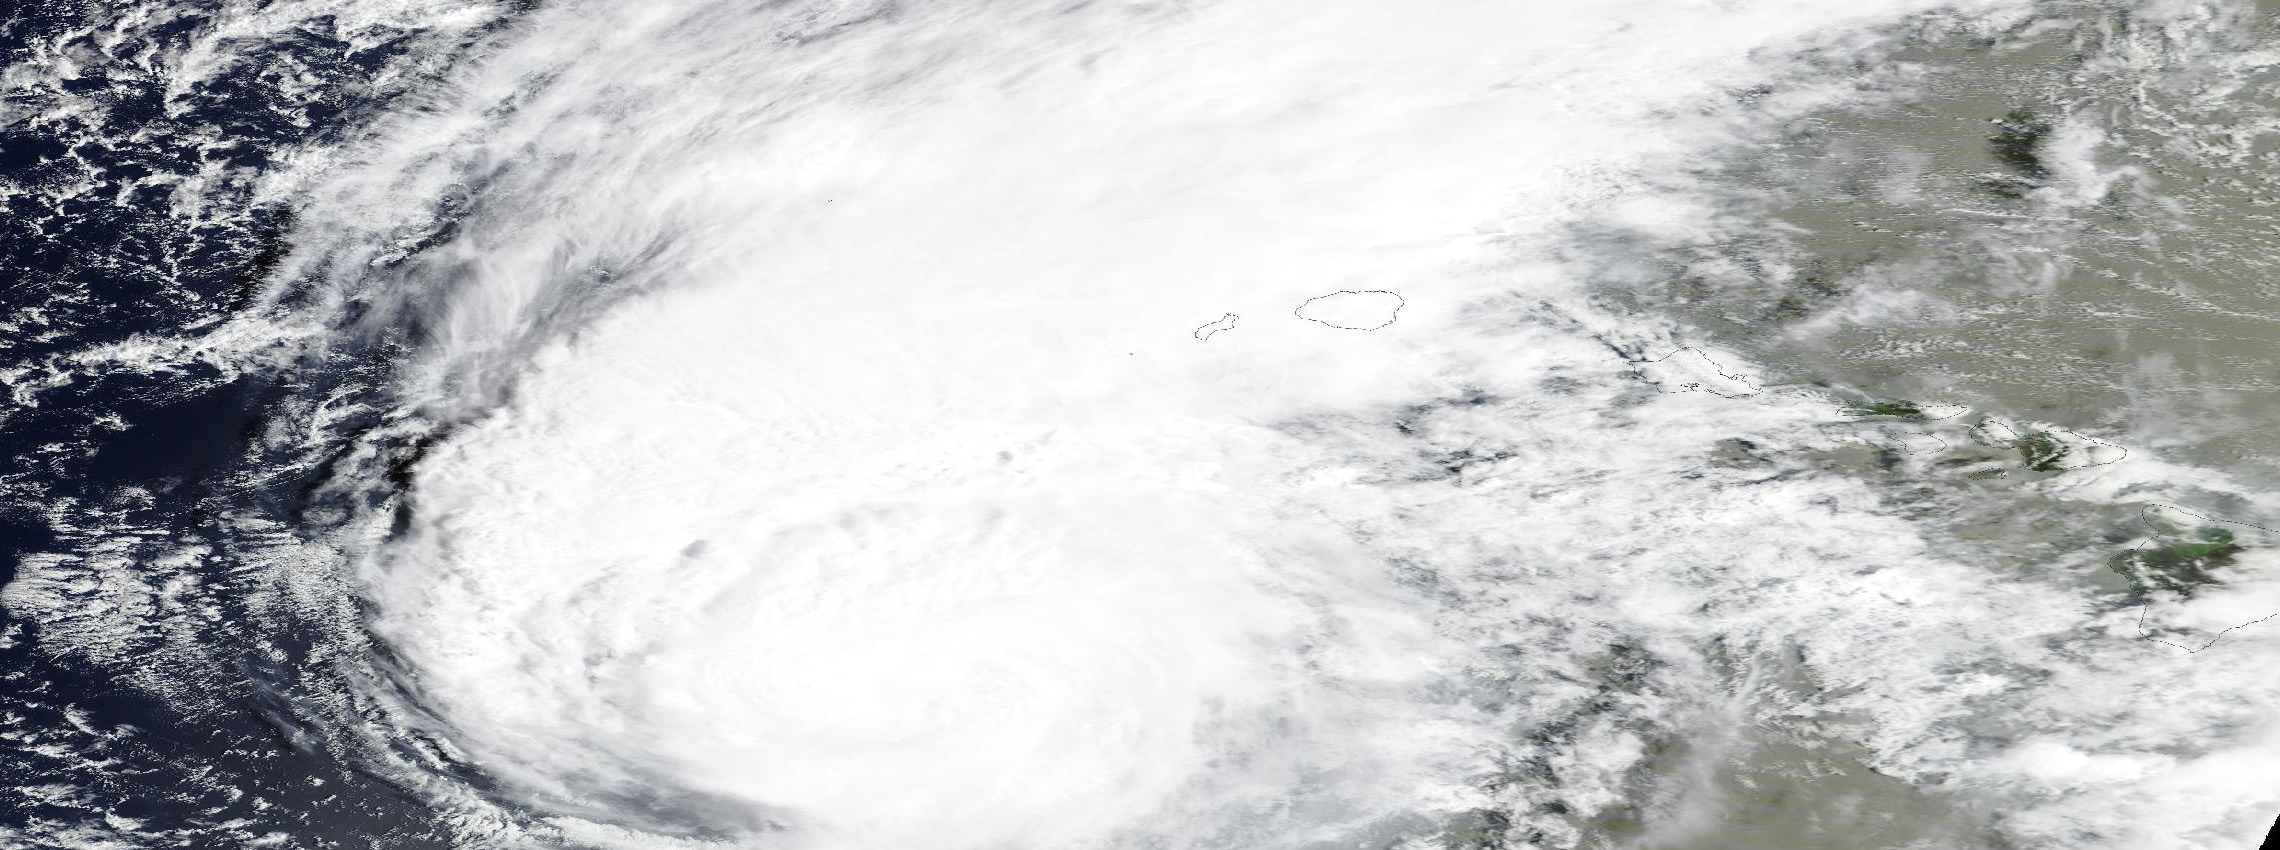
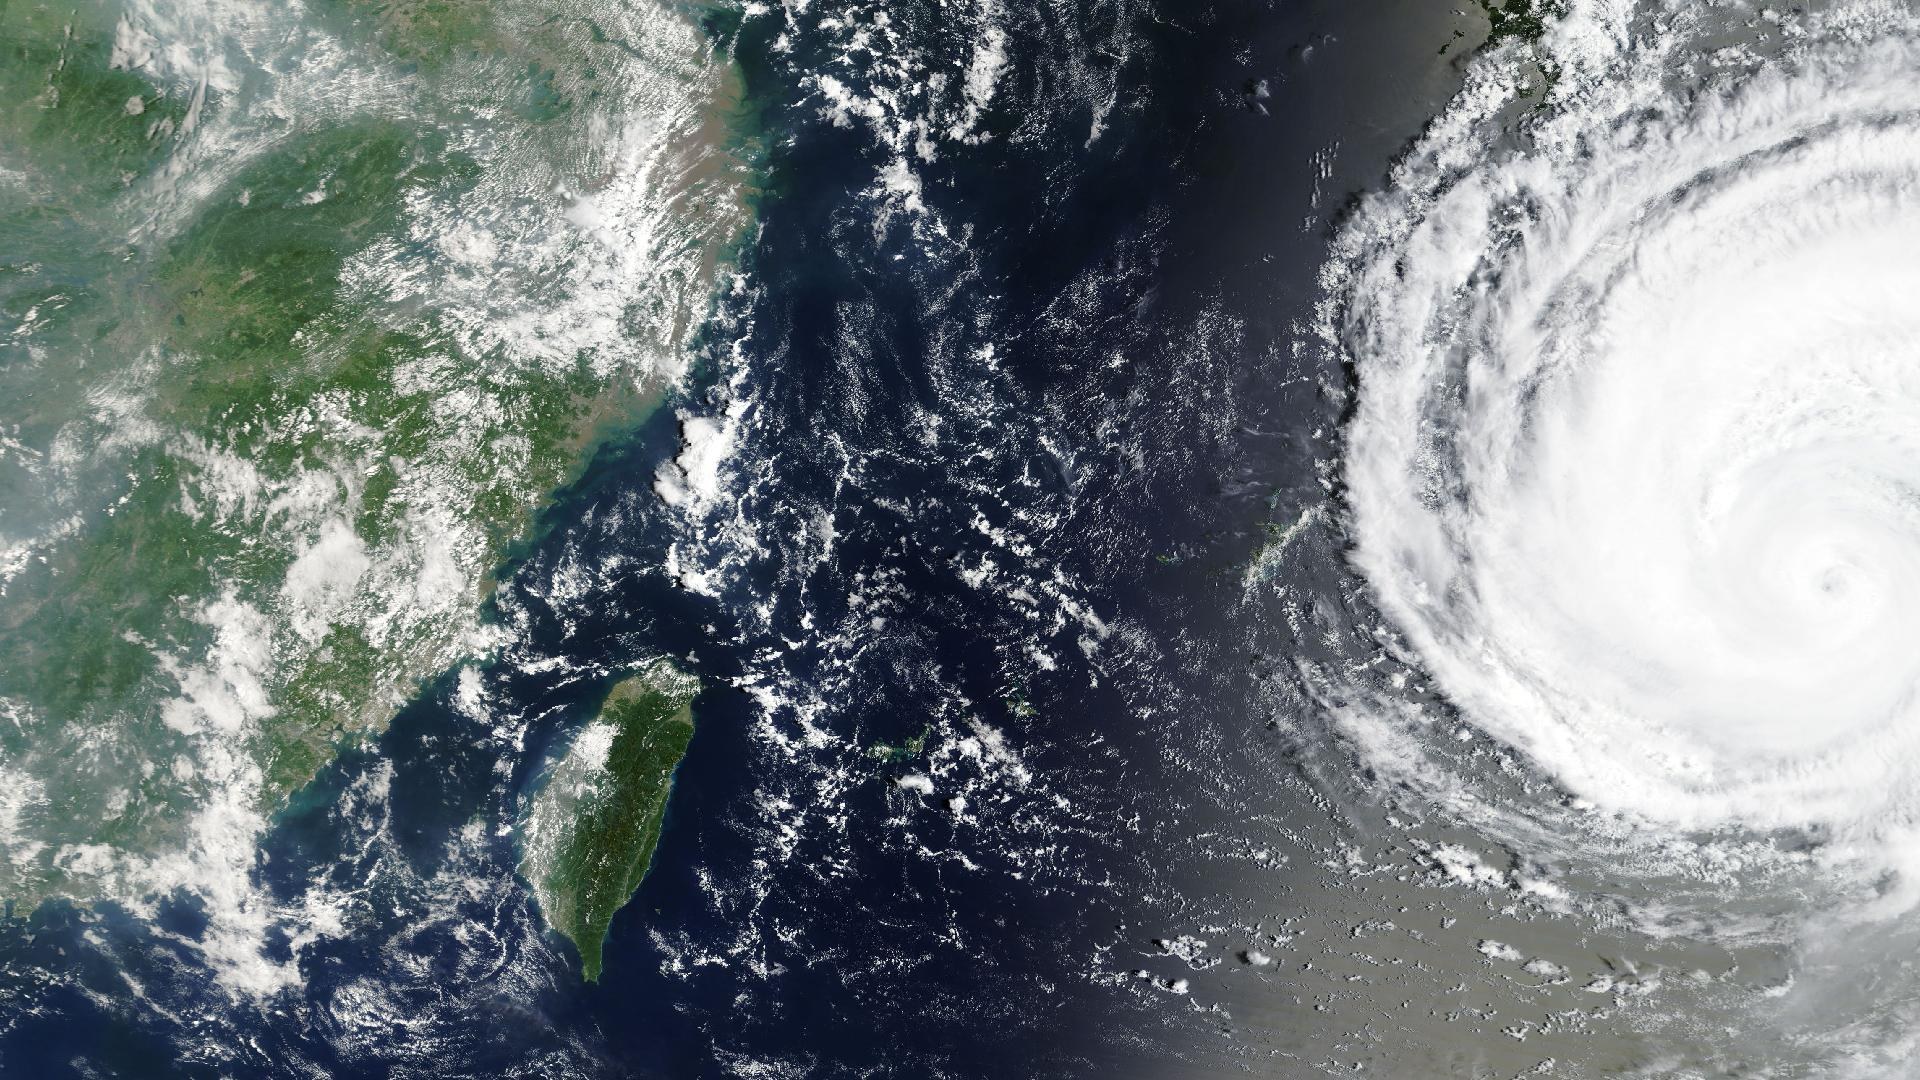
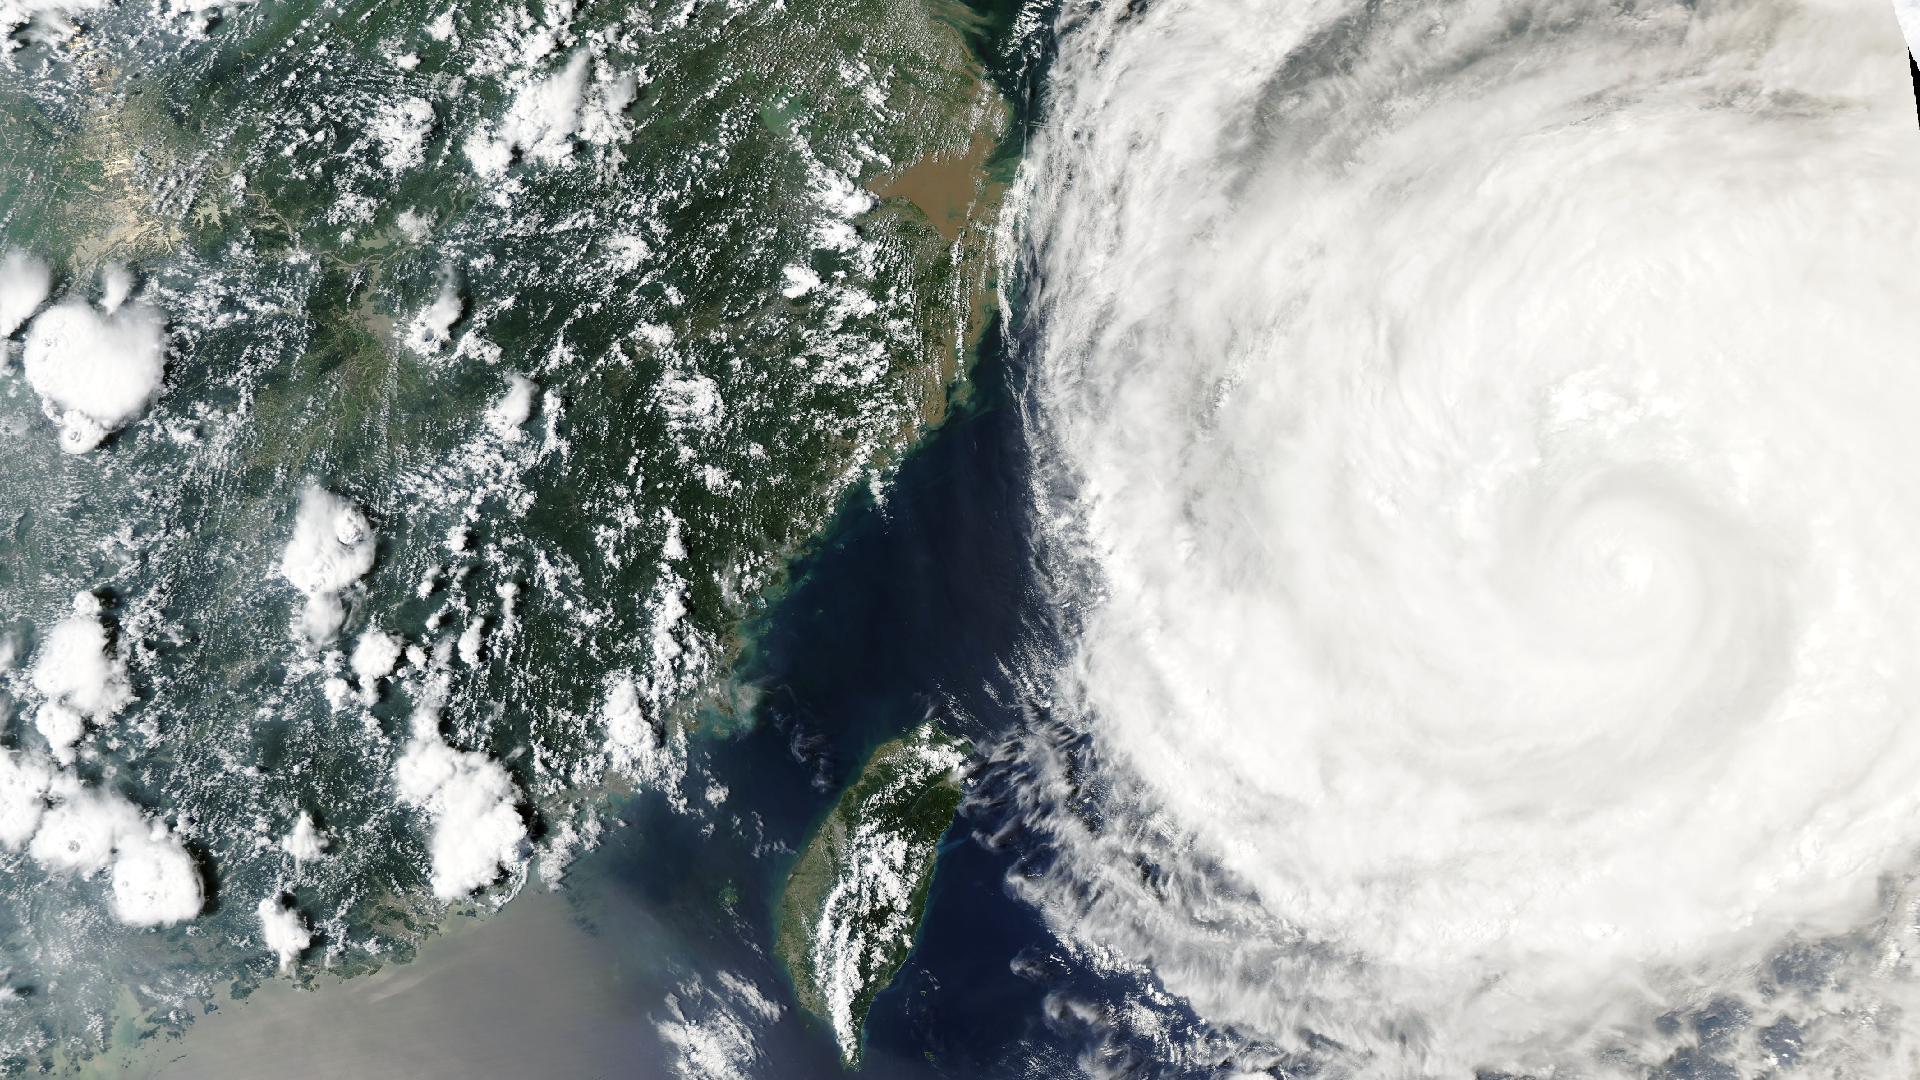
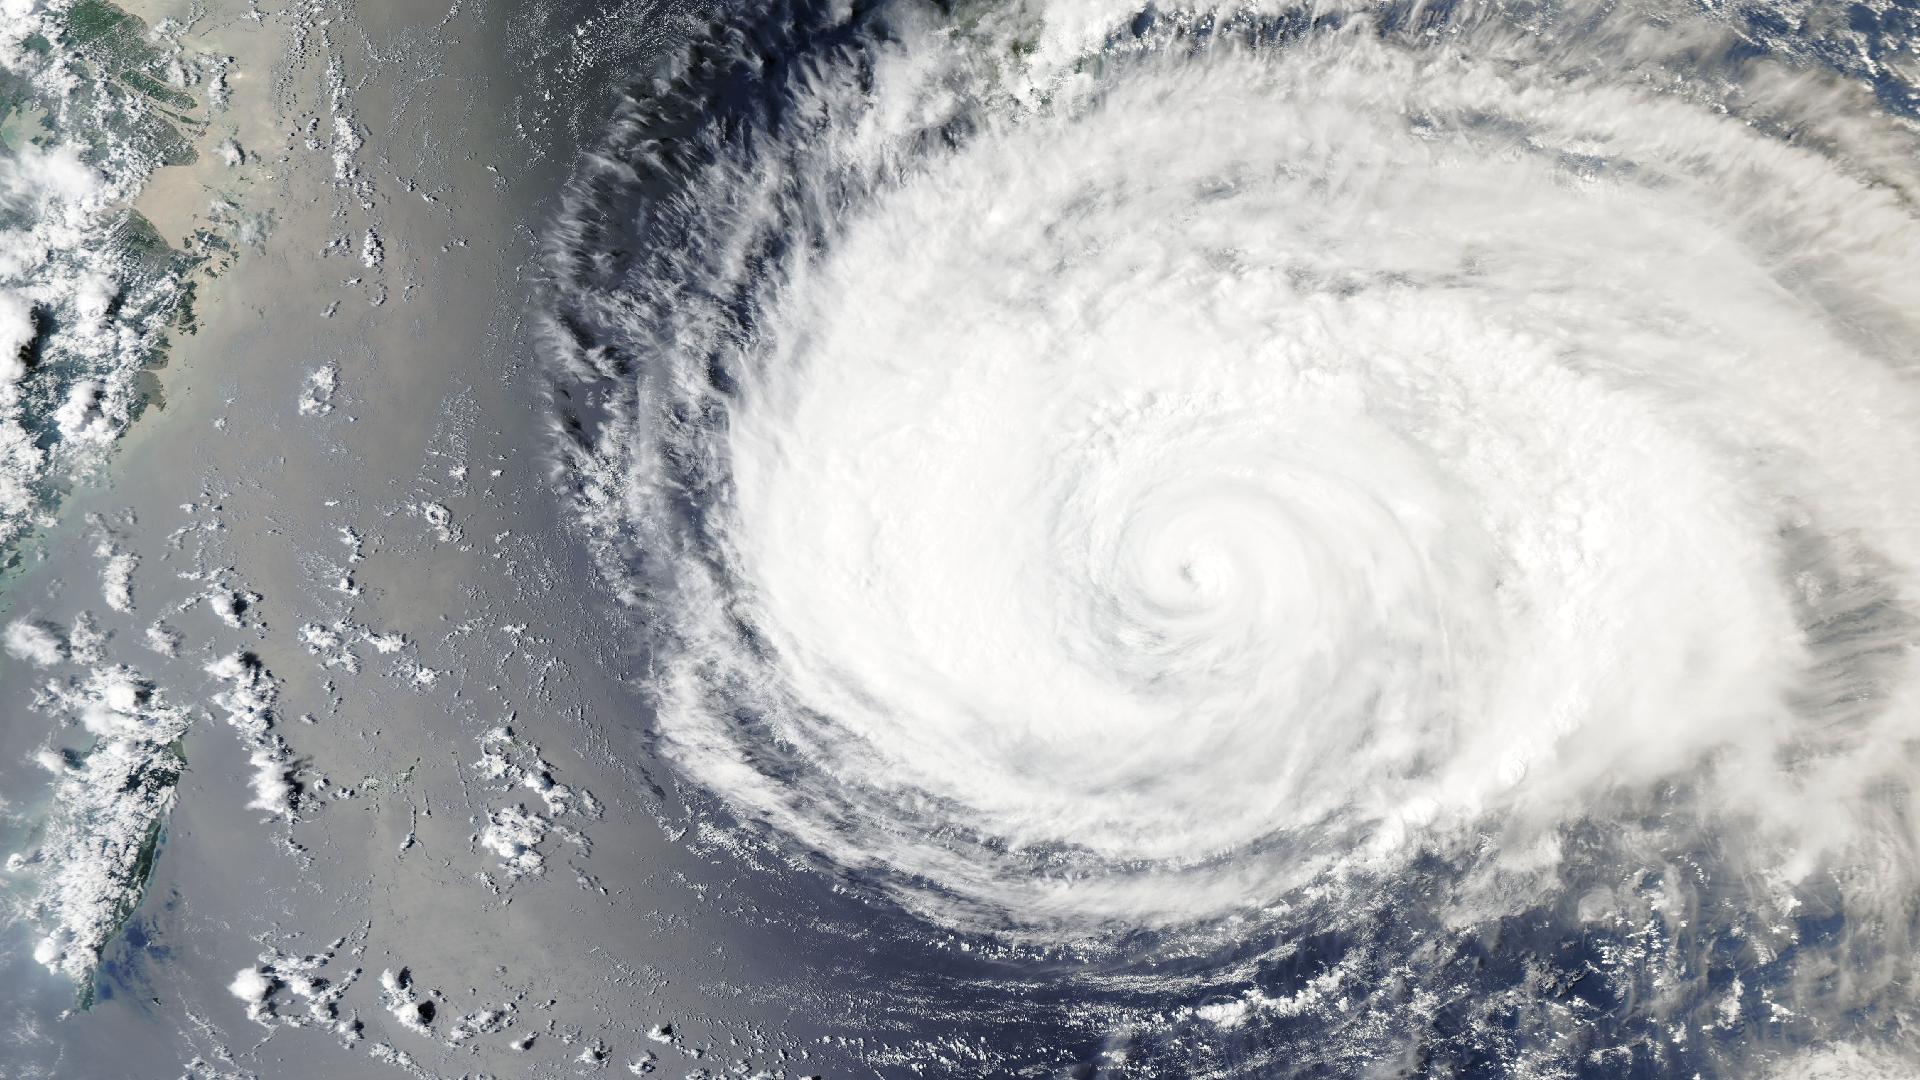
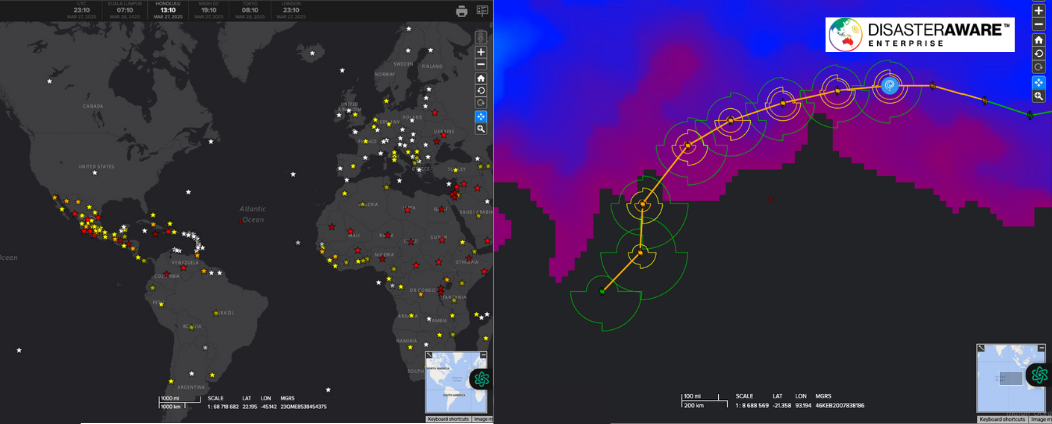
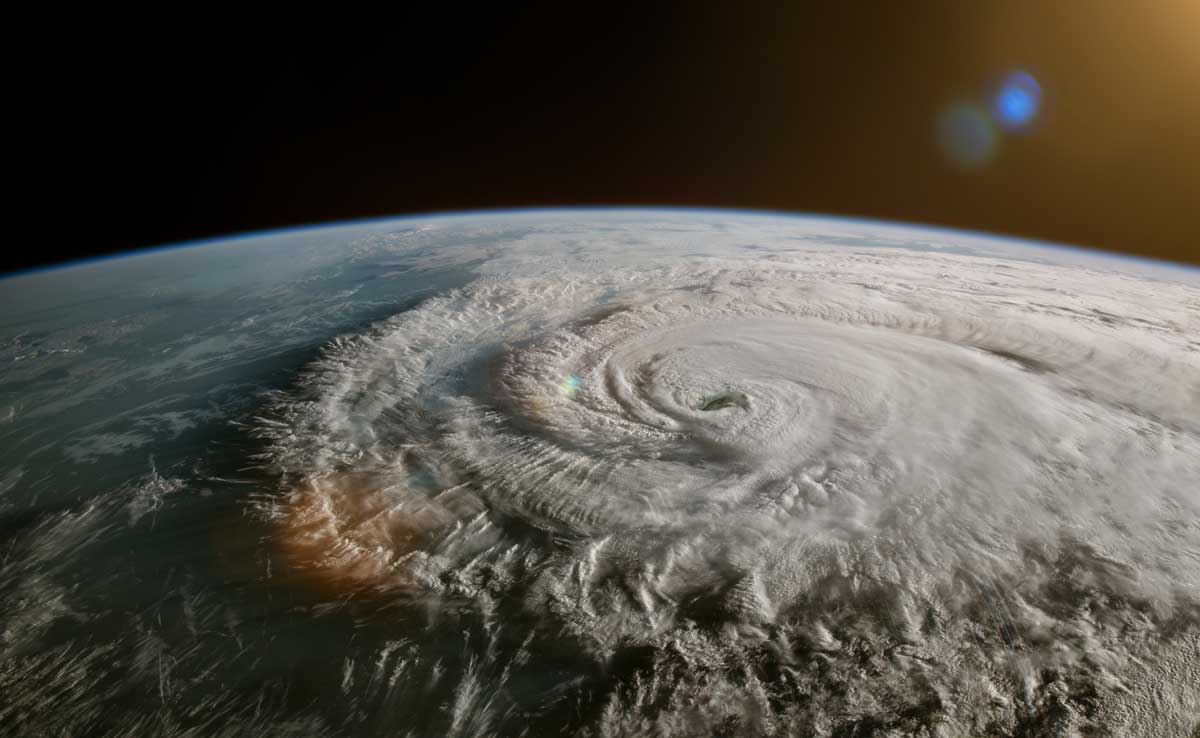
DisasterAWARE tracks the event continuously against forecast updates — position, intensity, projected impact area, and the population and infrastructure inside it — and delivers each update through the Event Intelligence API in formats that run directly against portfolio locations. When Typhoon Dolphin approached Okinawa this August, DisasterAWARE carried its advisory-by-advisory track, wind field, and landfall projection from formation onward — the exact sequence an accumulation check consumes. No waiting on a scheduled footprint delivery; the feed updates when the forecast does.
Who uses this: exposure managers, cat managers, reinsurance analysts. The vocabulary it serves: event footprint, accumulation, PML sanity-check, pre-landfall exposure assessment.
See your exposure before landfall
DisasterAWARE delivers verified, global, multi-hazard event data — live feeds for accumulation checks and claims triage, decades of history for the models.
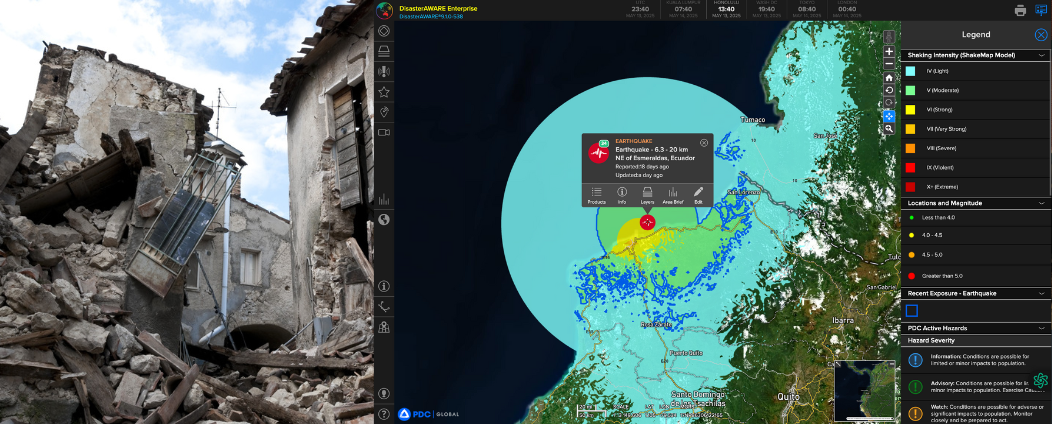
The event has struck. Before the first-notice-of-loss volume arrives, the CAT claims organization needs to know: how many policies sit inside the impact area, where the severe damage concentrates, how many adjusters to deploy and where, and which claims to fast-track.
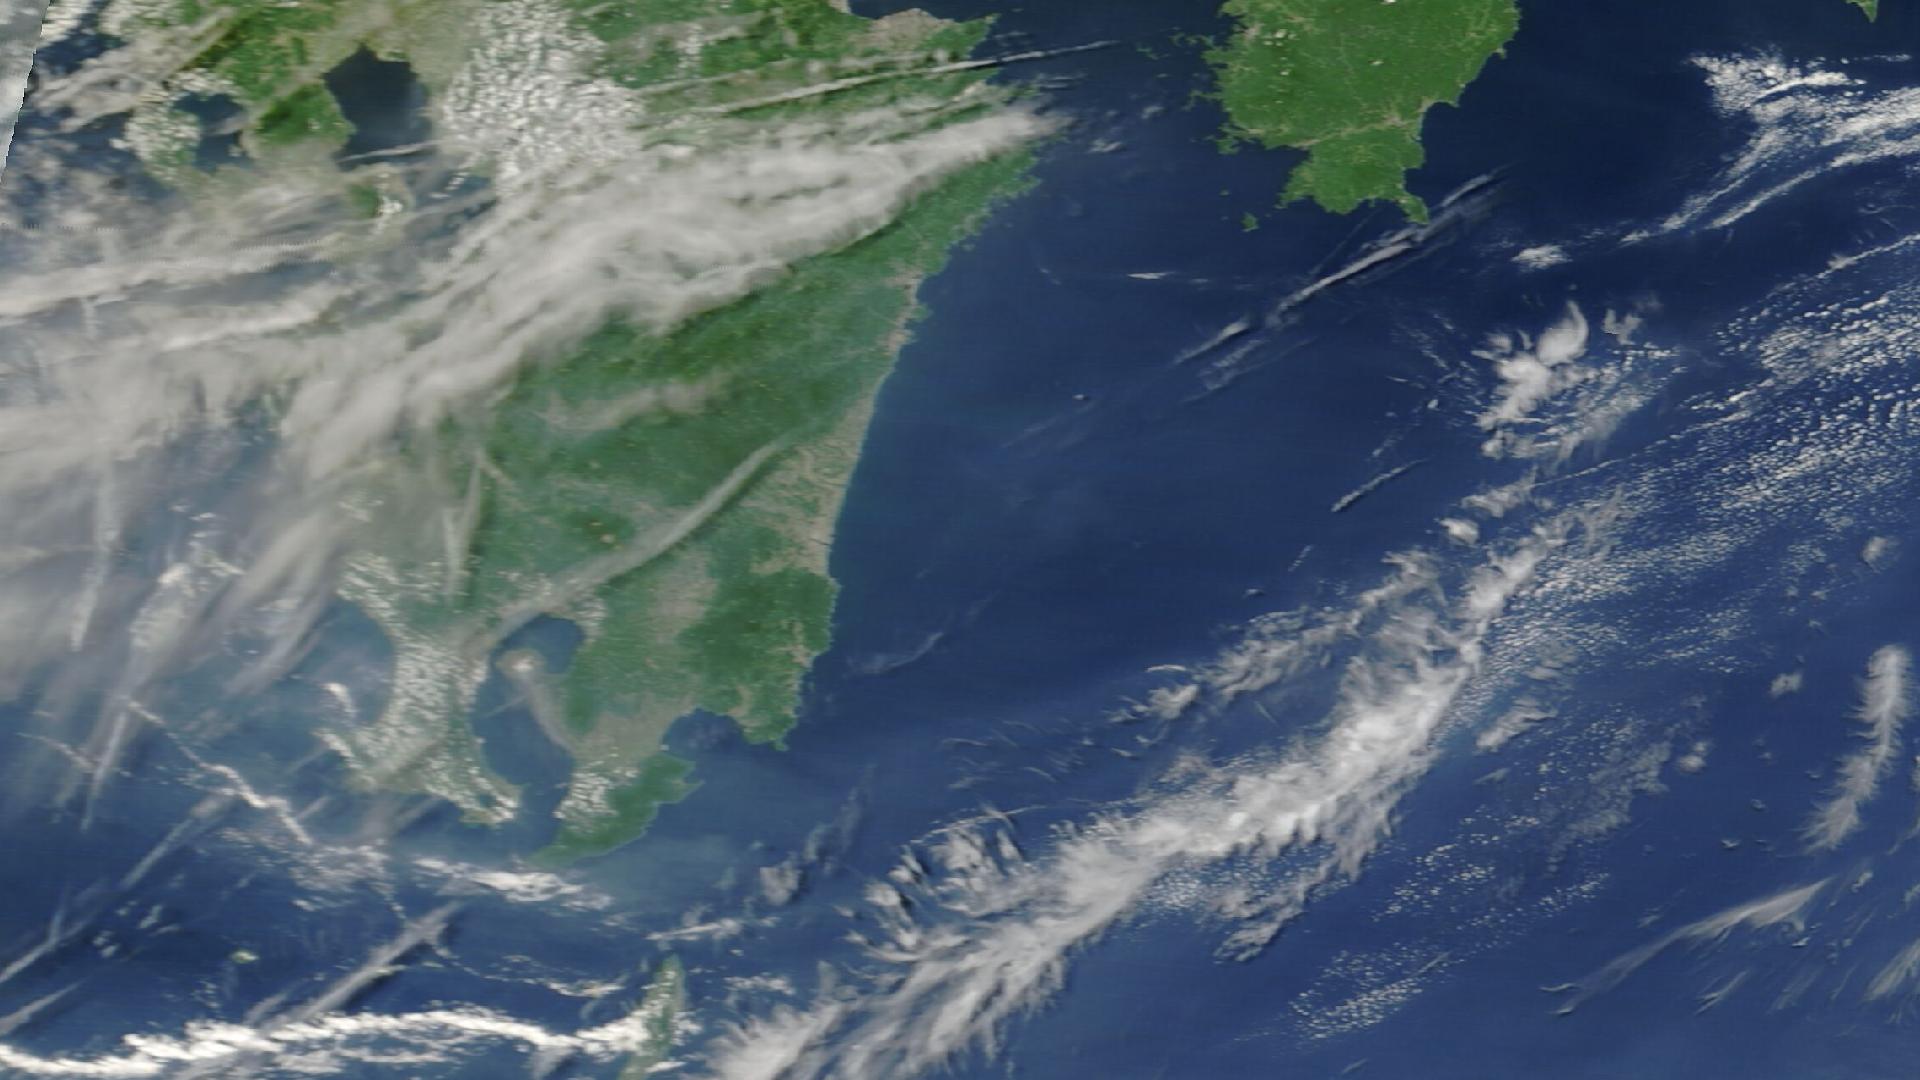
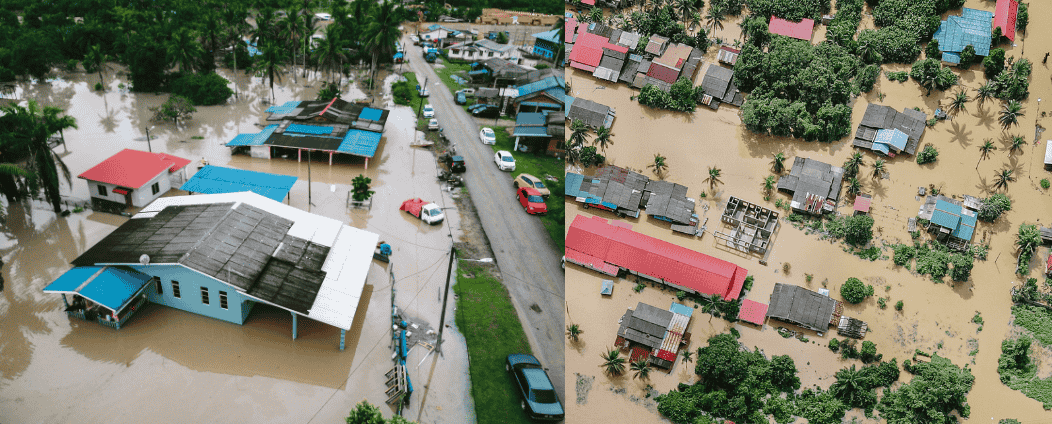
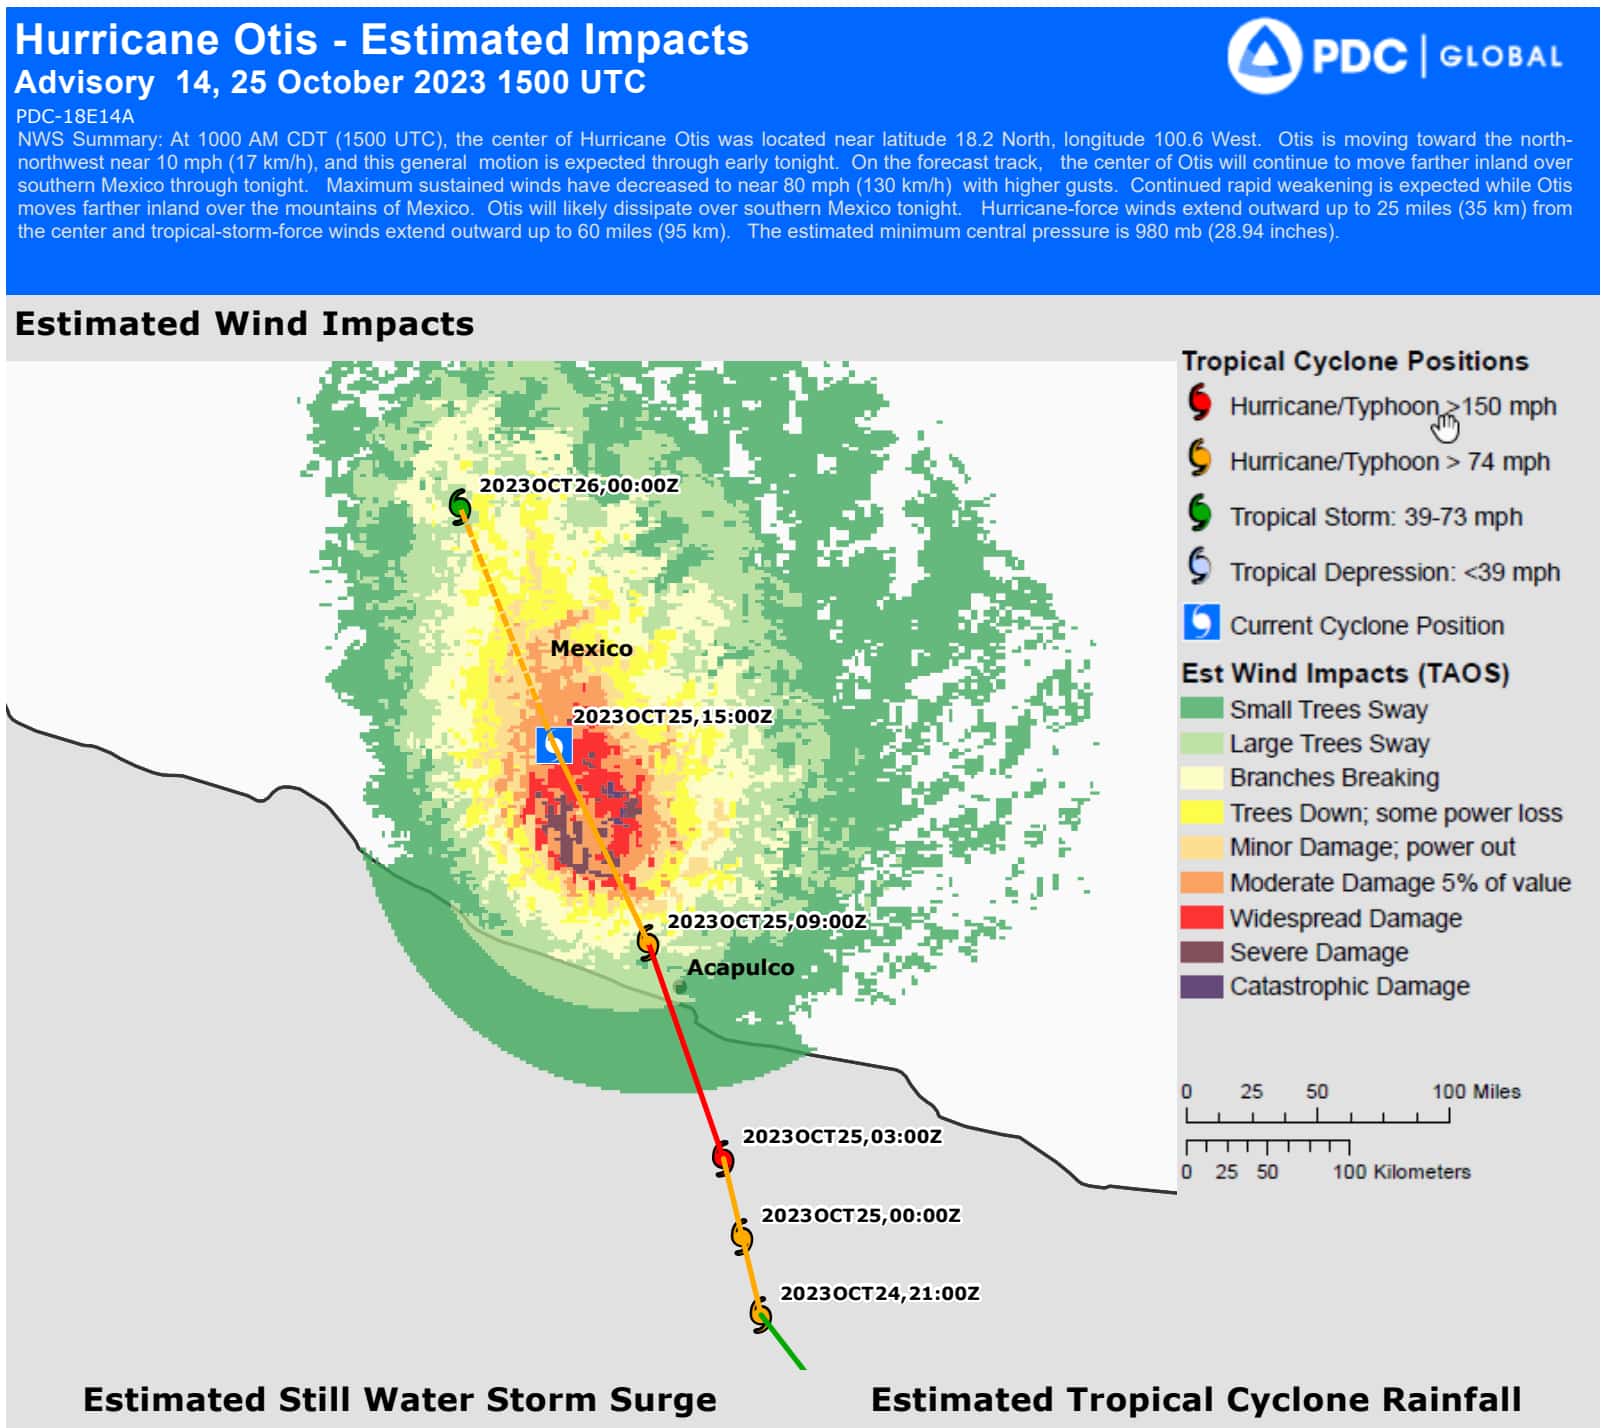
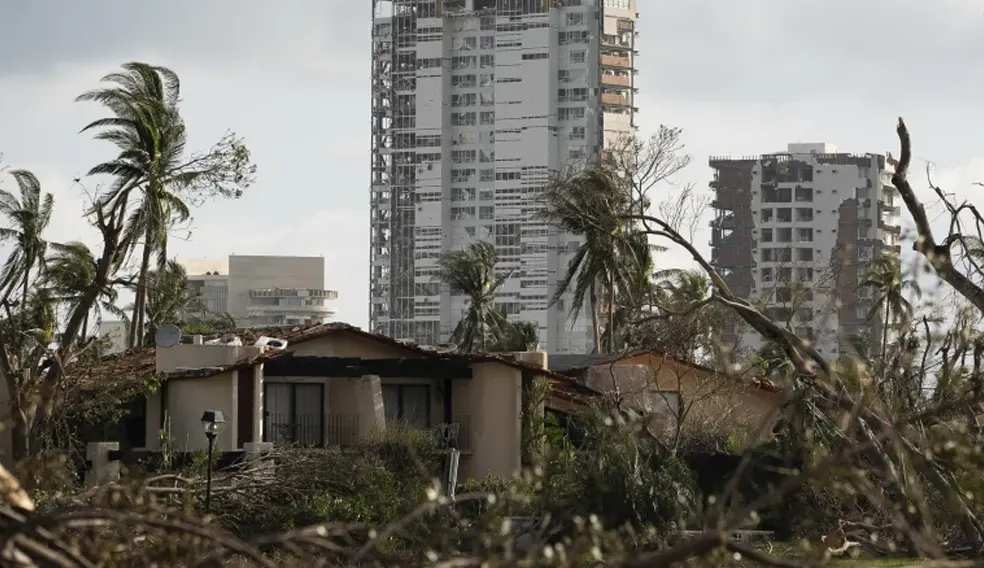
DisasterAWARE's impact assessment answers those questions within hours of impact: hazard severity zones, affected-population and infrastructure estimates, and — for multi-hazard events — the separation that matters to coverage determination. A hurricane is a wind event and a flood event with different policy implications; an earthquake can cascade into tsunami and structural collapse, as Japan's July M7.1 did — a sequence we reconstructed event-by-event in Anatomy of a Cascade. Timestamped, authoritative event timing also bears directly on hours-clause questions, where whether losses fall inside a 72-hour window determines how many deductibles apply.
Who uses this: CAT claims managers, claims operations, loss adjusters and TPAs. The vocabulary it serves: claims triage, CAT response, post-event impact assessment, FNOL surge planning.
Commercial cat models cover the perils and territories where model vendors found a market. Large parts of the insured world — most of Emerging Asia, Africa, the Pacific, much of Latin America — have no commercial model at all, and it's precisely where catastrophe protection gaps are widest and cession rates highest. An underwriter pricing exposure in Manila, Accra, or Suva cannot buy a stochastic answer.
What exists instead is the observed record. Historical Event Intelligence provides a structured, multi-decade, globally consistent catalog of what has actually happened — the same class of data that seeds and validates stochastic models where they do exist — plus live monitoring going forward. For a regional carrier, a sovereign risk pool, or a global carrier's emerging-markets desk, that's a defensible baseline where the alternative is hand-assembled fragments. DisasterAWARE's lineage here is unusual: built on Pacific Disaster Center heritage supporting disaster management agencies worldwide, its coverage is deepest exactly where commercial model coverage is thinnest.
Who uses this: underwriters, portfolio managers, CROs at regional carriers and risk pools; model validation teams using the observed catalog as ground truth. The vocabulary it serves: historical event catalog, natural catastrophe event database, hazard baseline, model validation.
Parametric products need an objective index from an impartial third party — objective, hazard-correlated, fortuitous, modellable, and available fast. For wind in the North Atlantic, established index sources exist. For earthquake, tsunami, volcanic activity, and multi-hazard structures — especially outside the US and Europe — trigger data sourcing is thin. DisasterAWARE's independently sourced, timestamped, globally consistent event record is built for exactly that role: trigger design on the front end, payout verification on the back end. If you're structuring in this space, talk to us early — the data questions are solvable, and they're better solved before the term sheet.
The strongest evidence for an insurance data layer is production use by insurance practitioners:
The same integration pattern — data layer embedded in the practitioner's own product — is available to carriers, reinsurers, brokers, and insurtechs through the Event Intelligence API.
Is DisasterAWARE a catastrophe model? No. Cat models simulate what could happen (stochastic event sets, vulnerability curves, loss exceedance). DisasterAWARE supplies observed event data: what is happening now and what has actually happened, verified and impact-assessed. The two are complementary — observed catalogs seed and validate models, and real-time events operationalize what models price.
What hazard types and geographies are covered? 30+ hazard types — earthquake, tsunami, tropical cyclone, flood, wildfire, volcano, severe weather, and more — with genuinely global coverage, including regions without commercial cat model coverage.
How is the data delivered? Operational platform (dashboards, alerting, map intelligence) and APIs/data feeds for integration into exposure management, claims, and analytics systems. Historical bulk data supports model validation and event-catalog work.
Can it trigger downstream workflows? Yes — events carry severity, location, and exposure attributes designed to drive routing rules in notification, claims, and exposure systems.
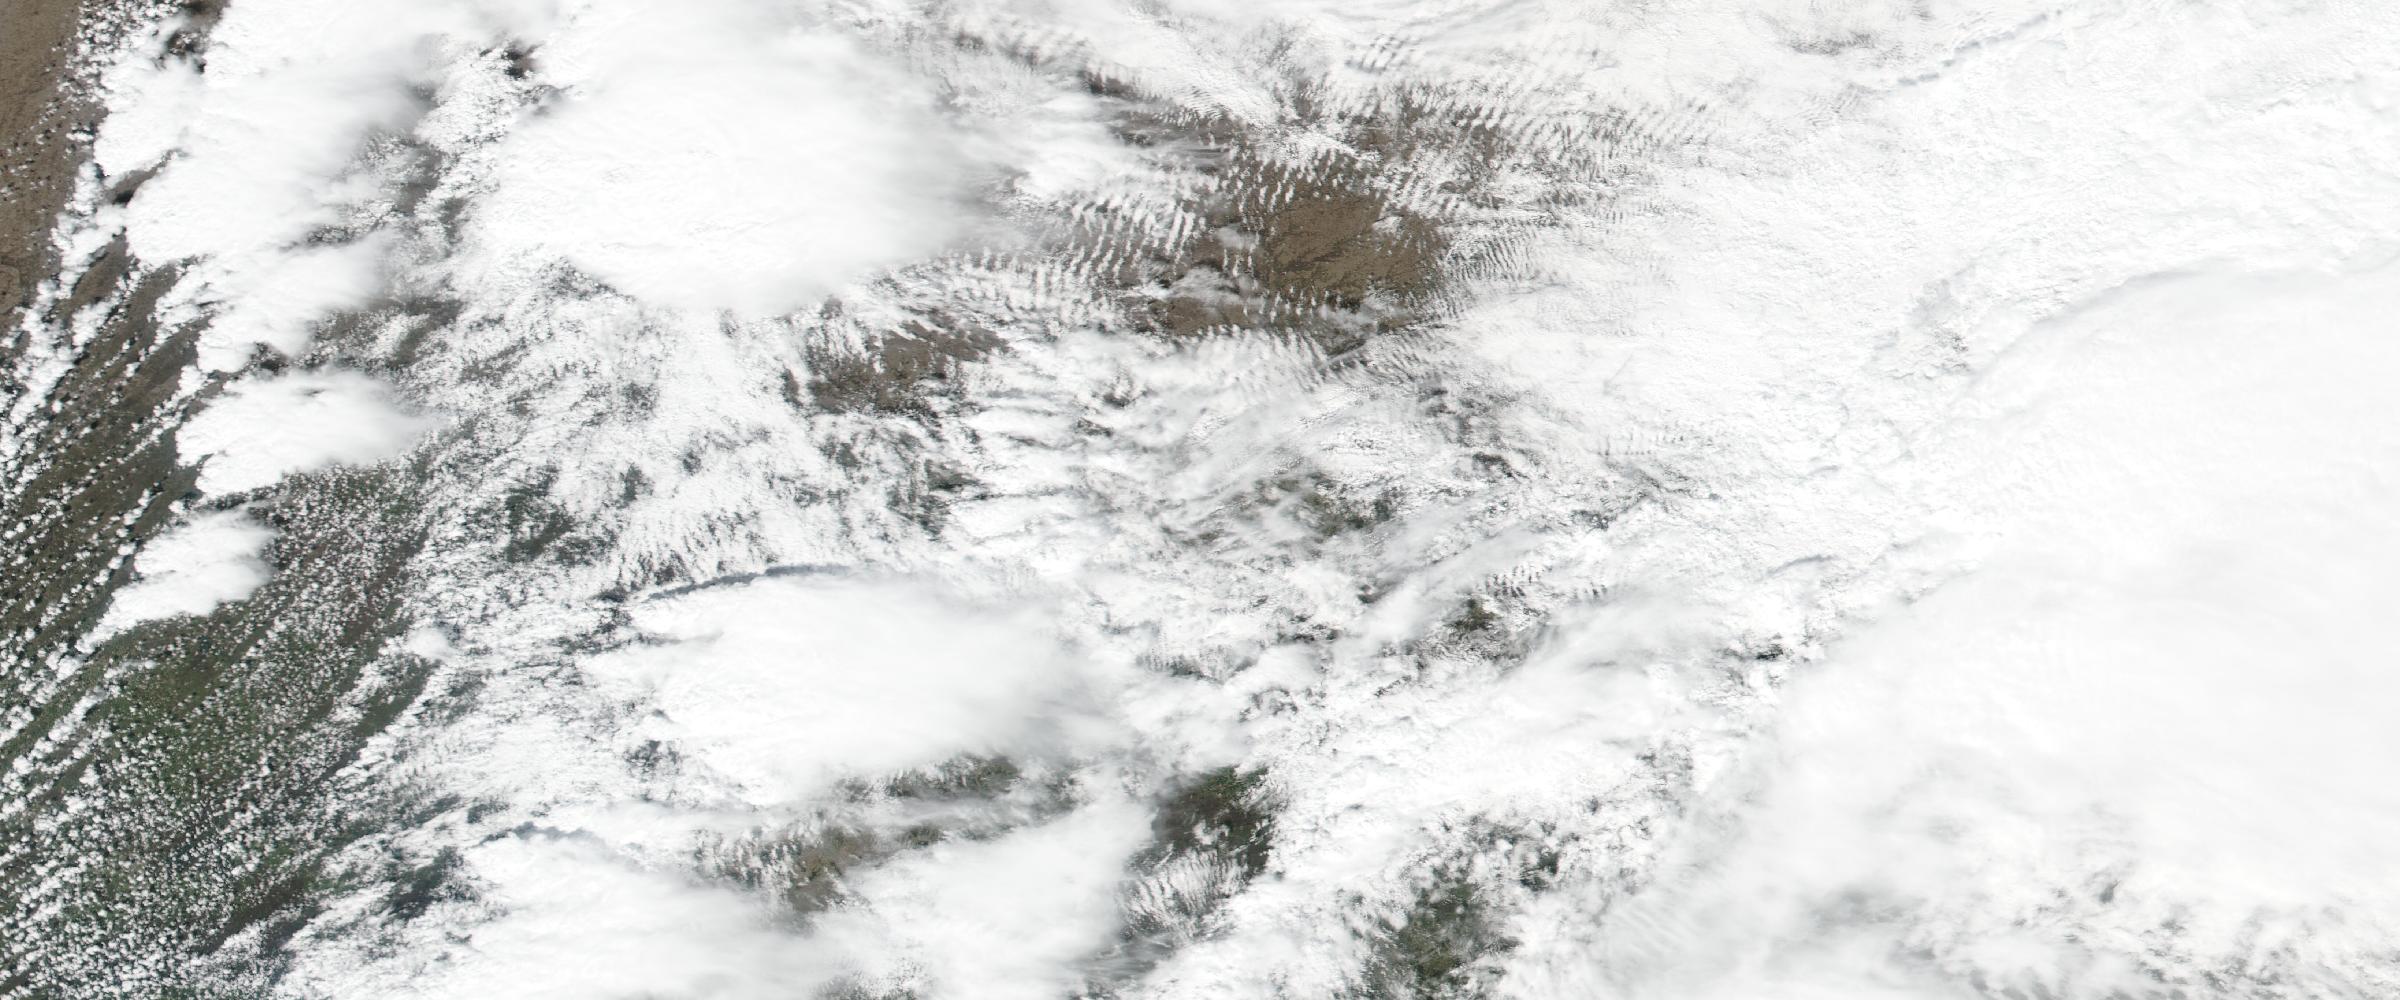
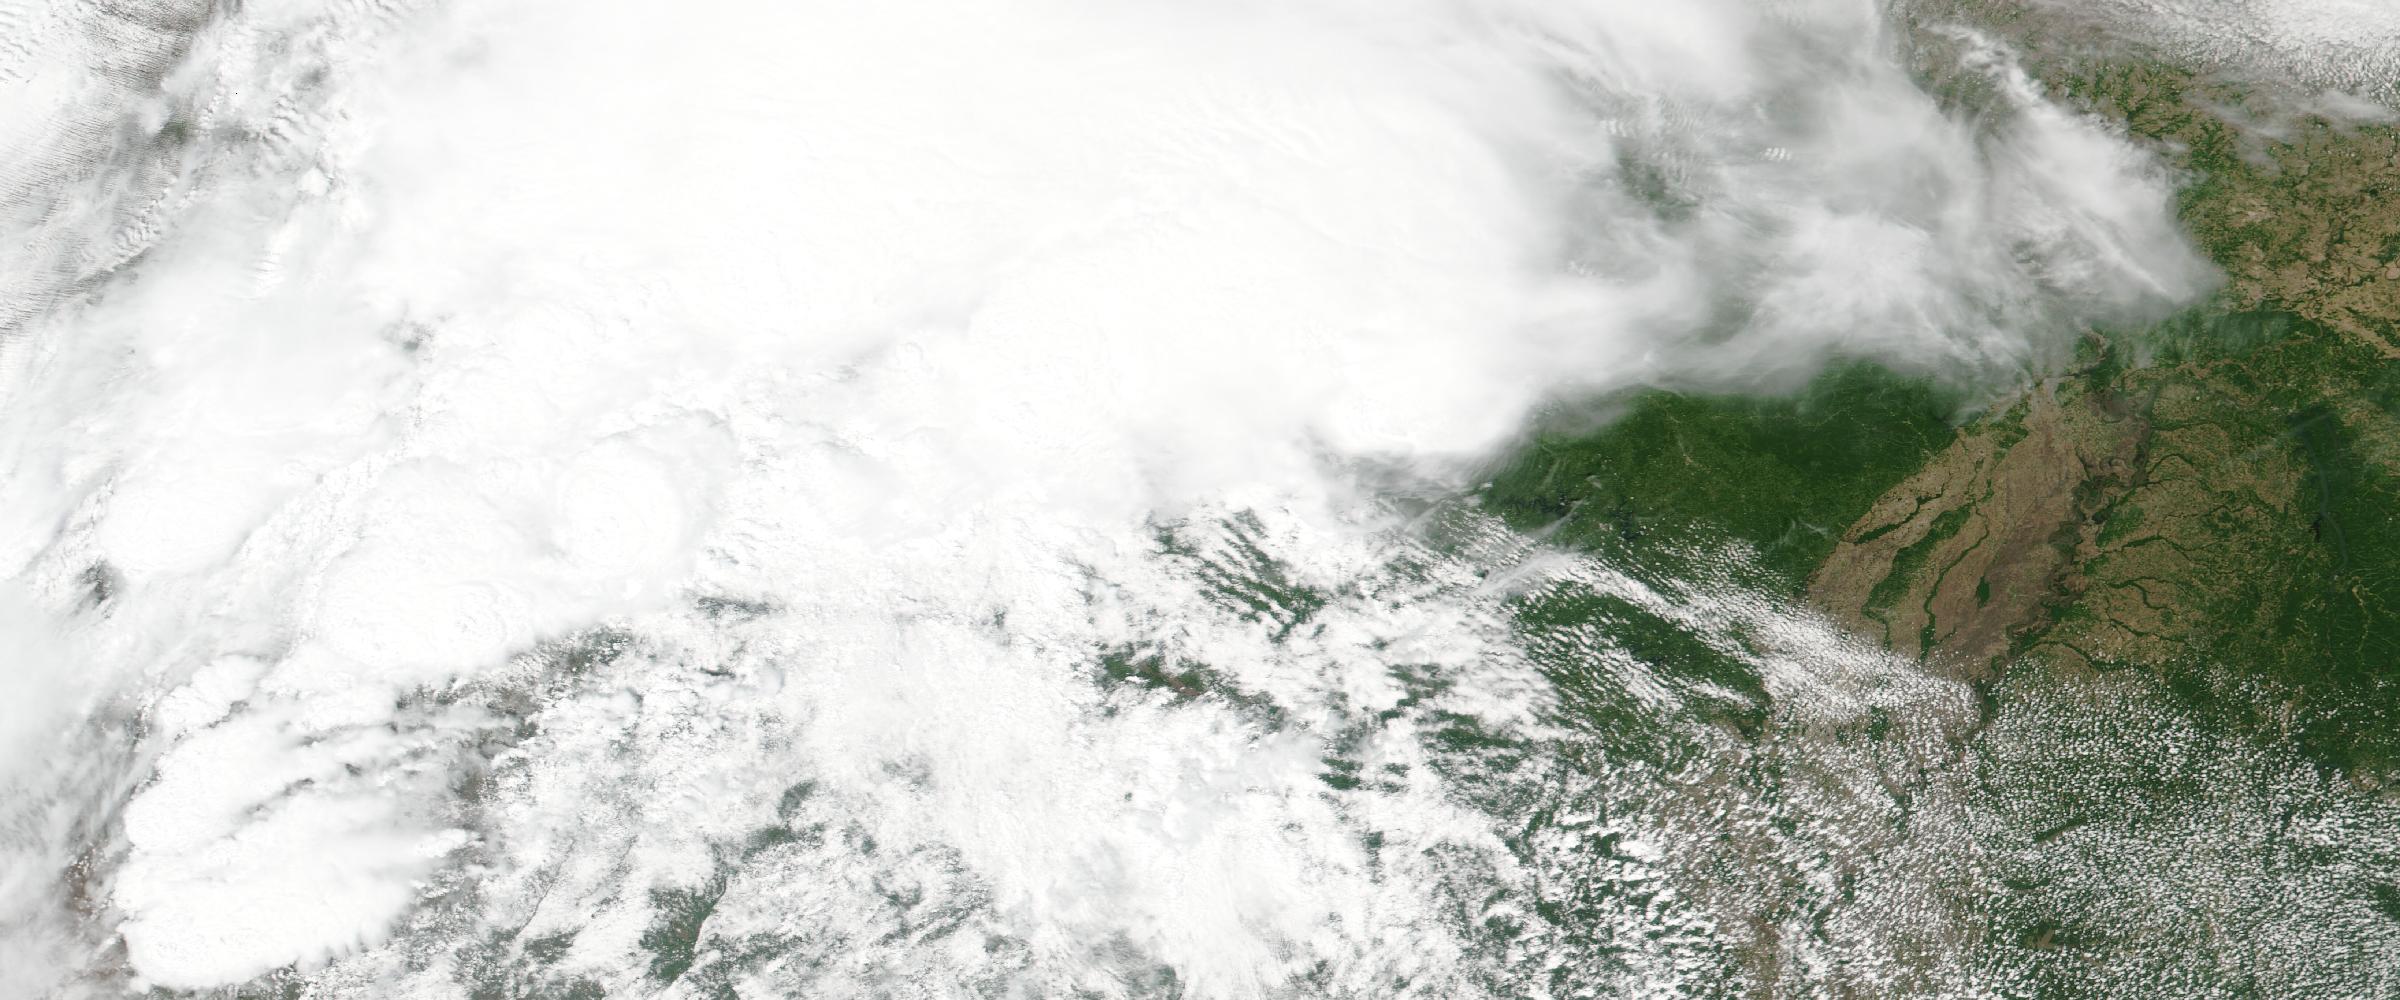
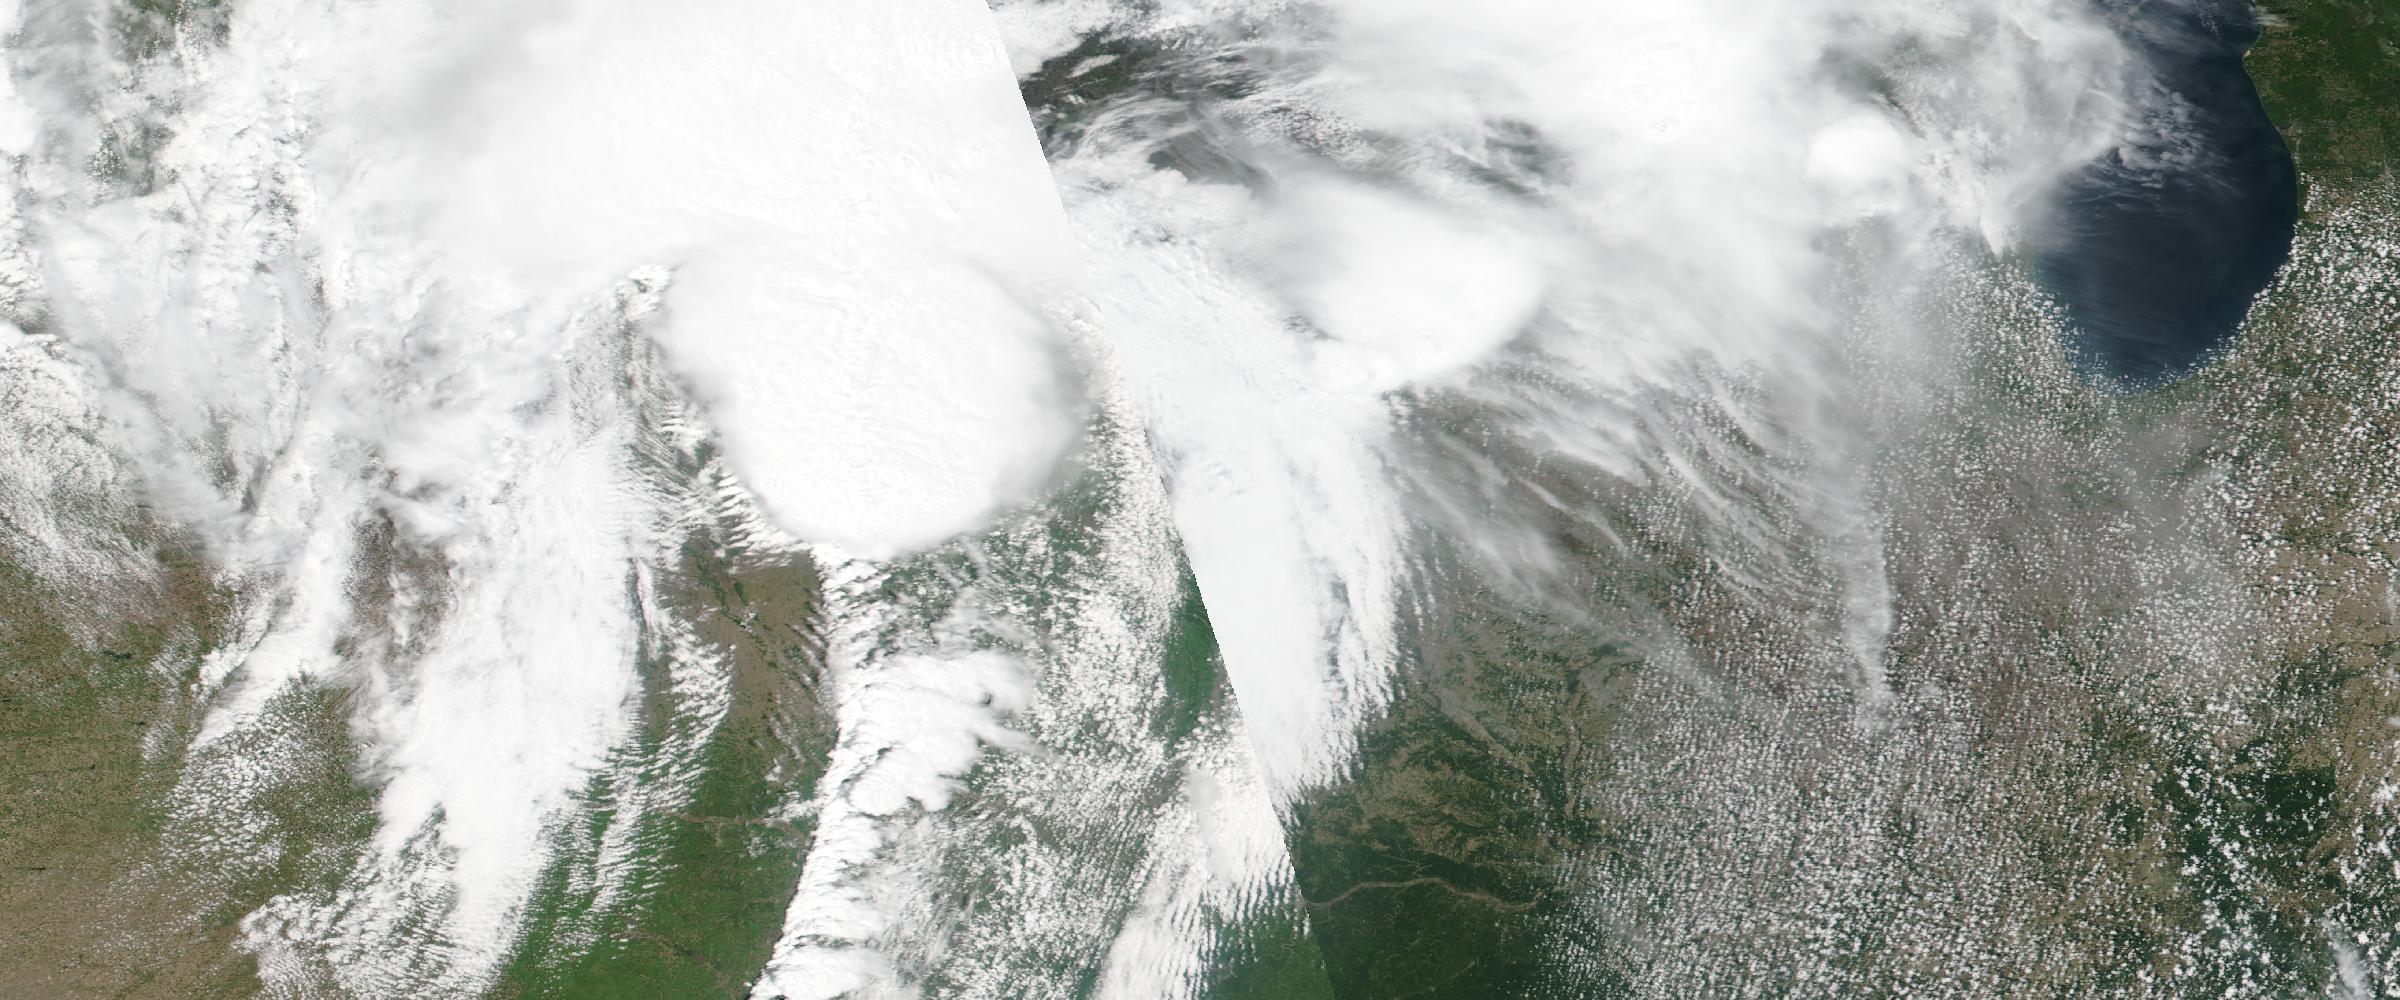
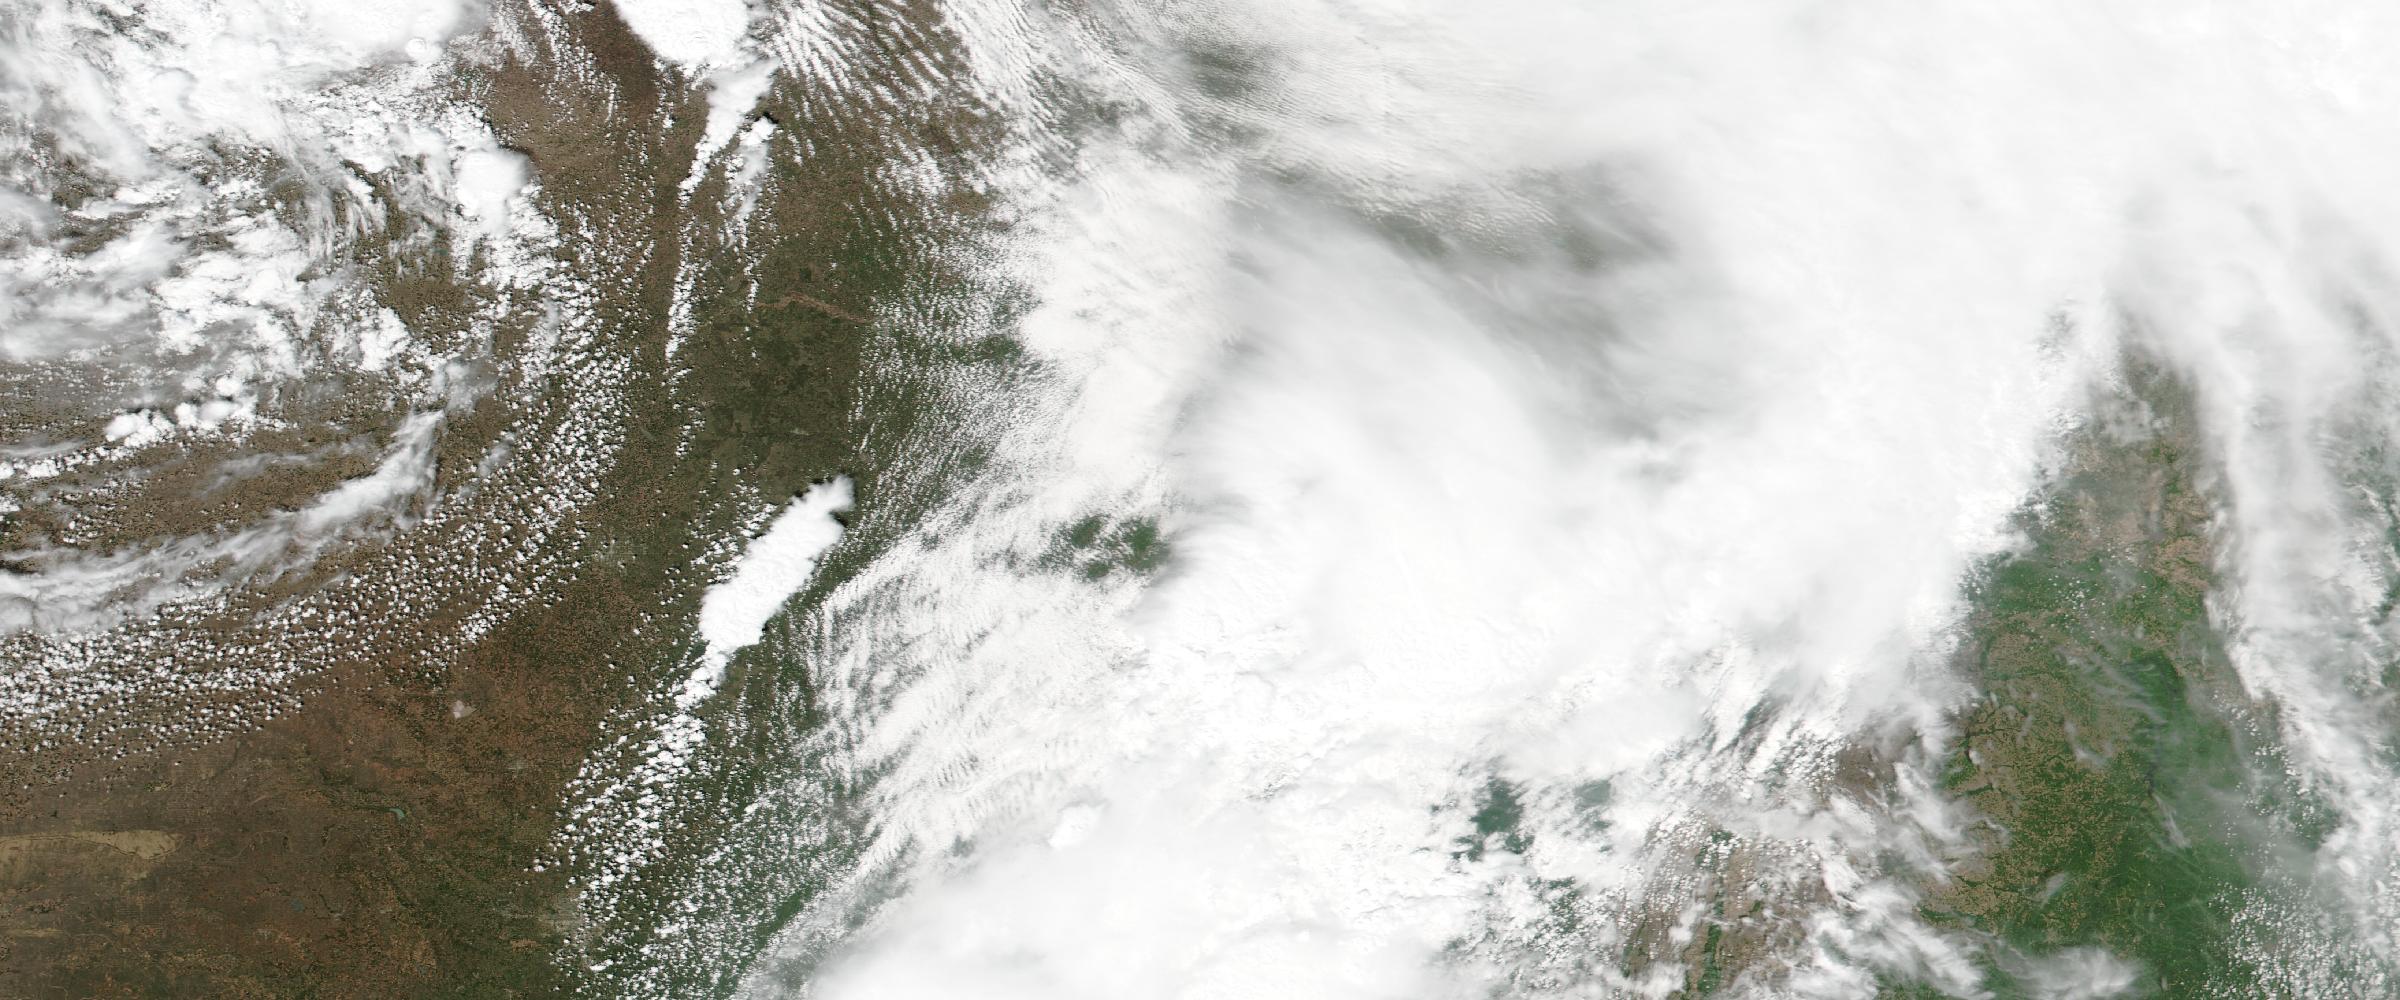
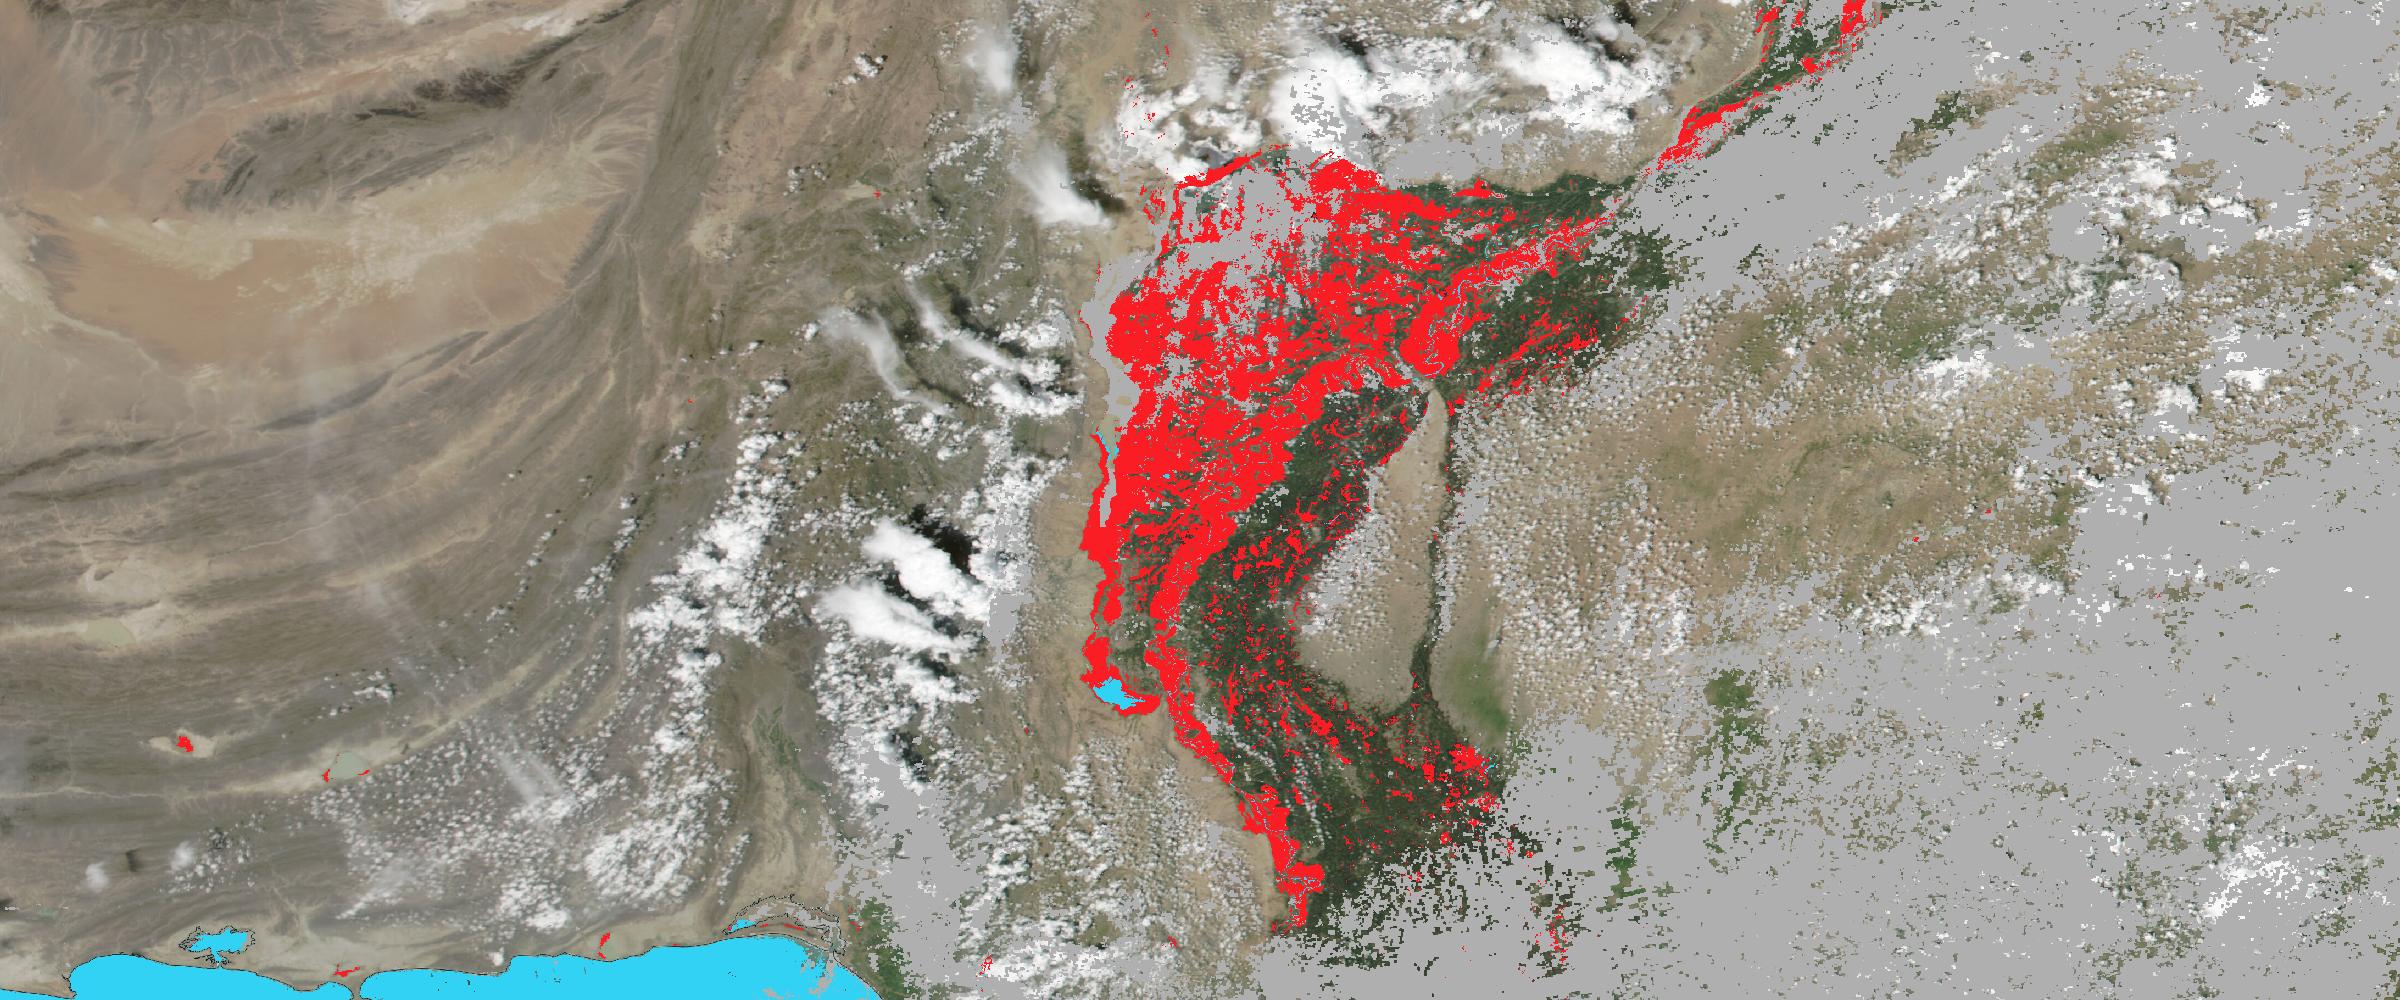
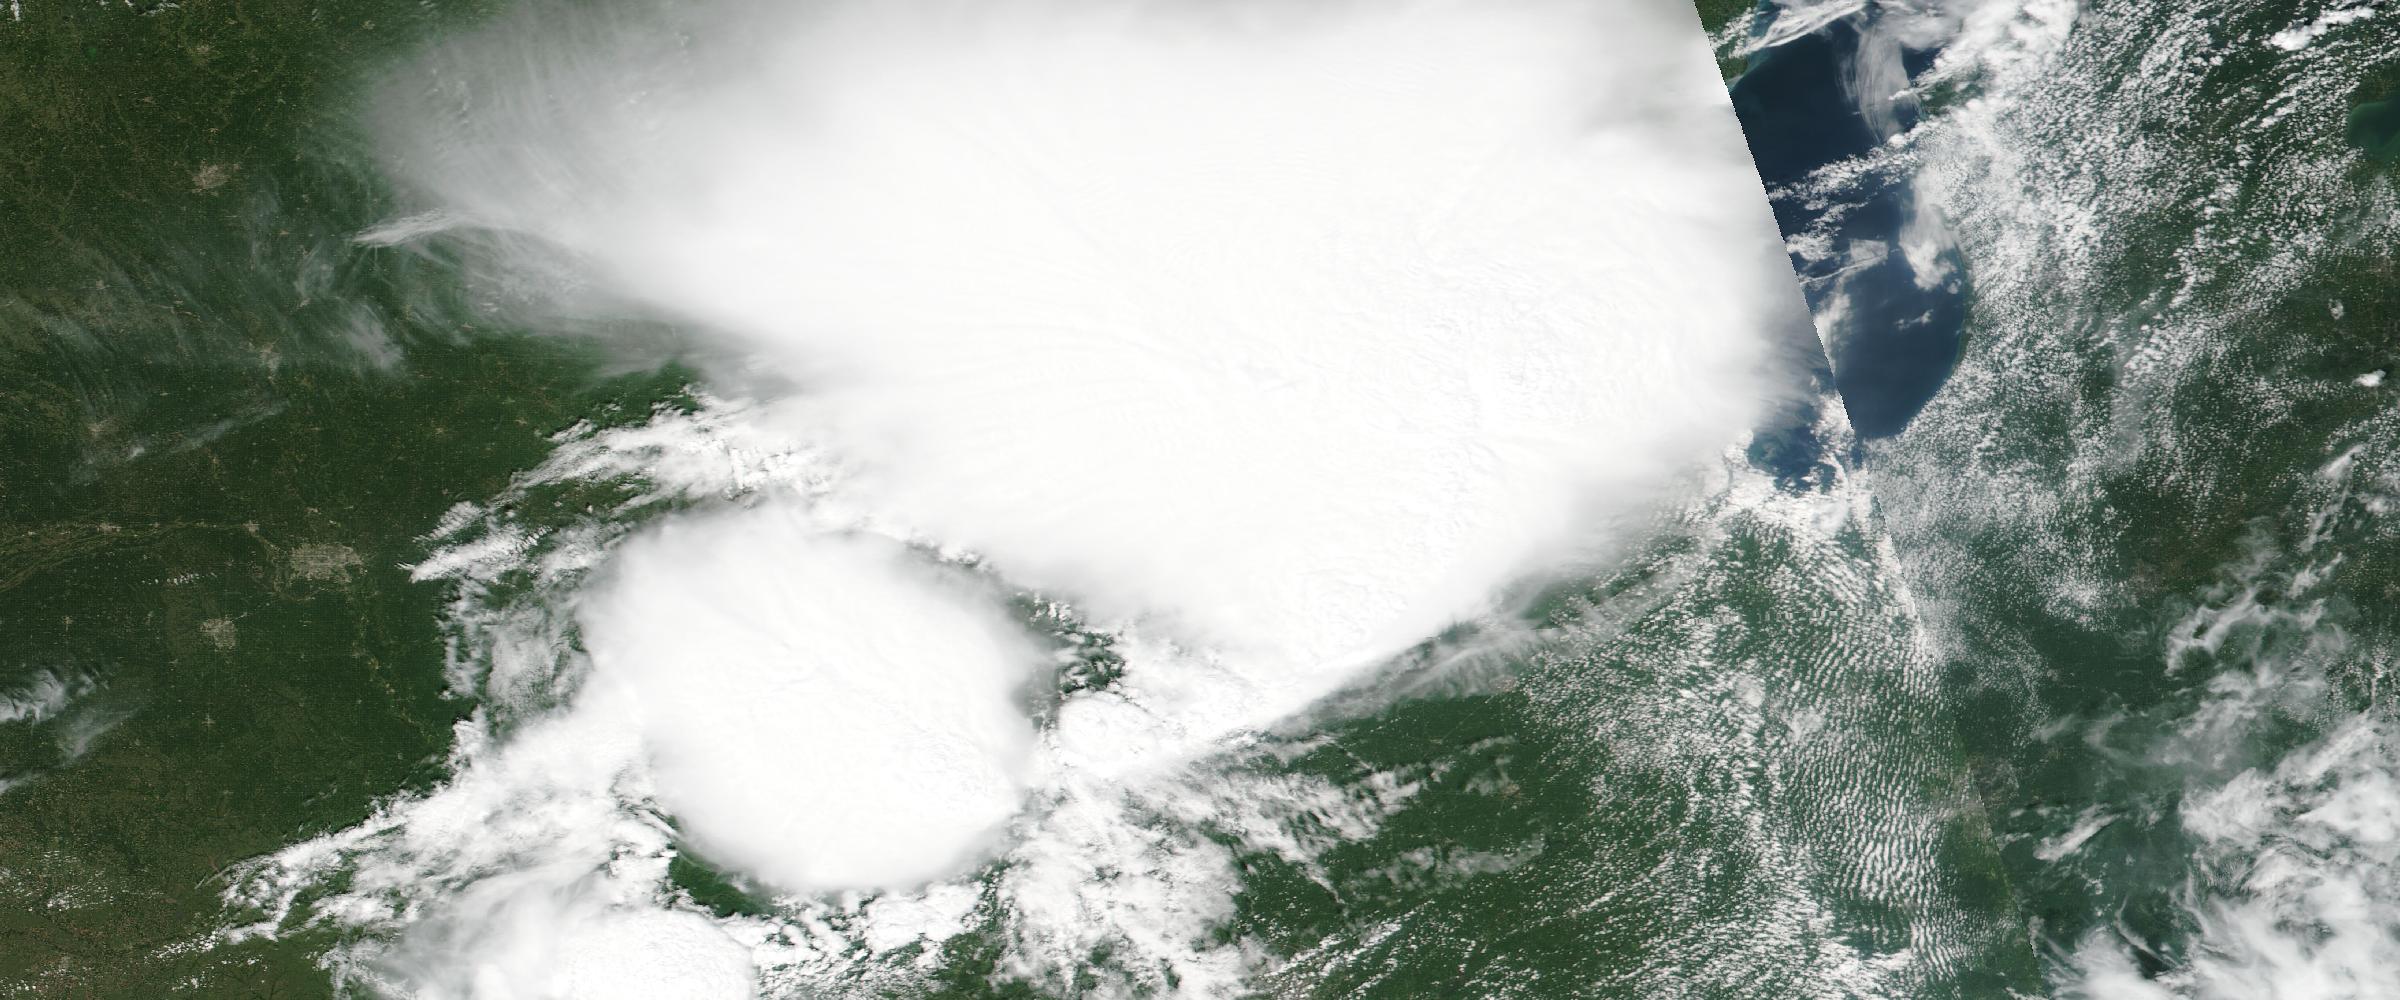
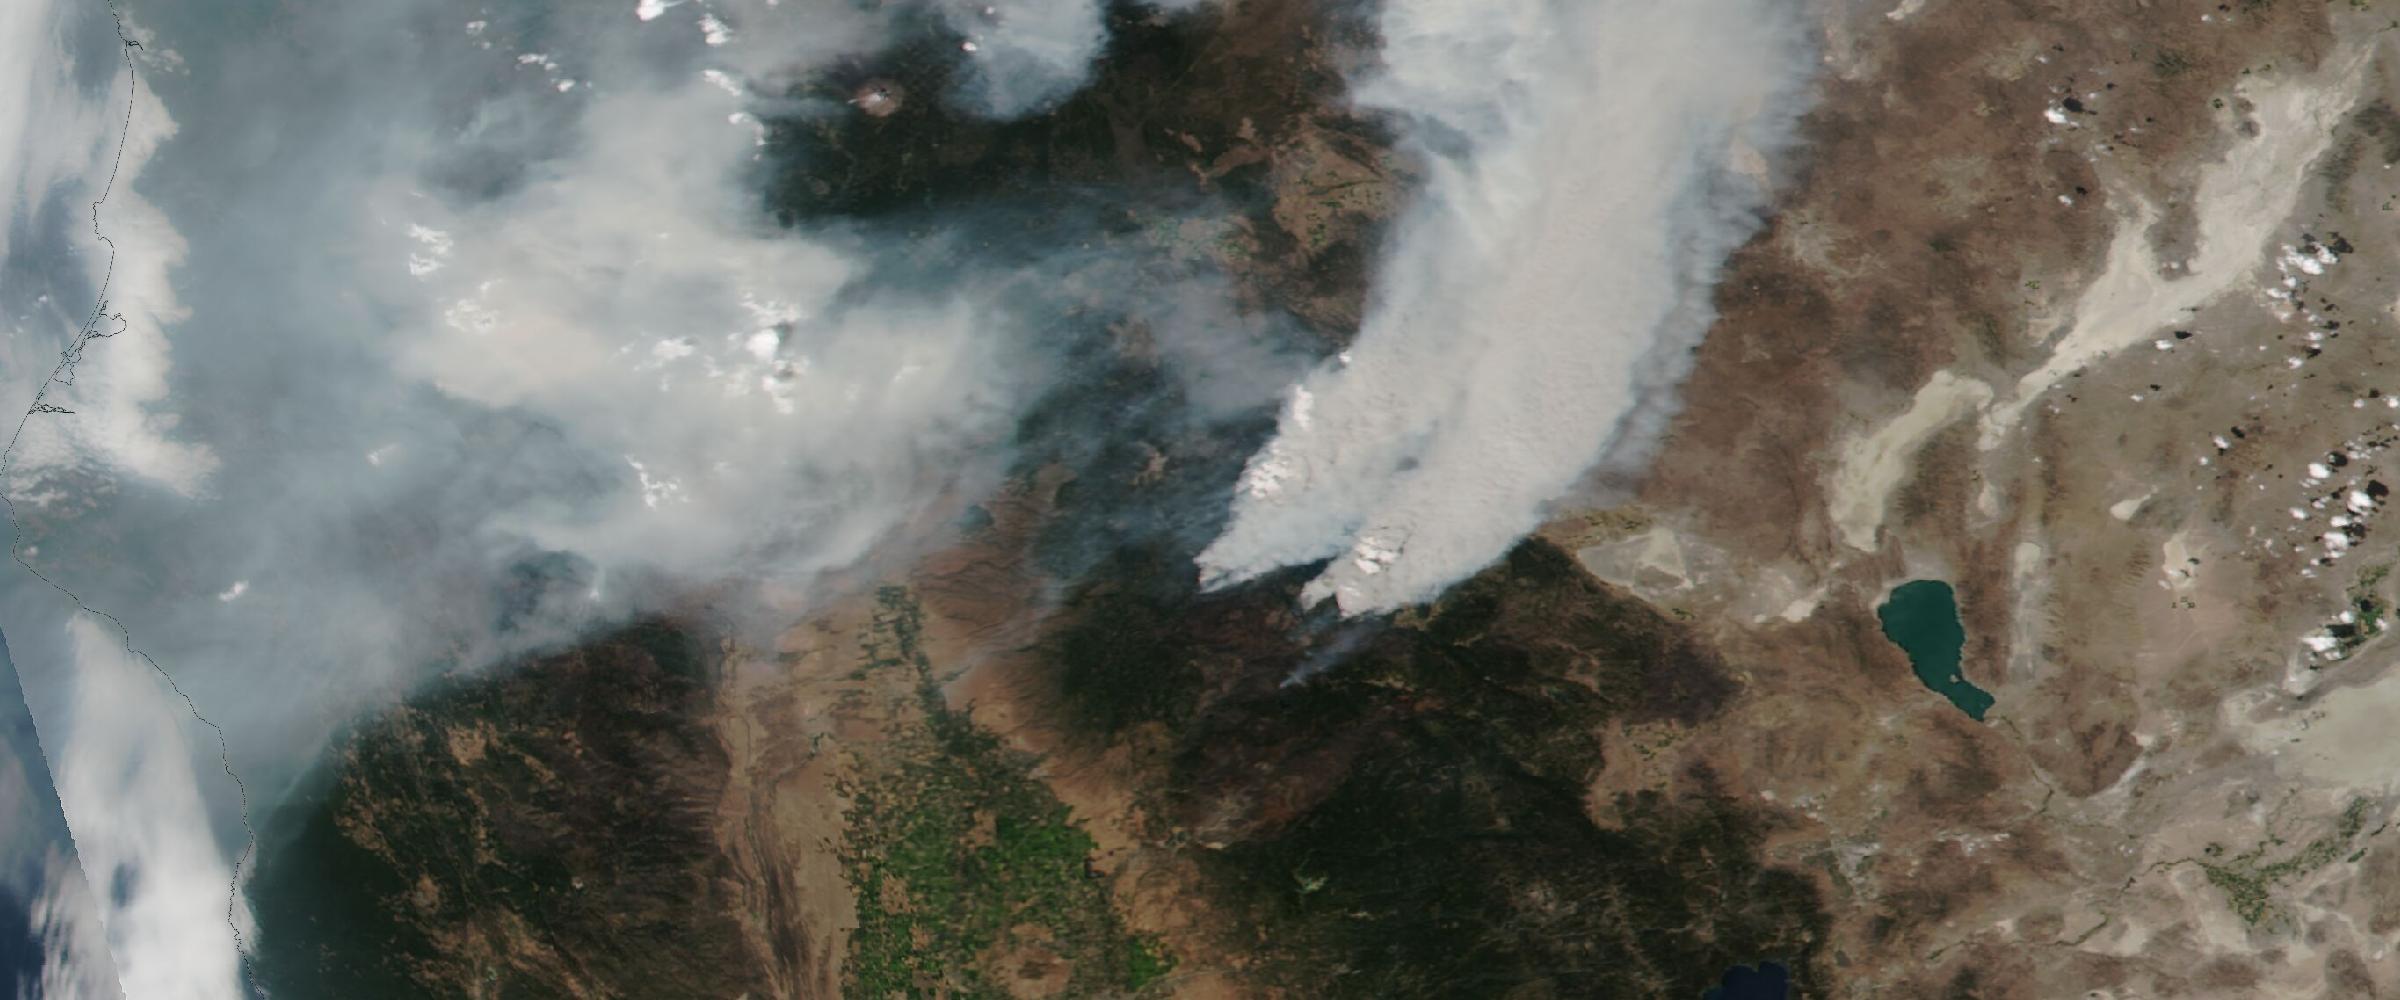
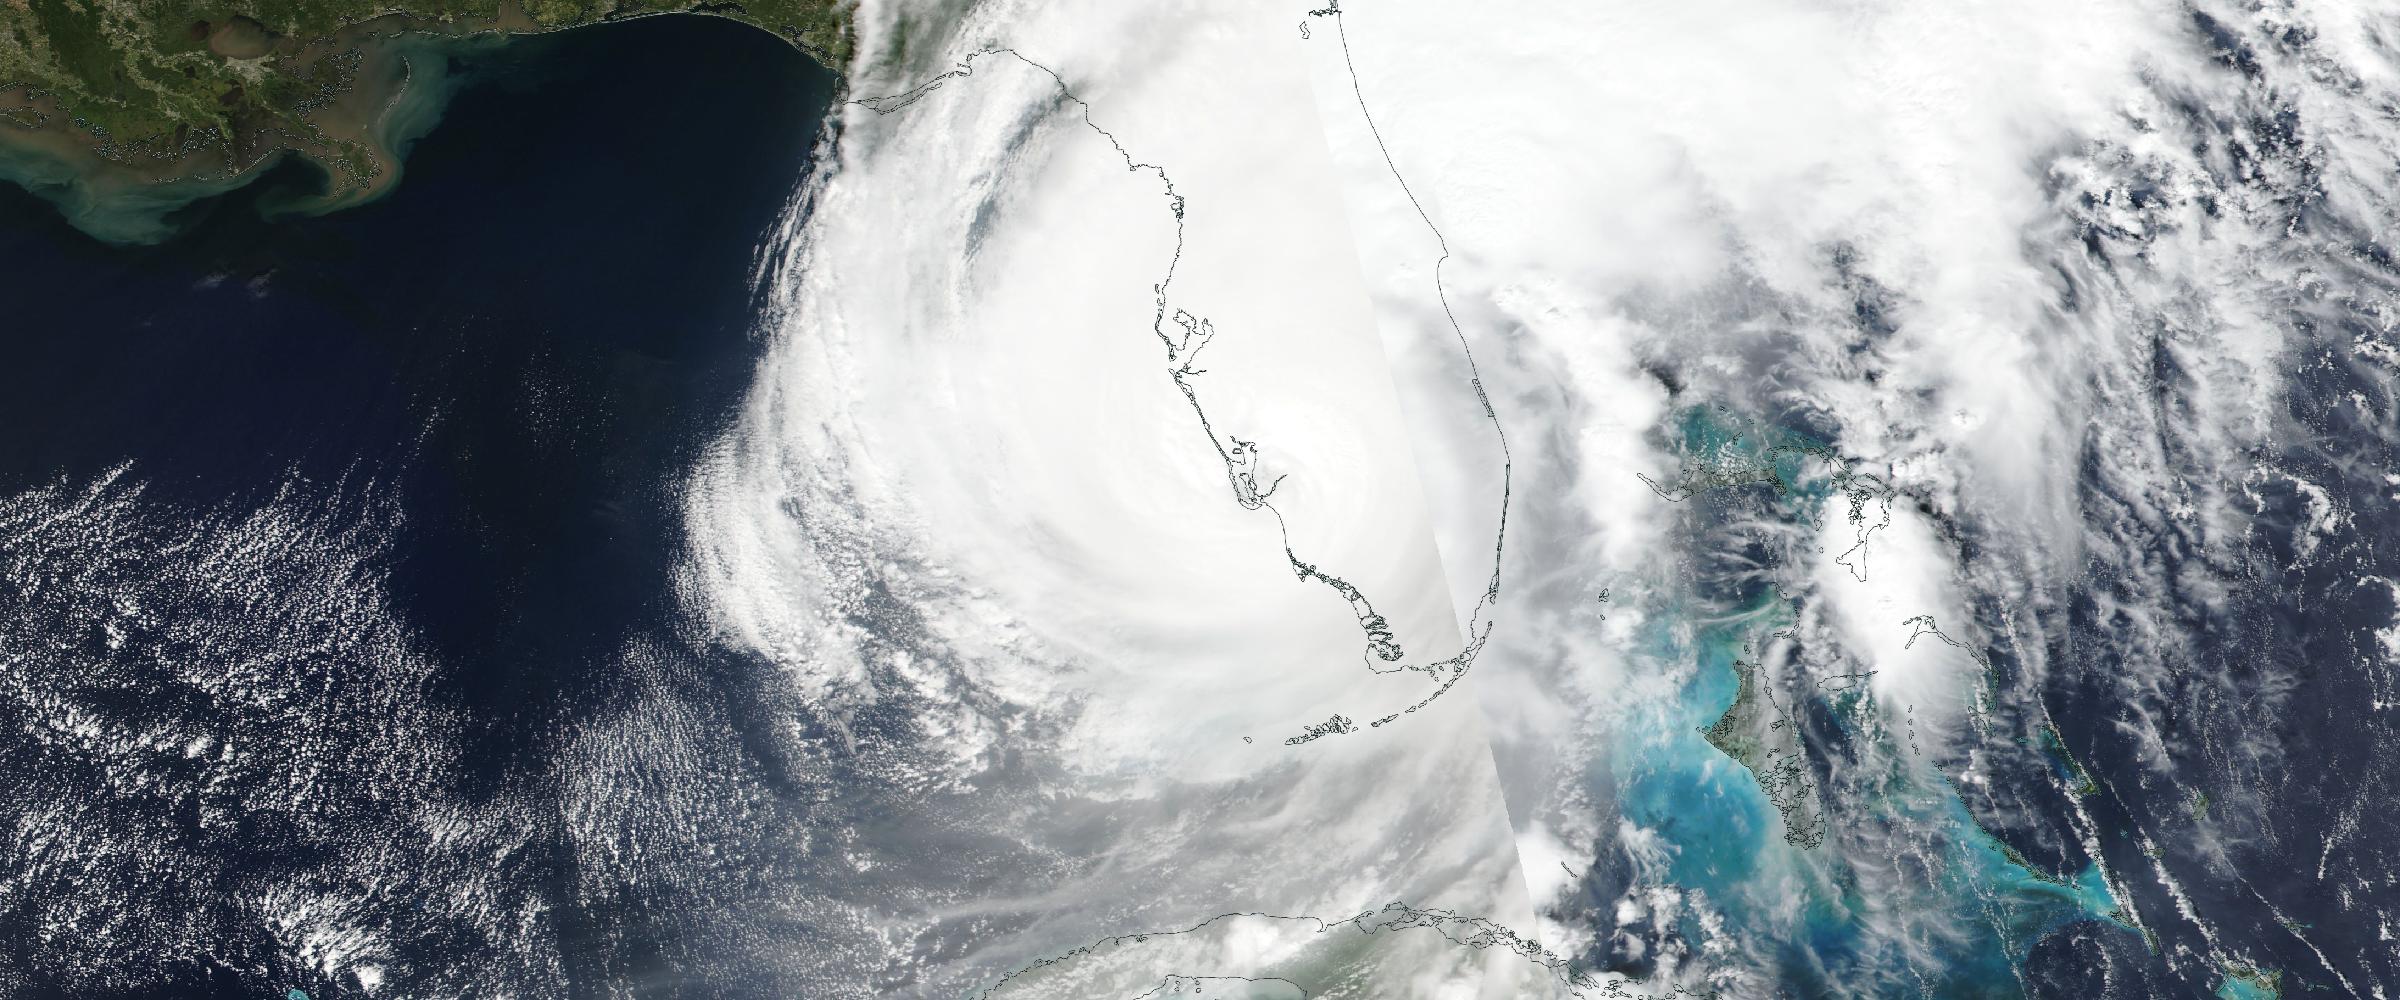
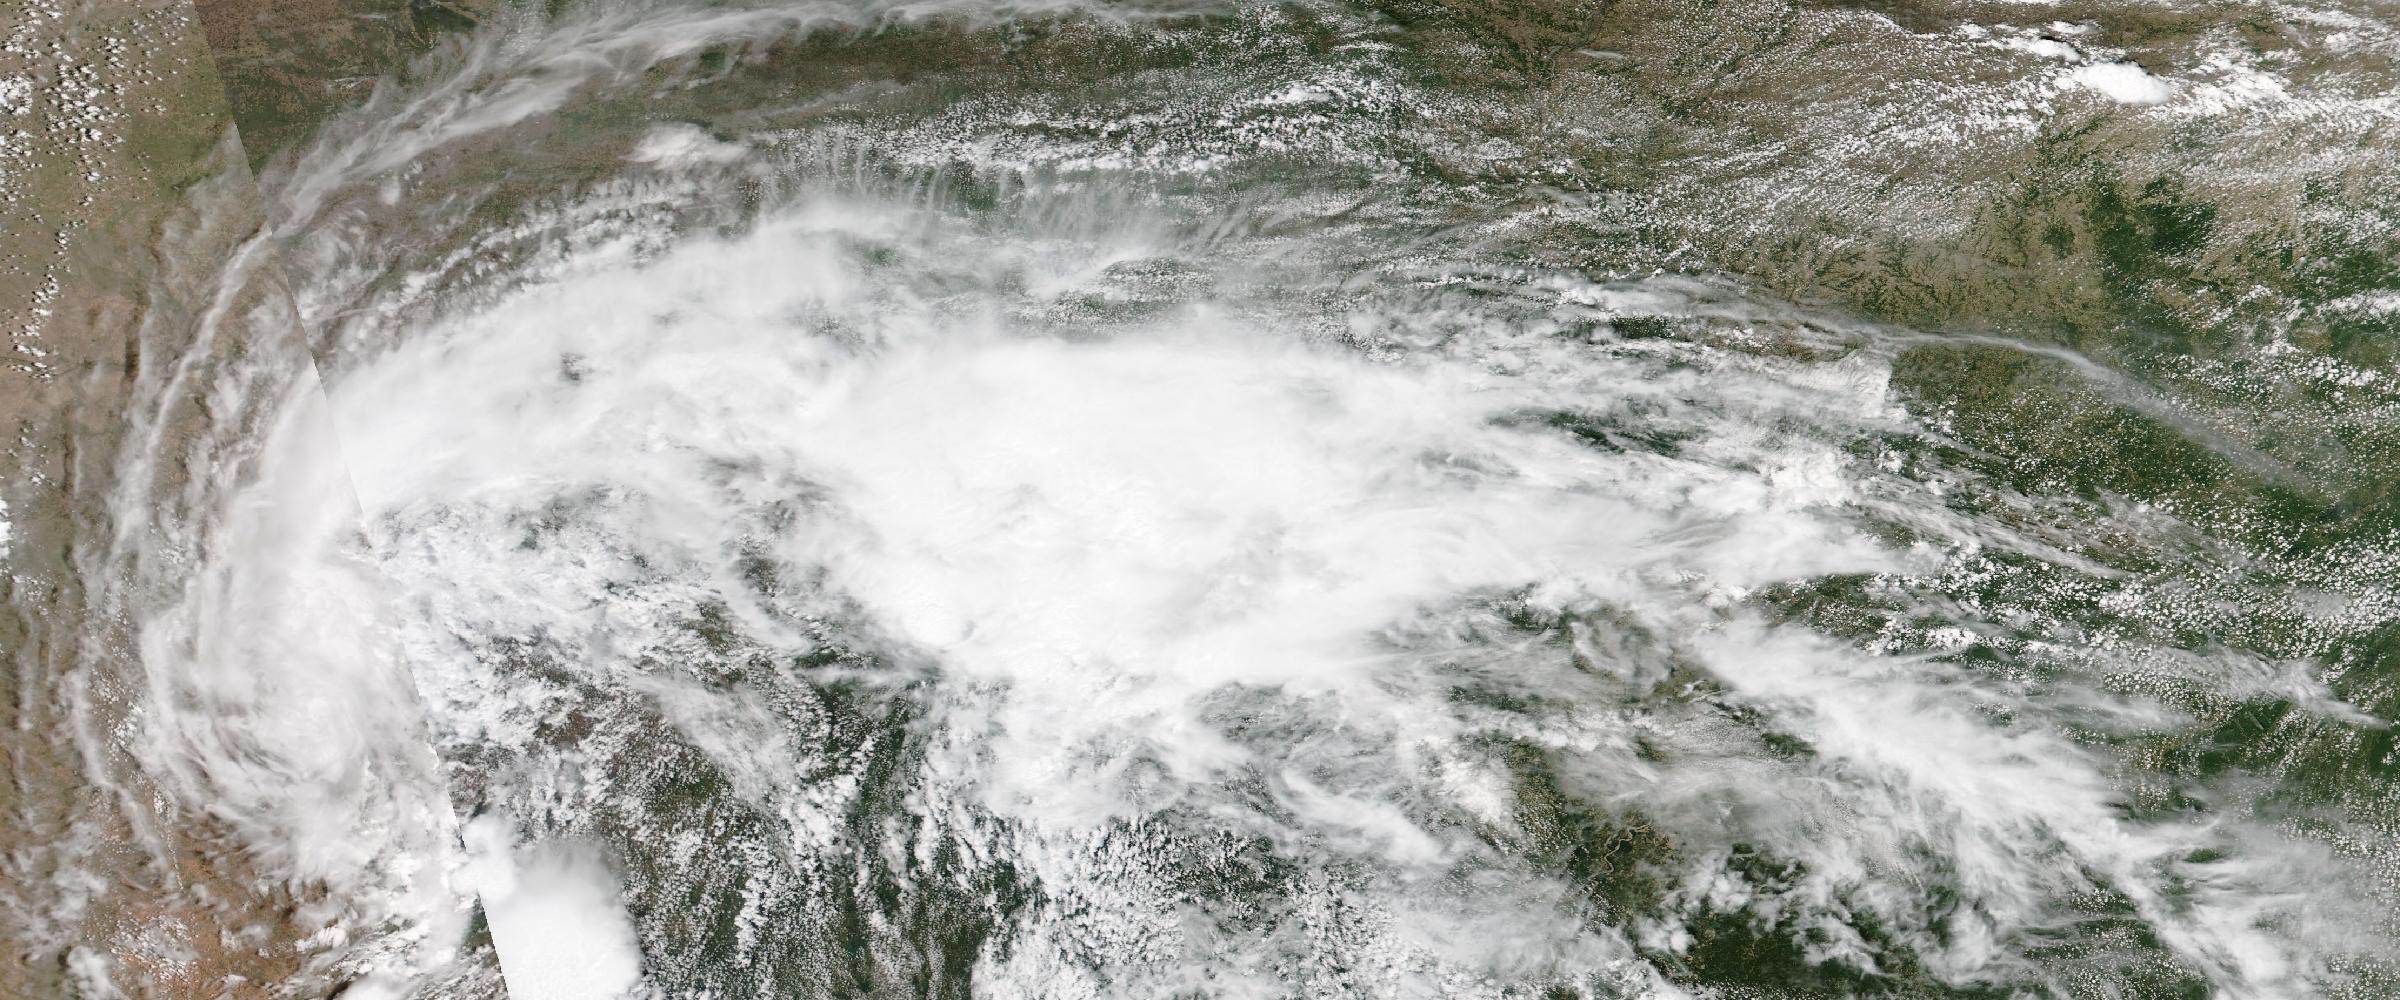
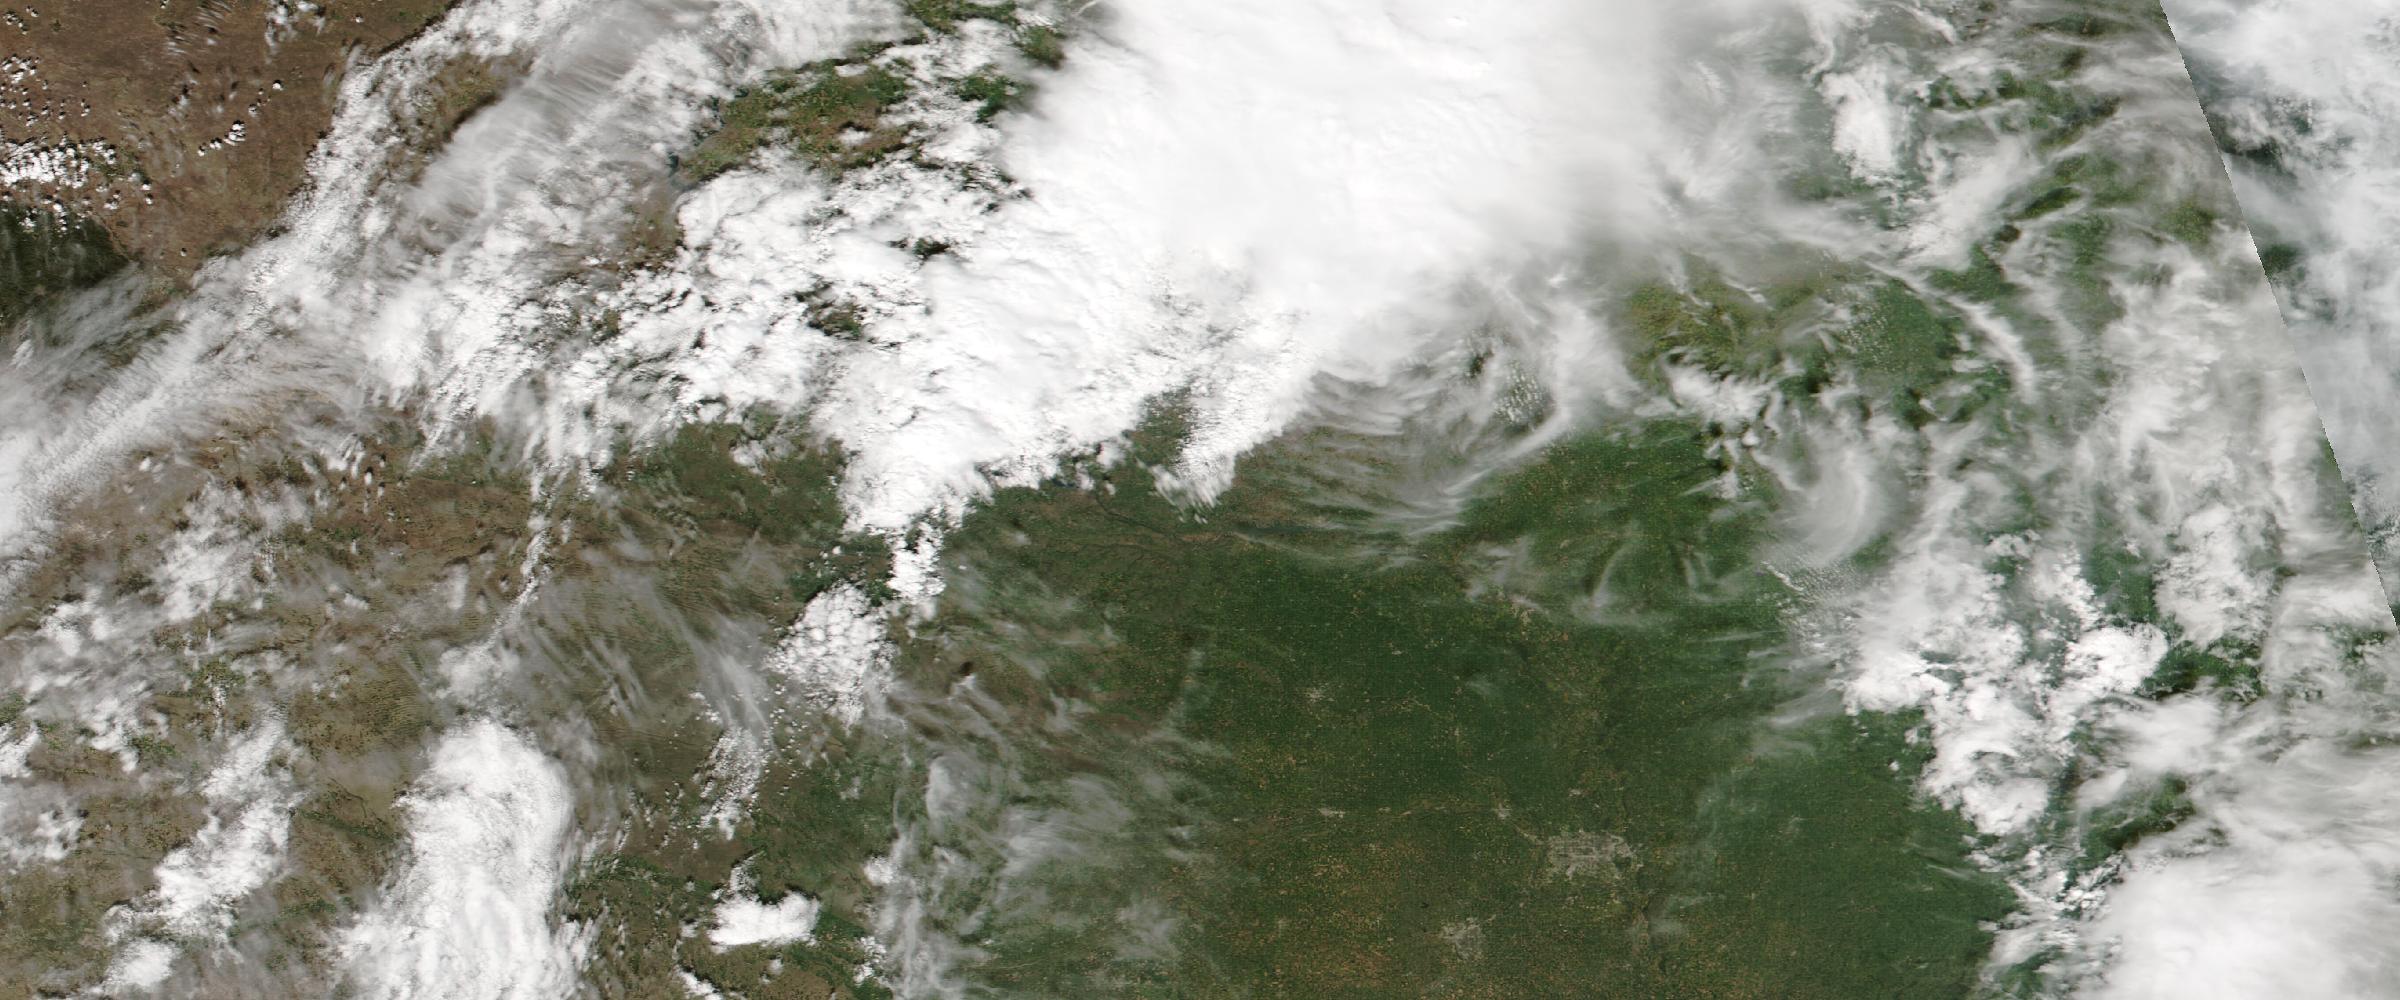
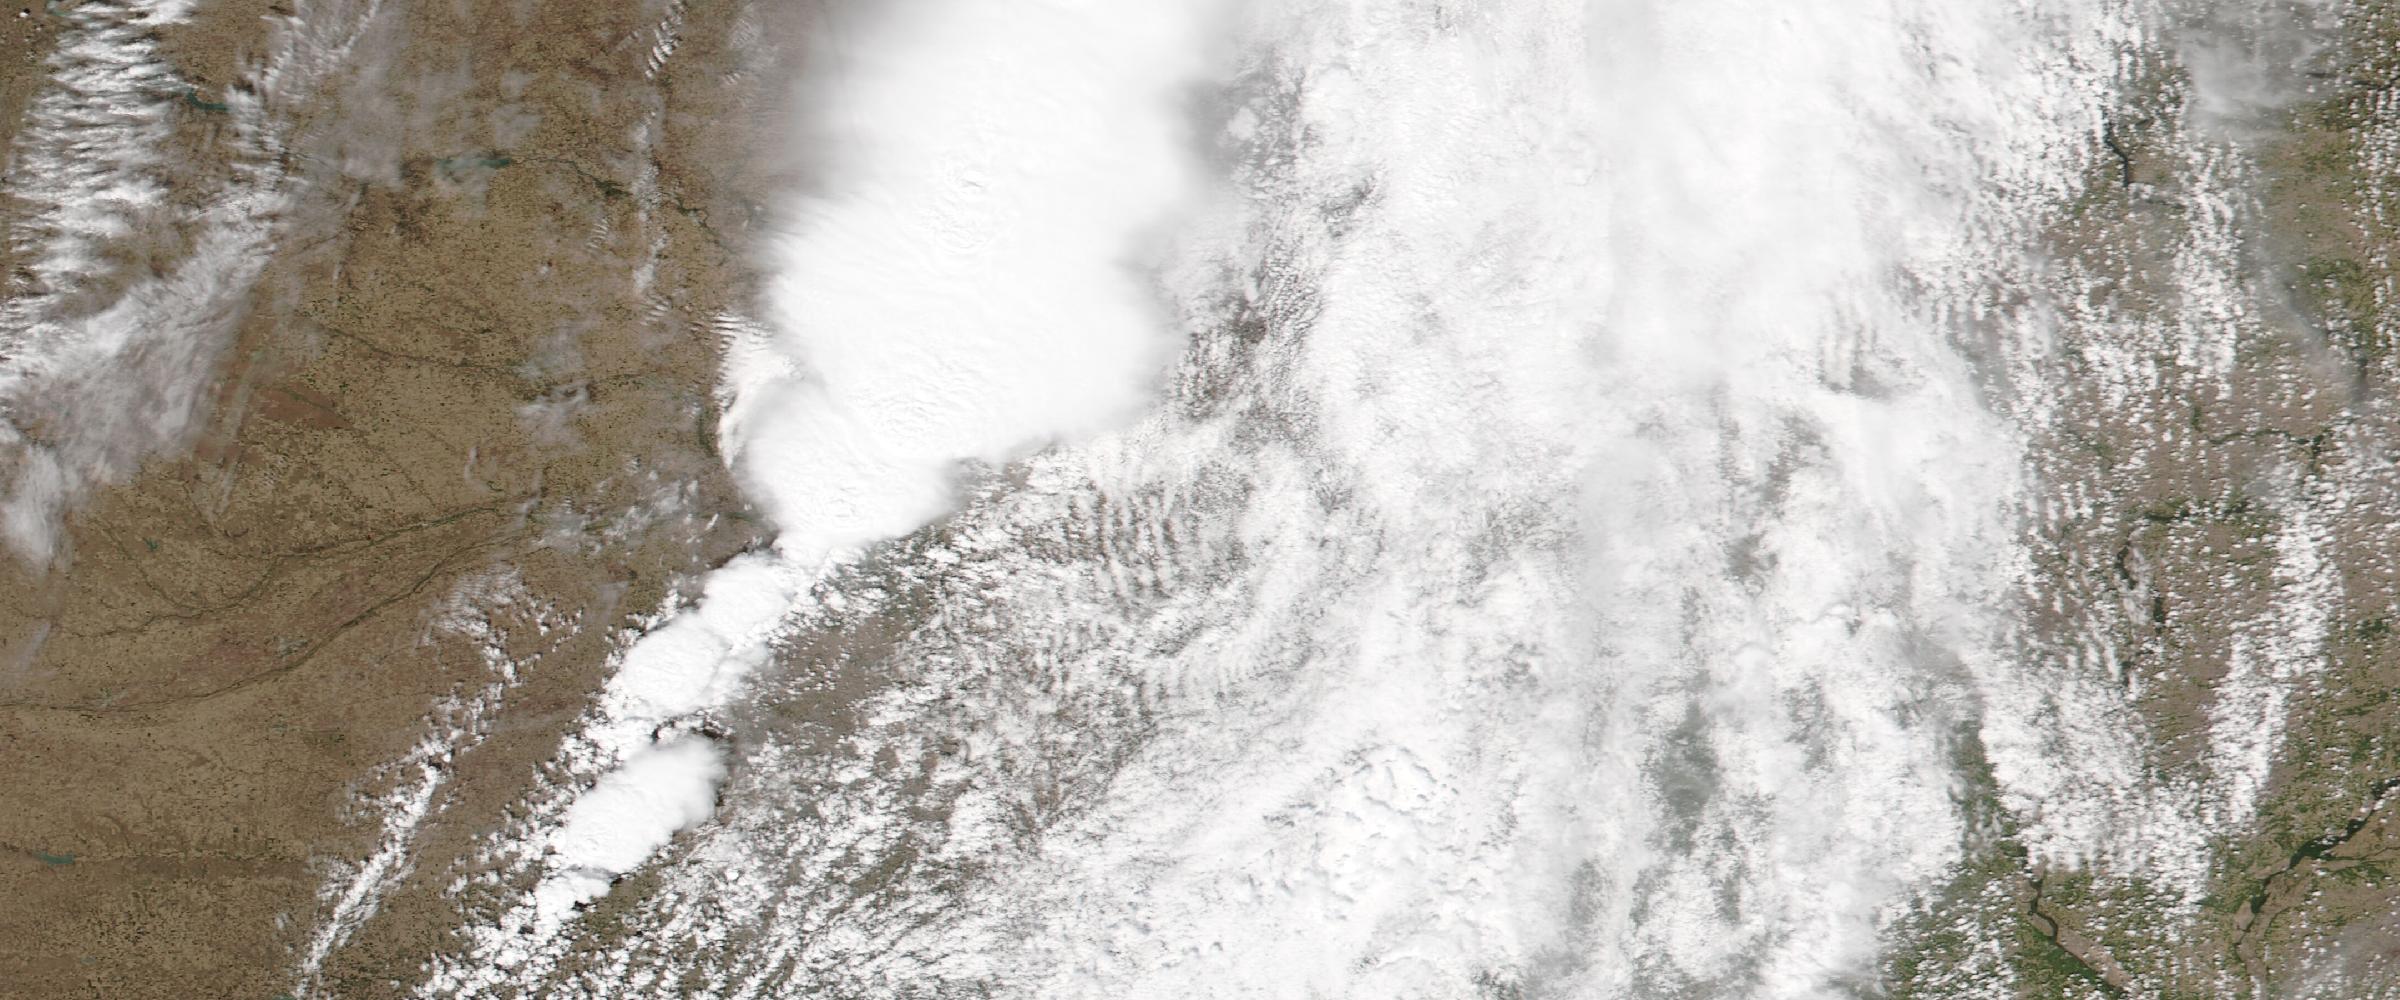
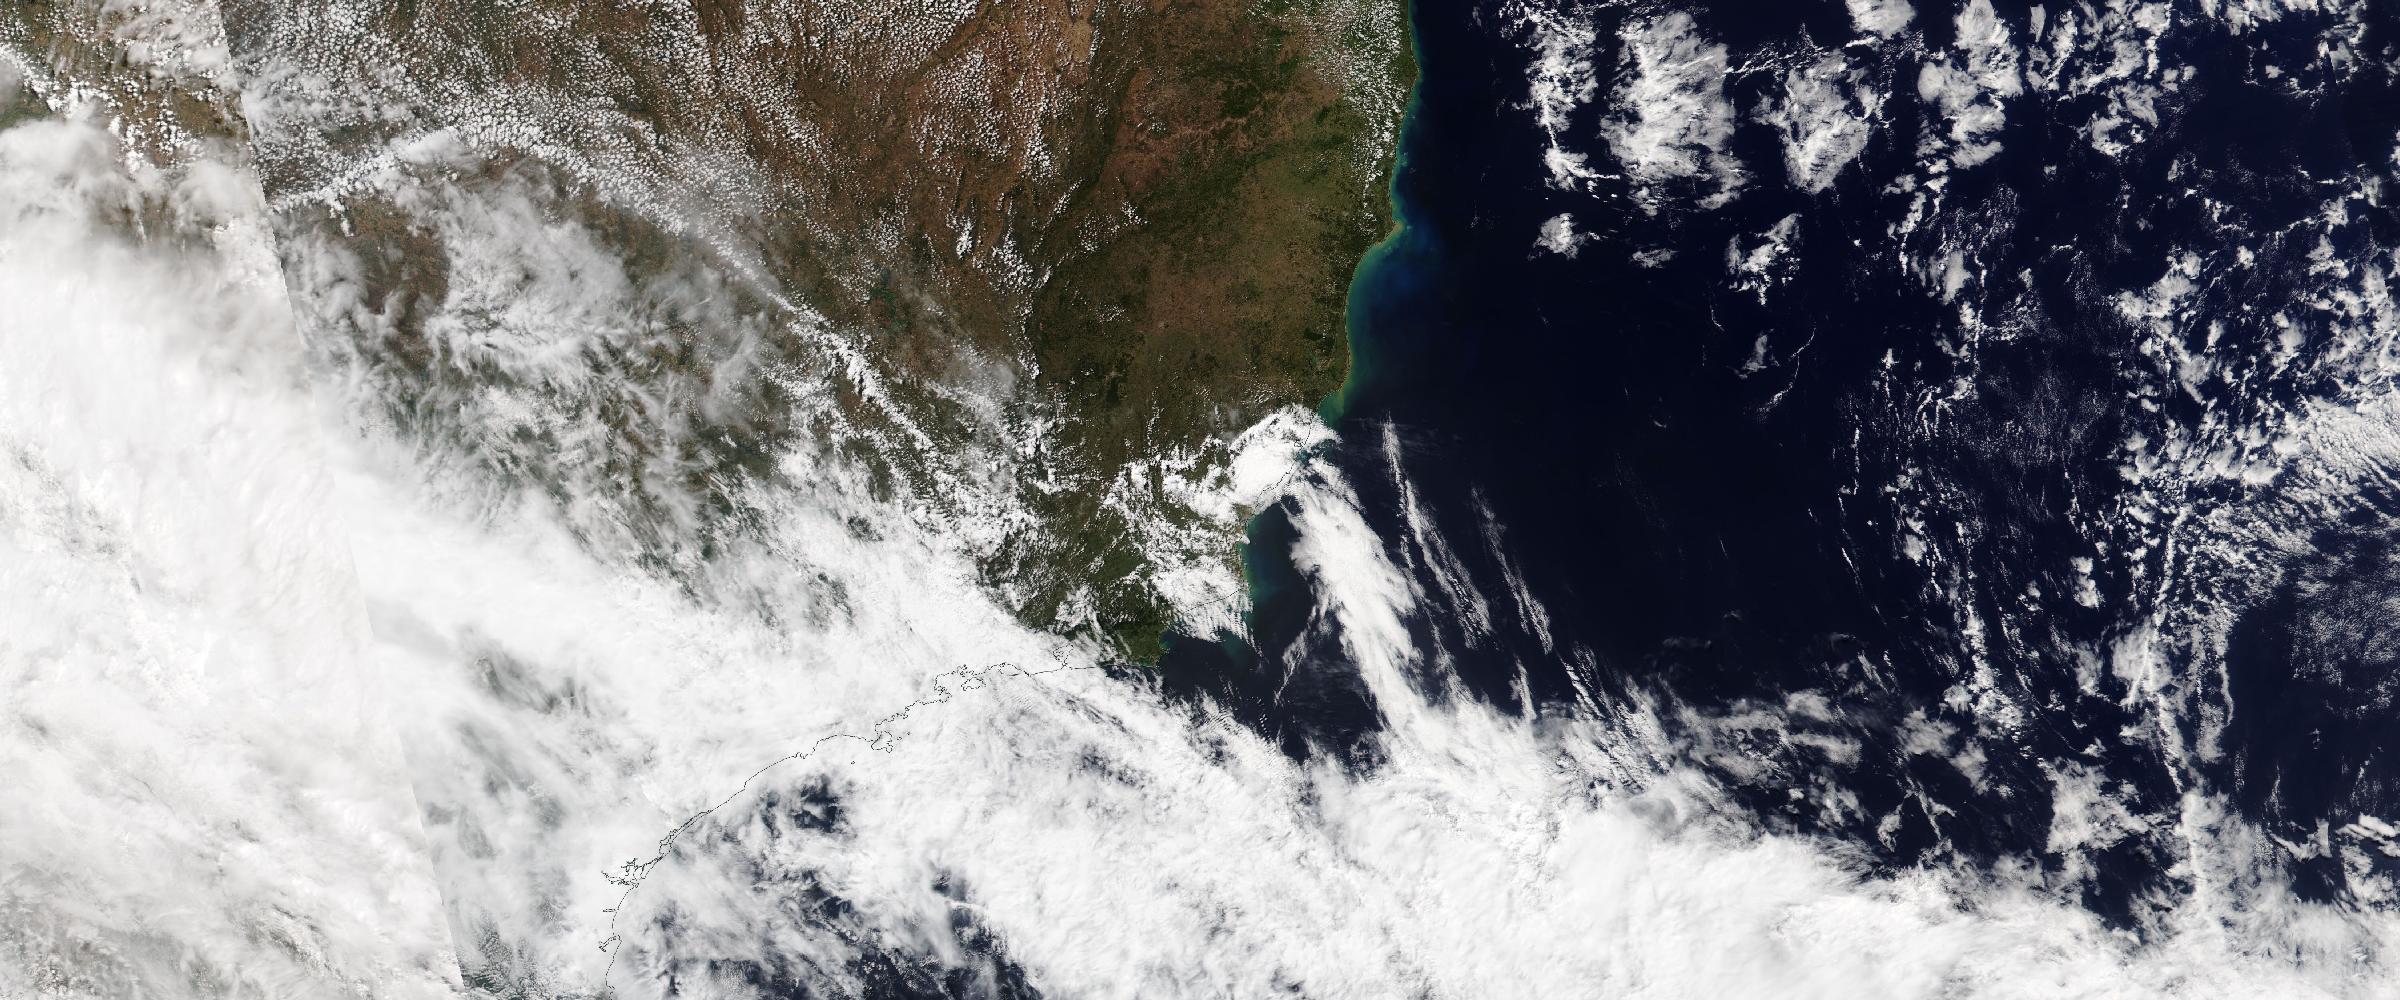
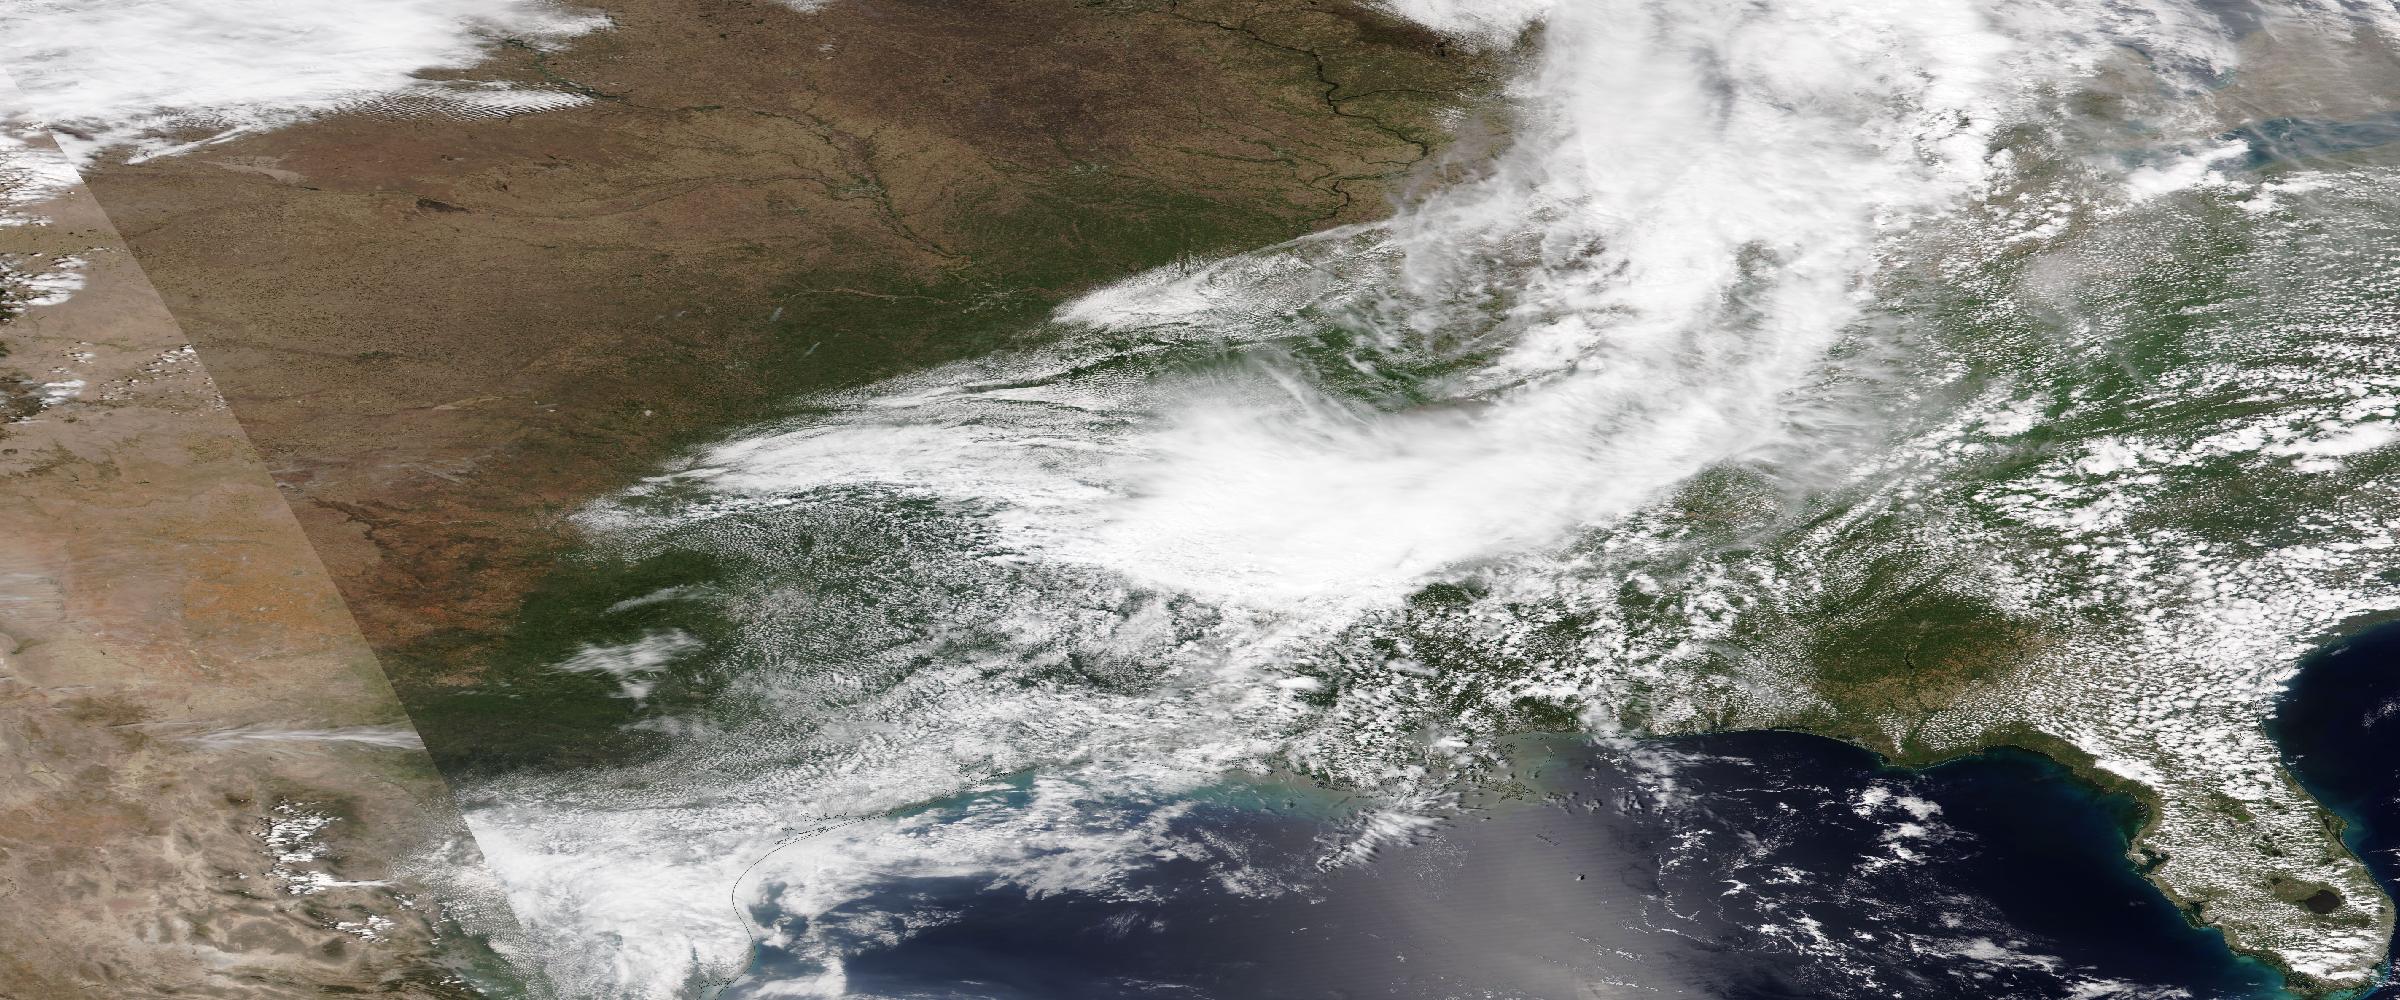
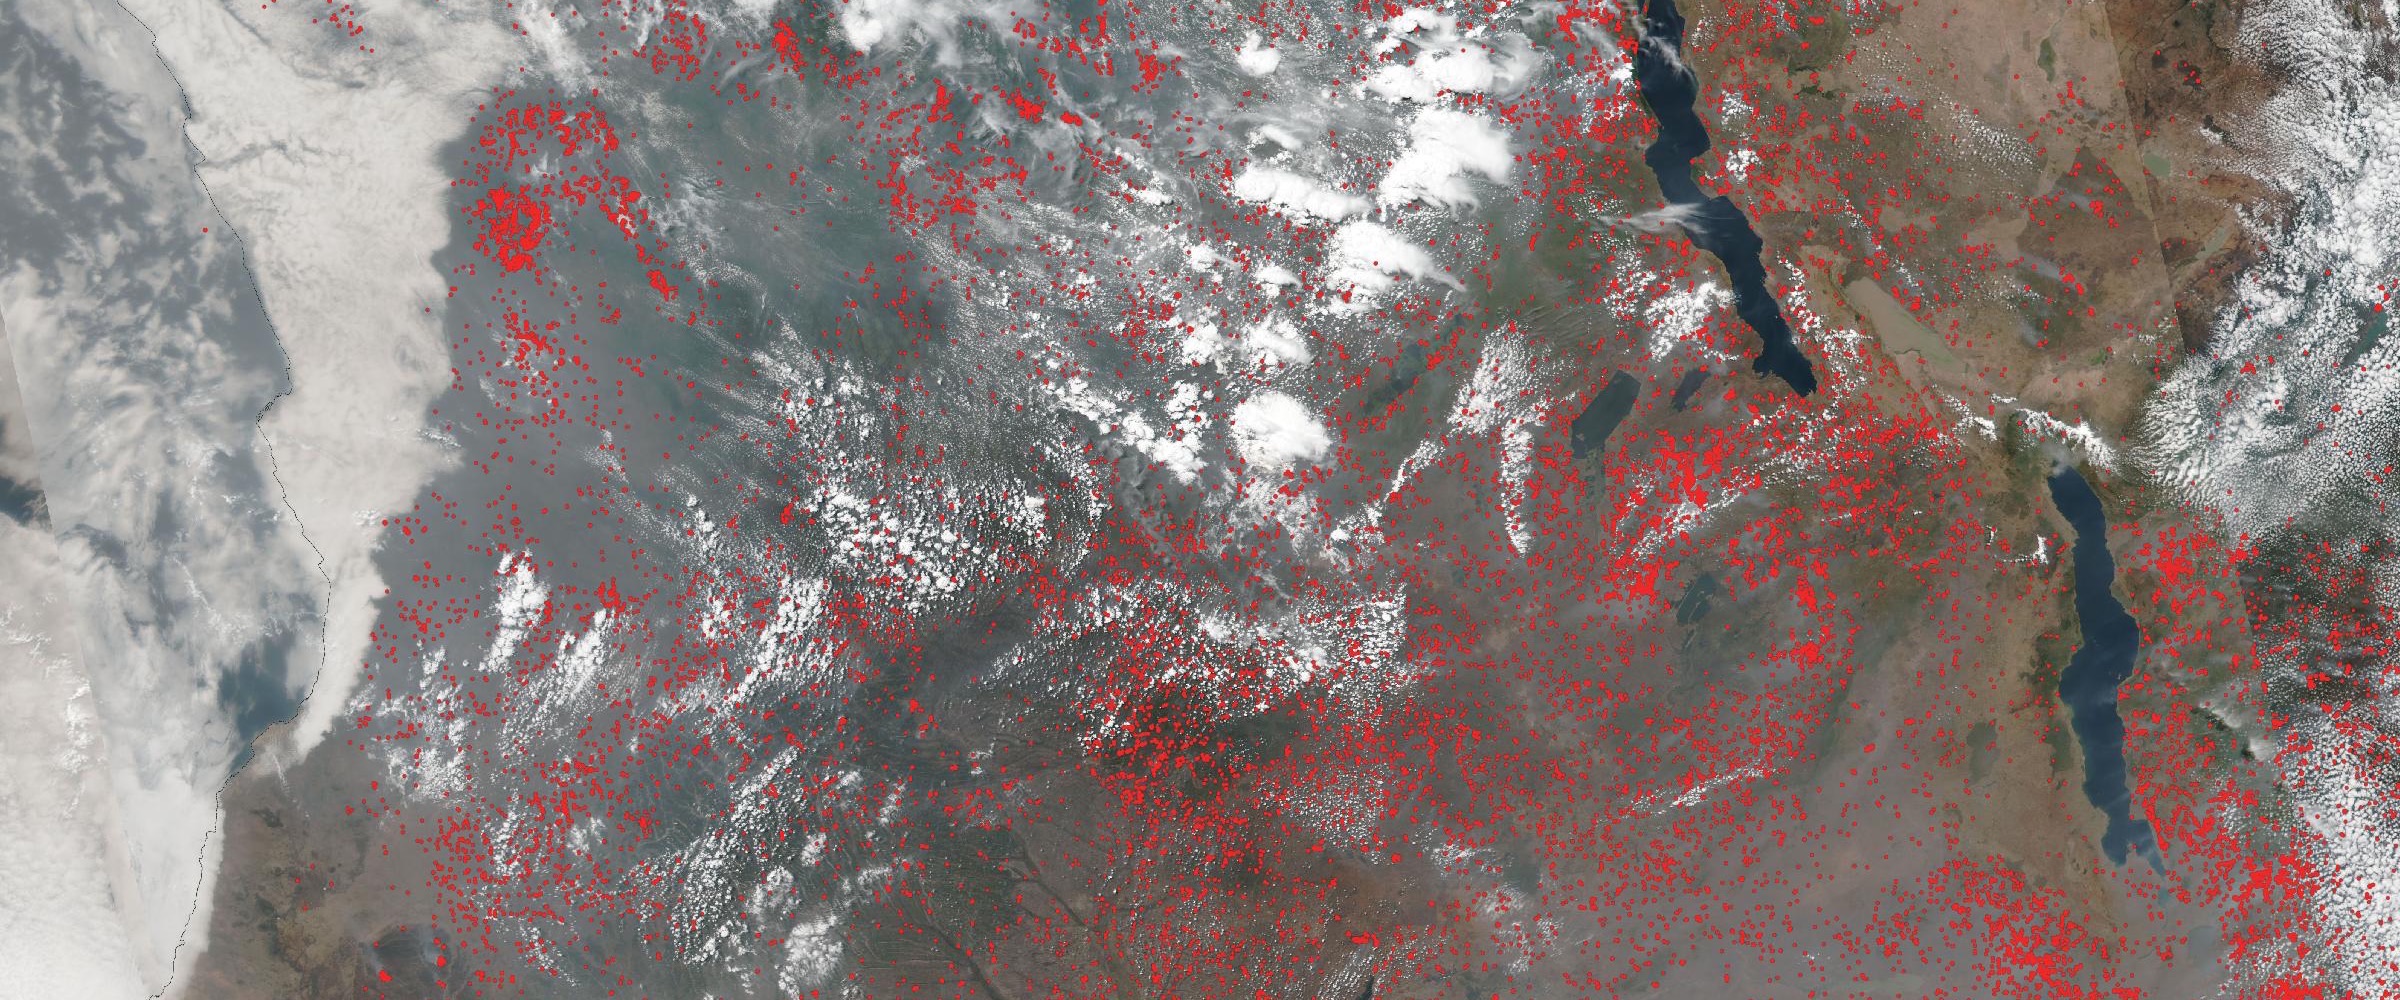
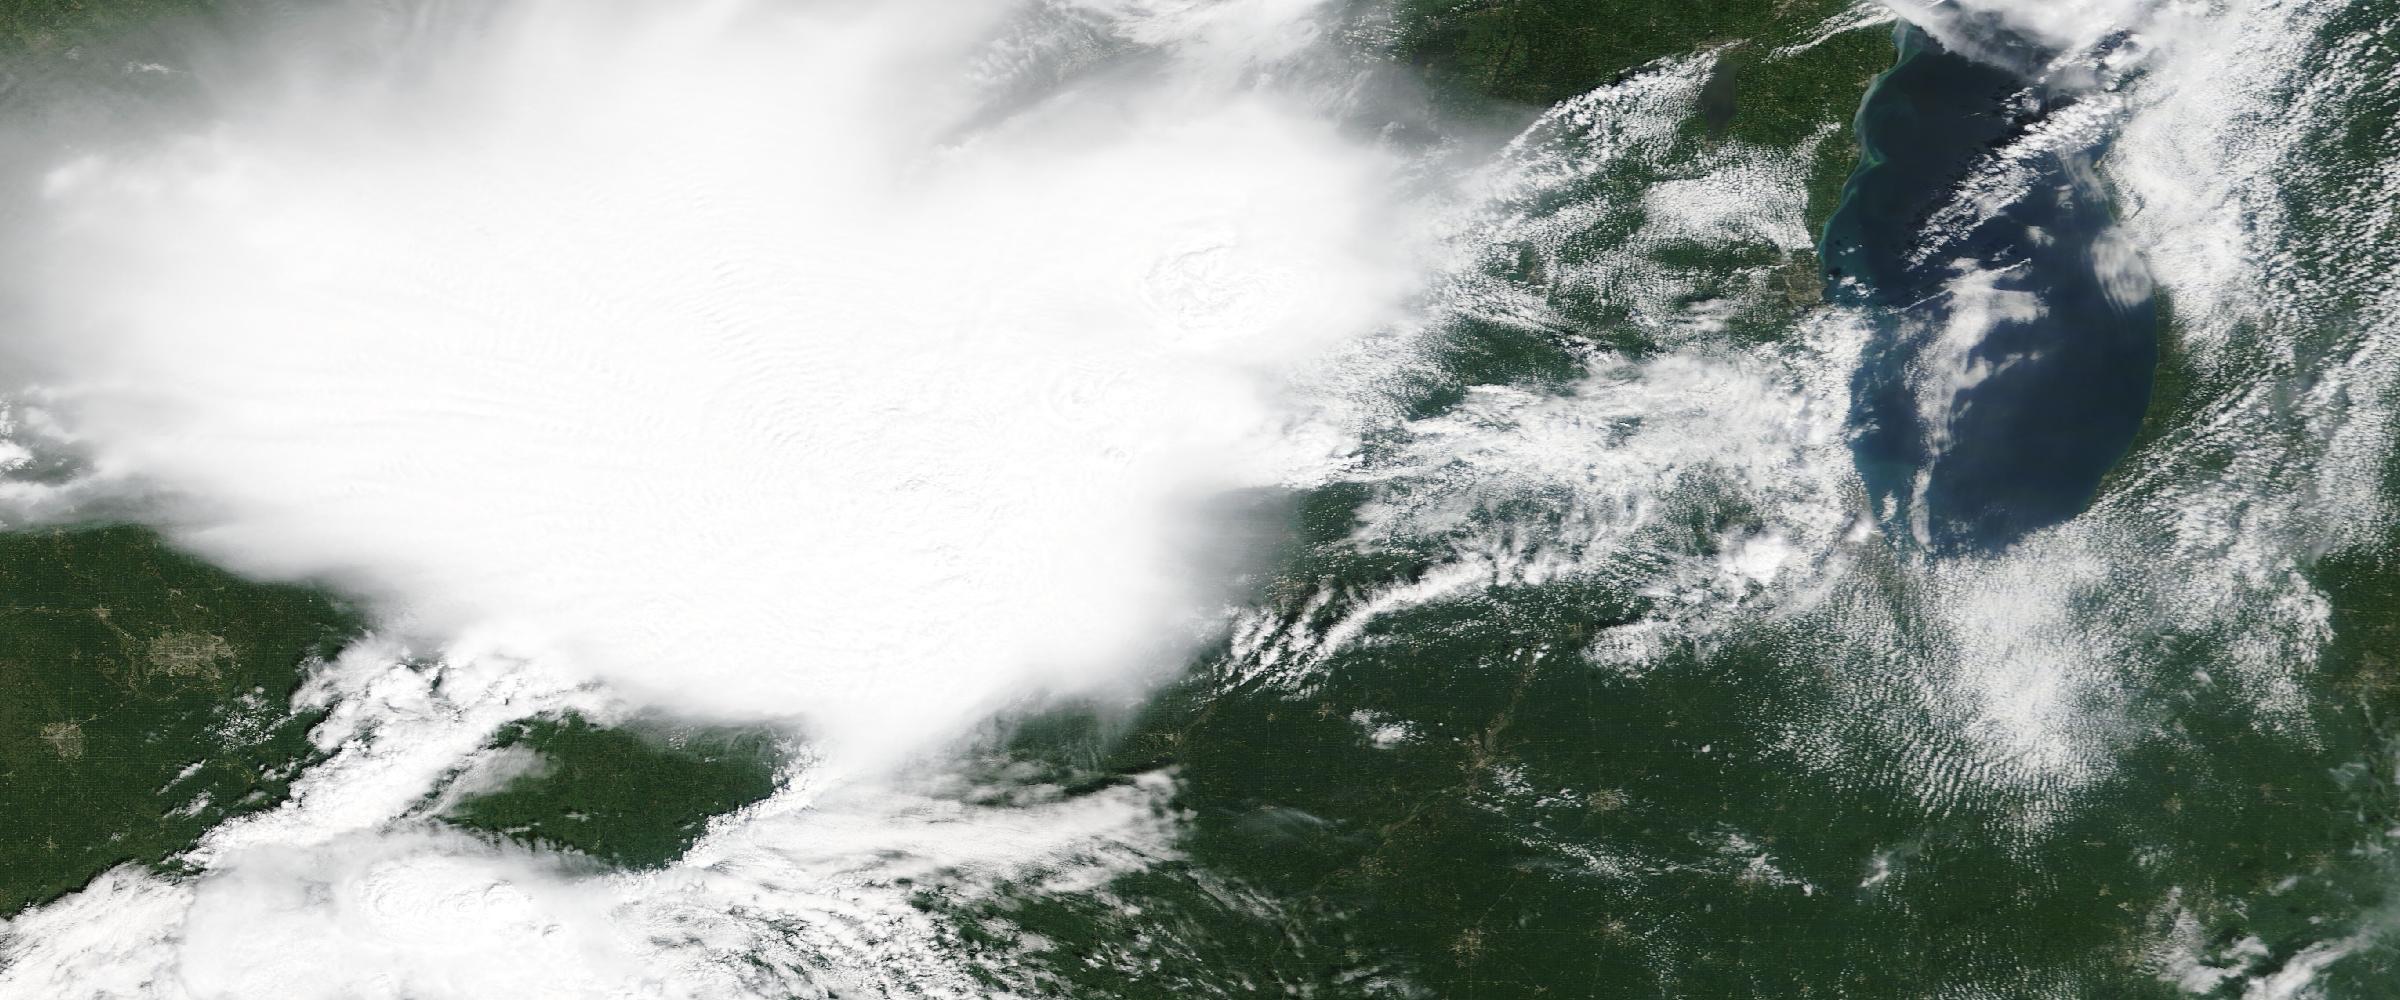
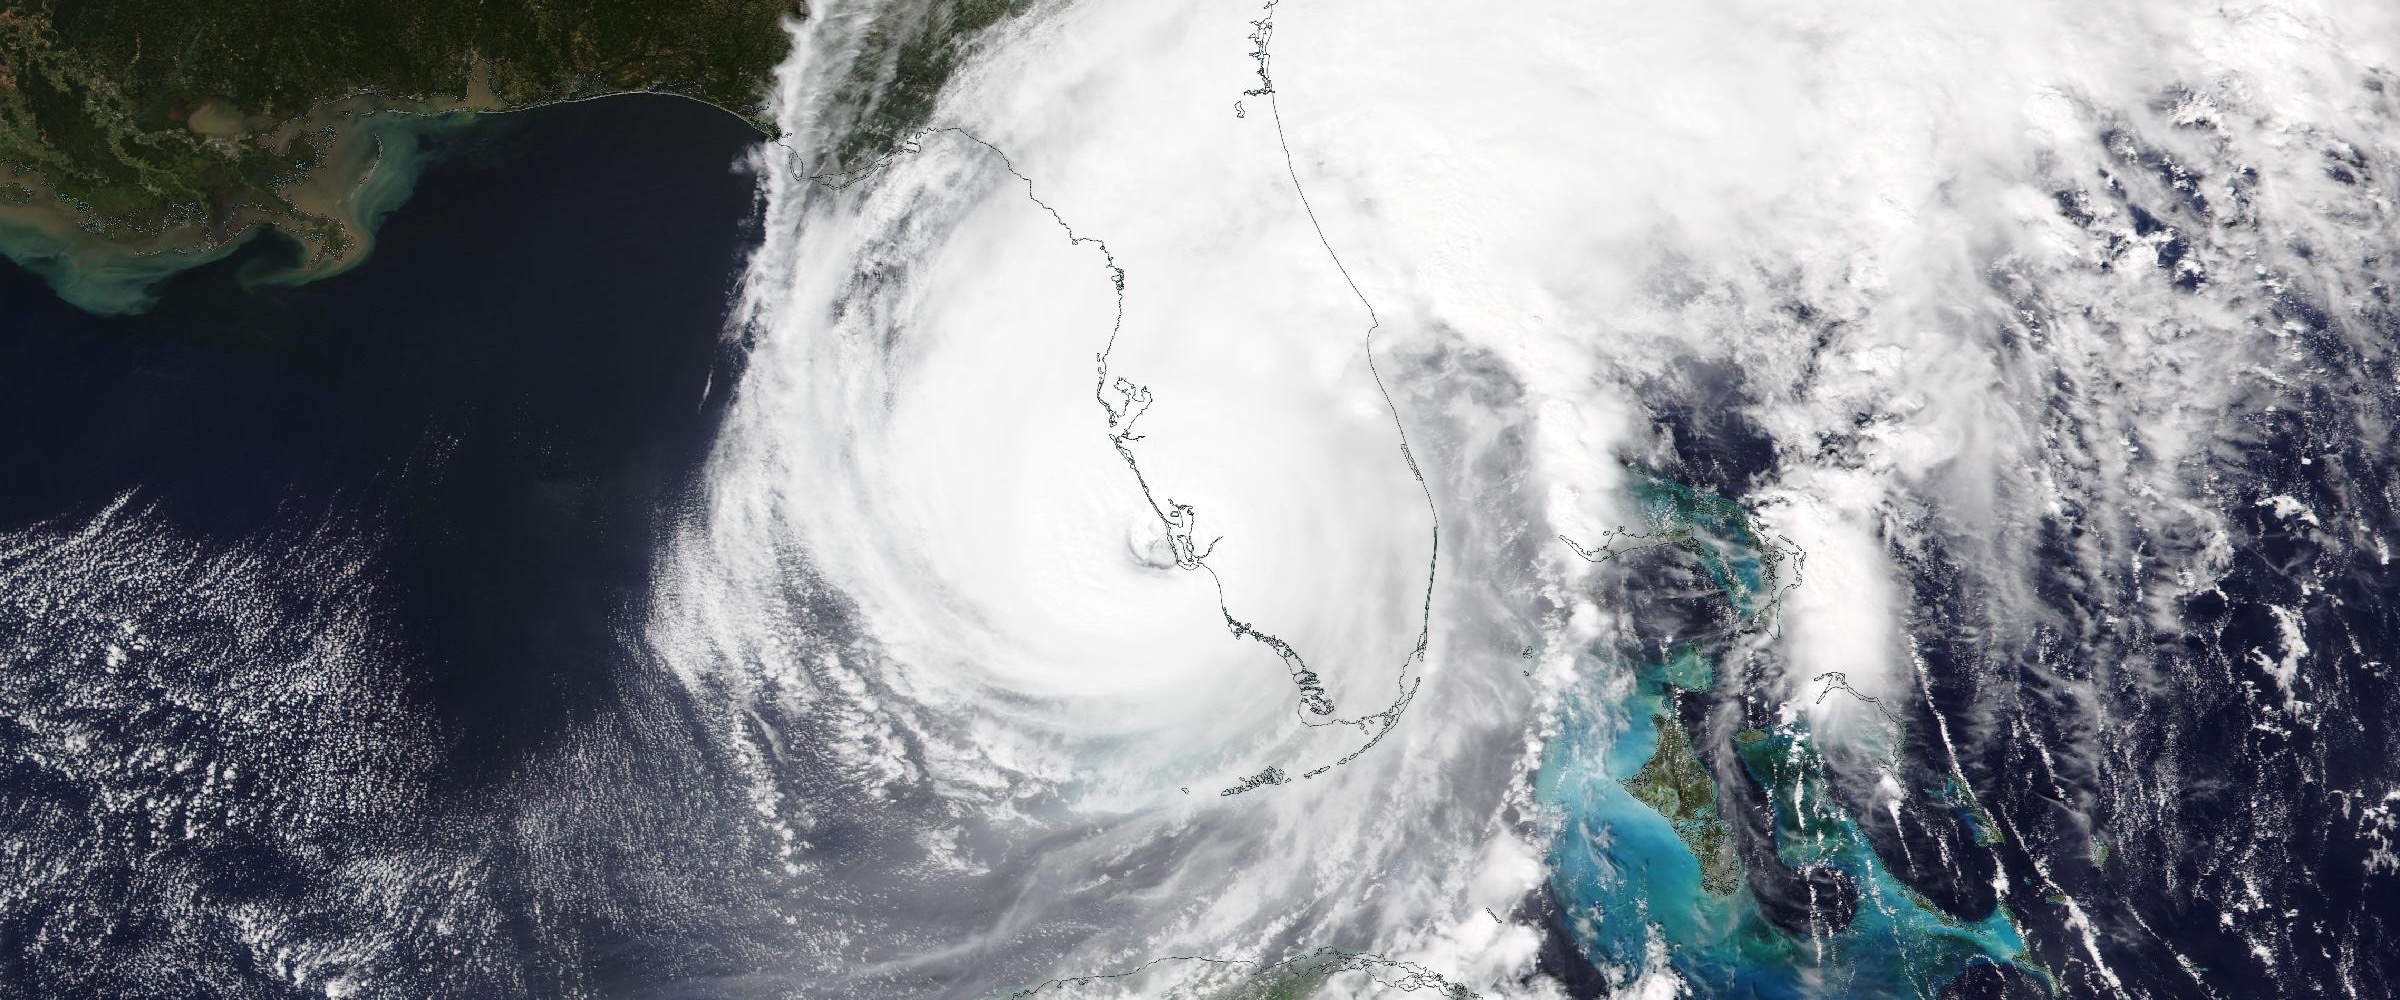
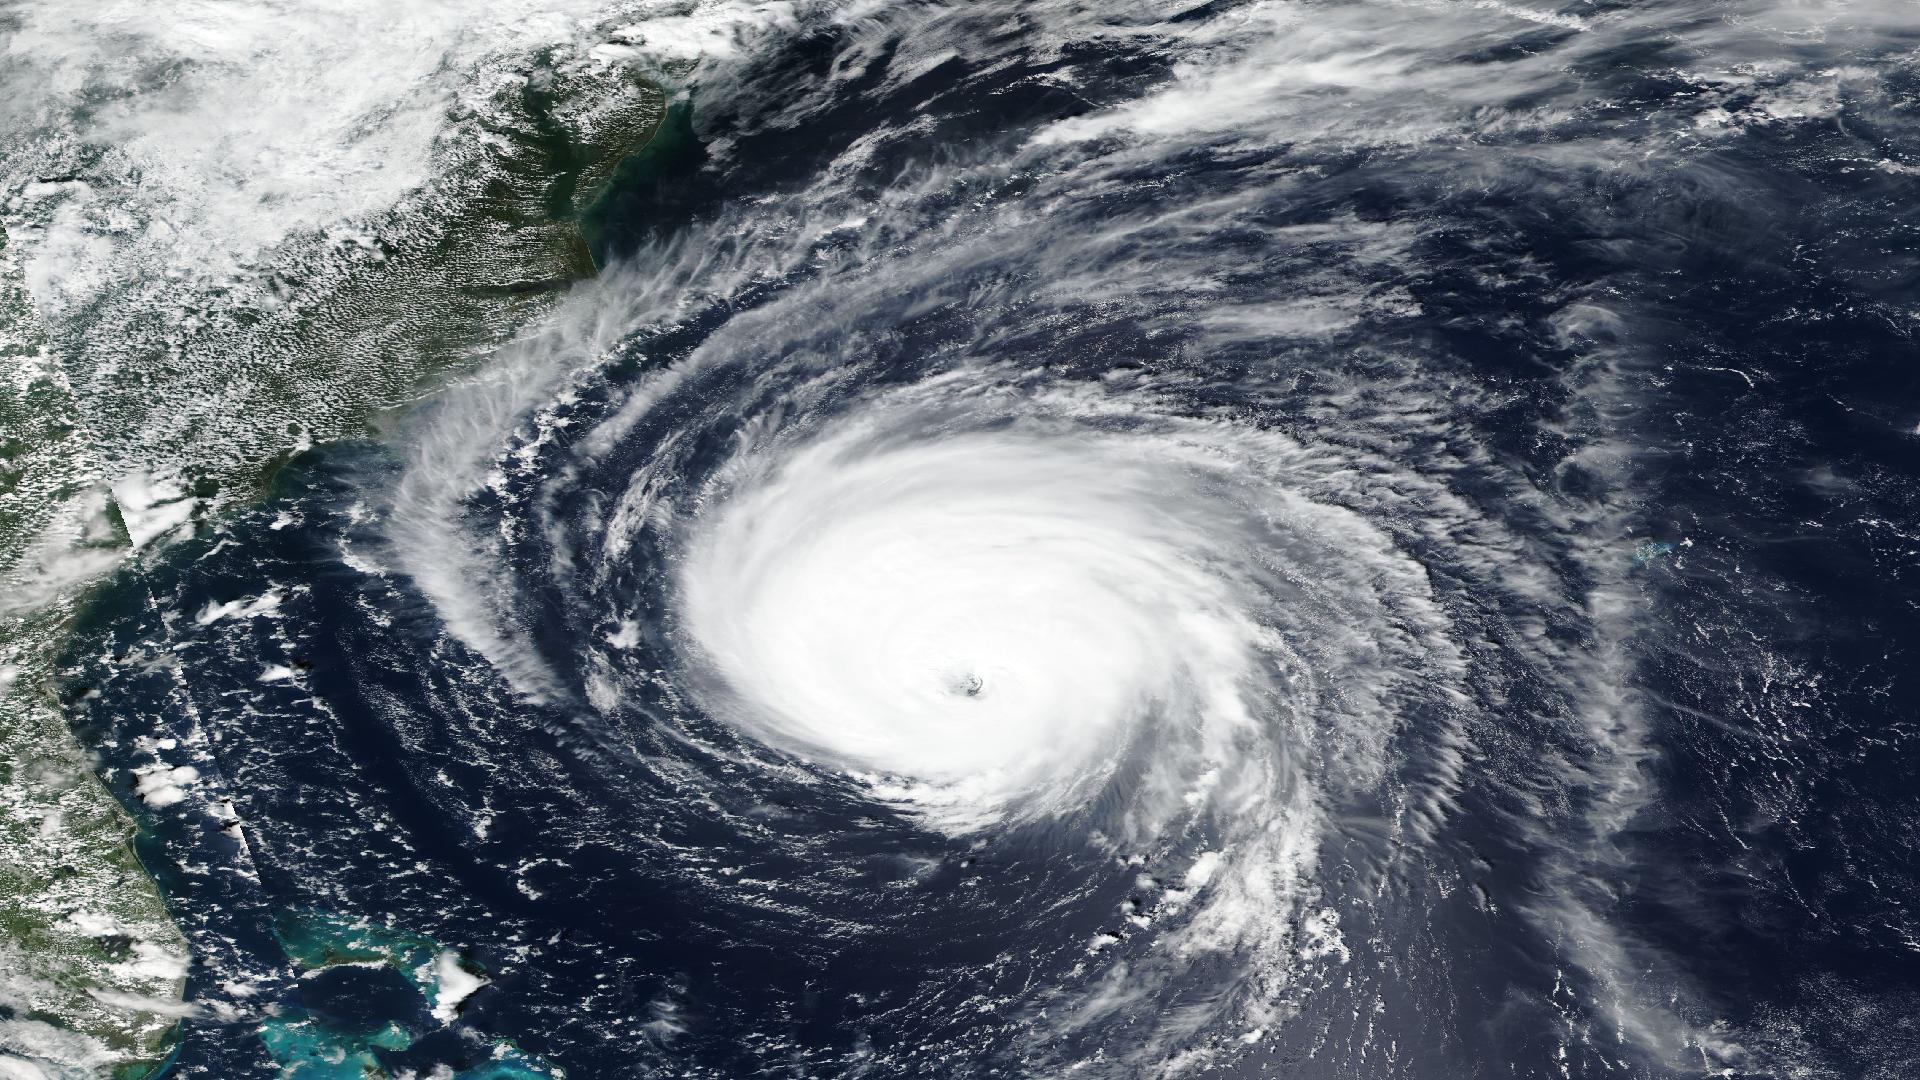
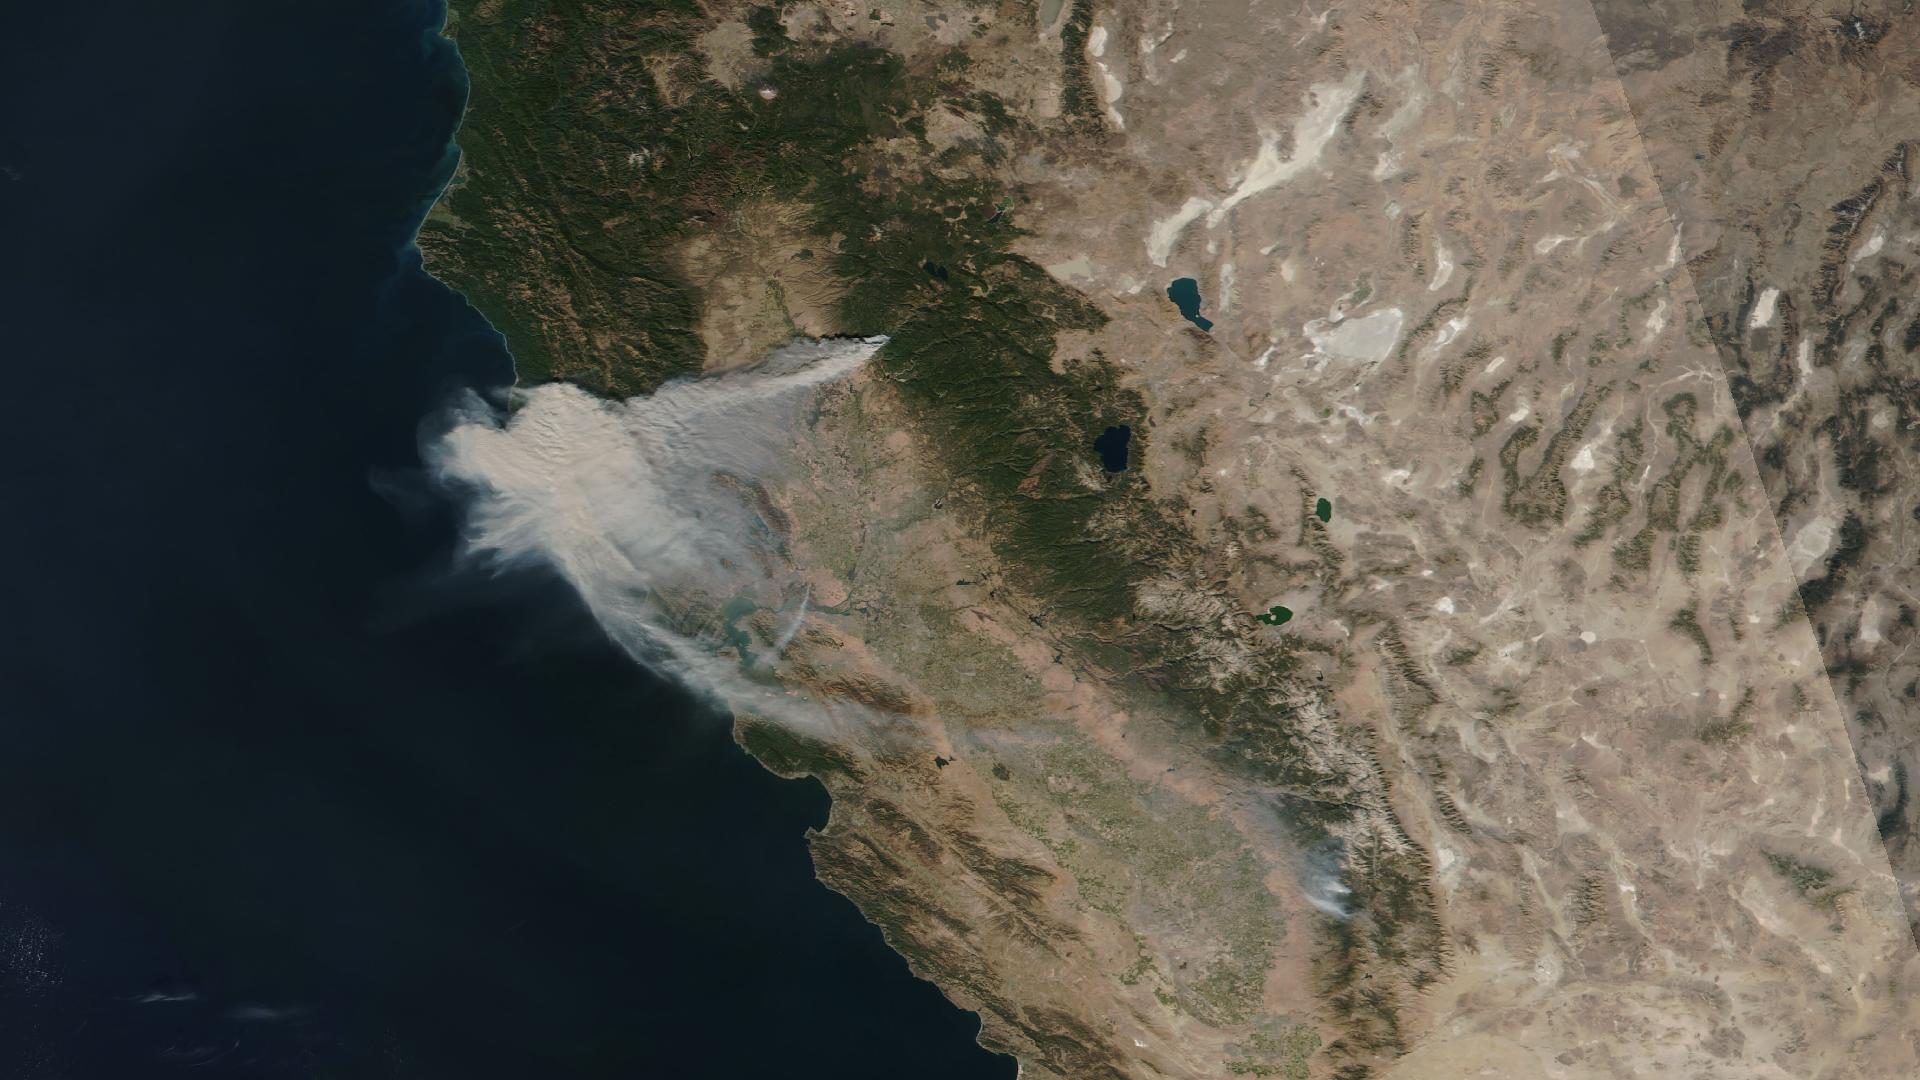
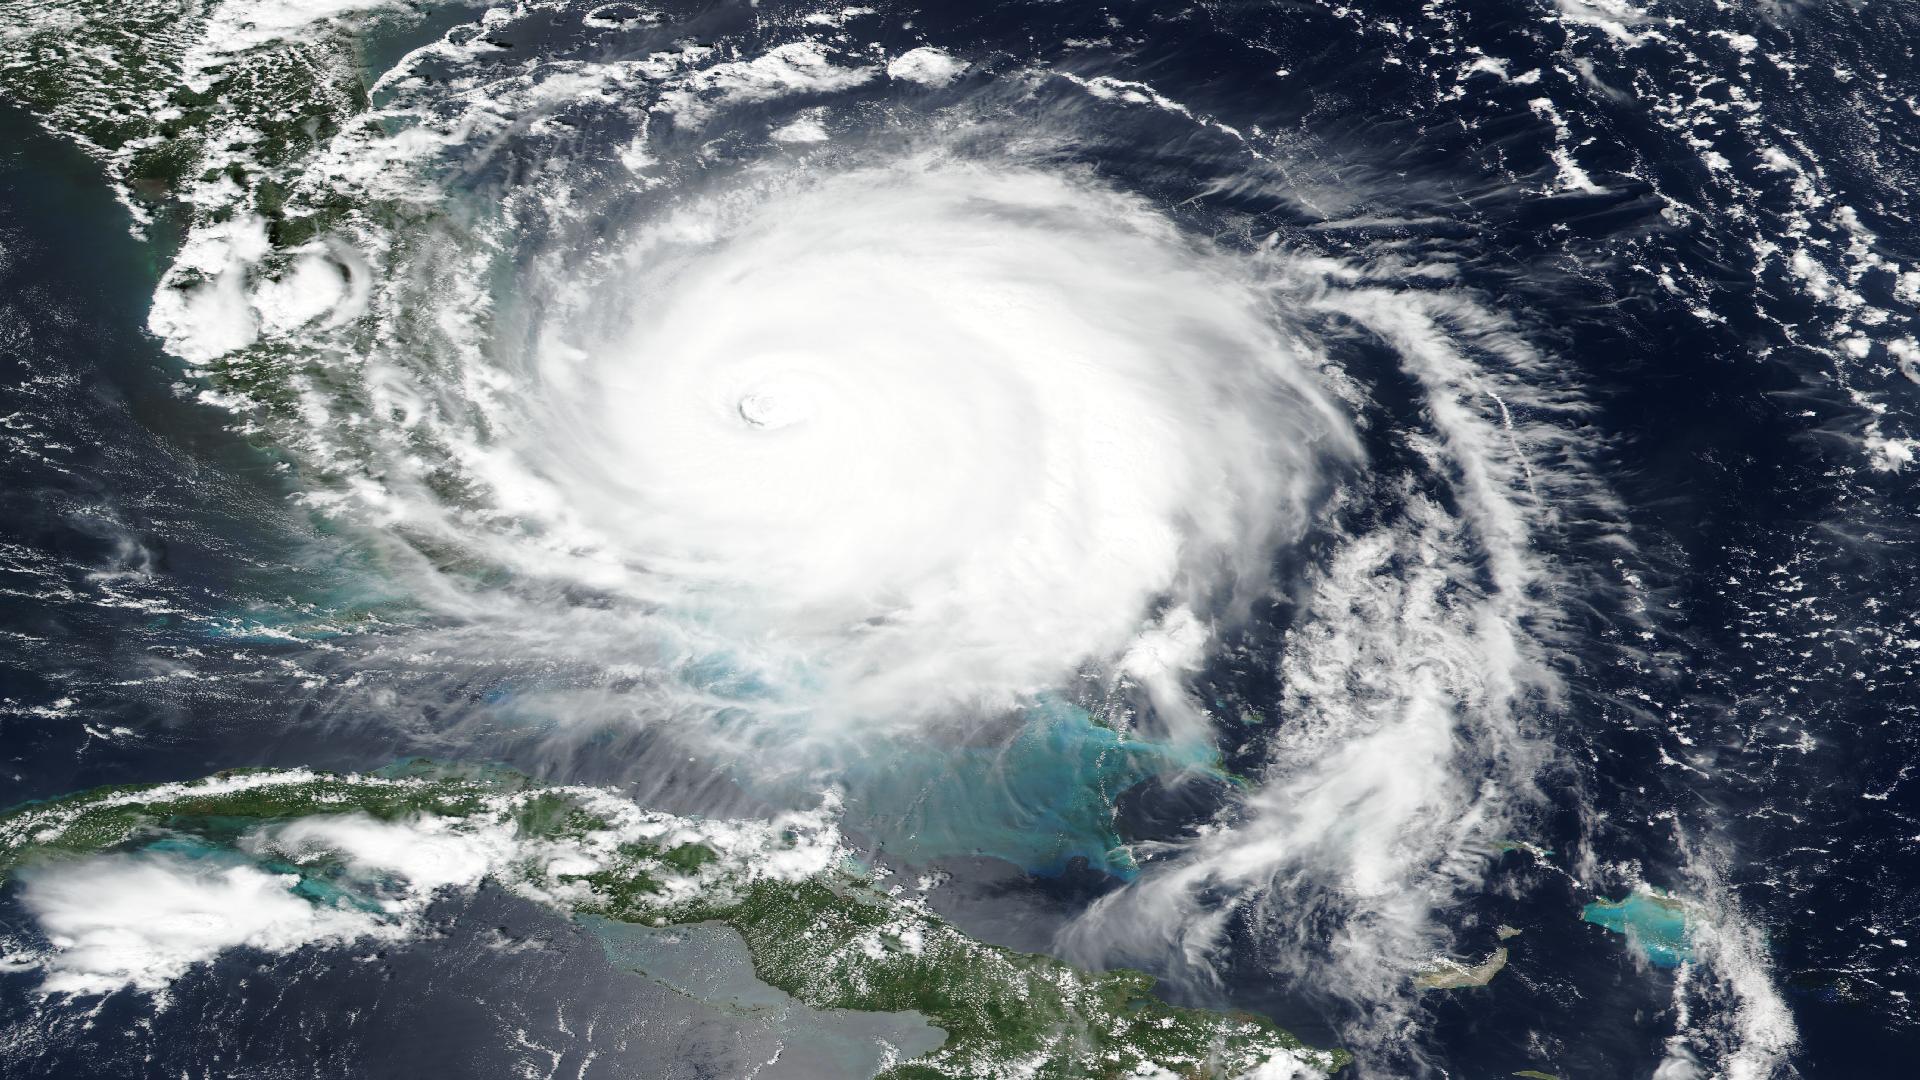
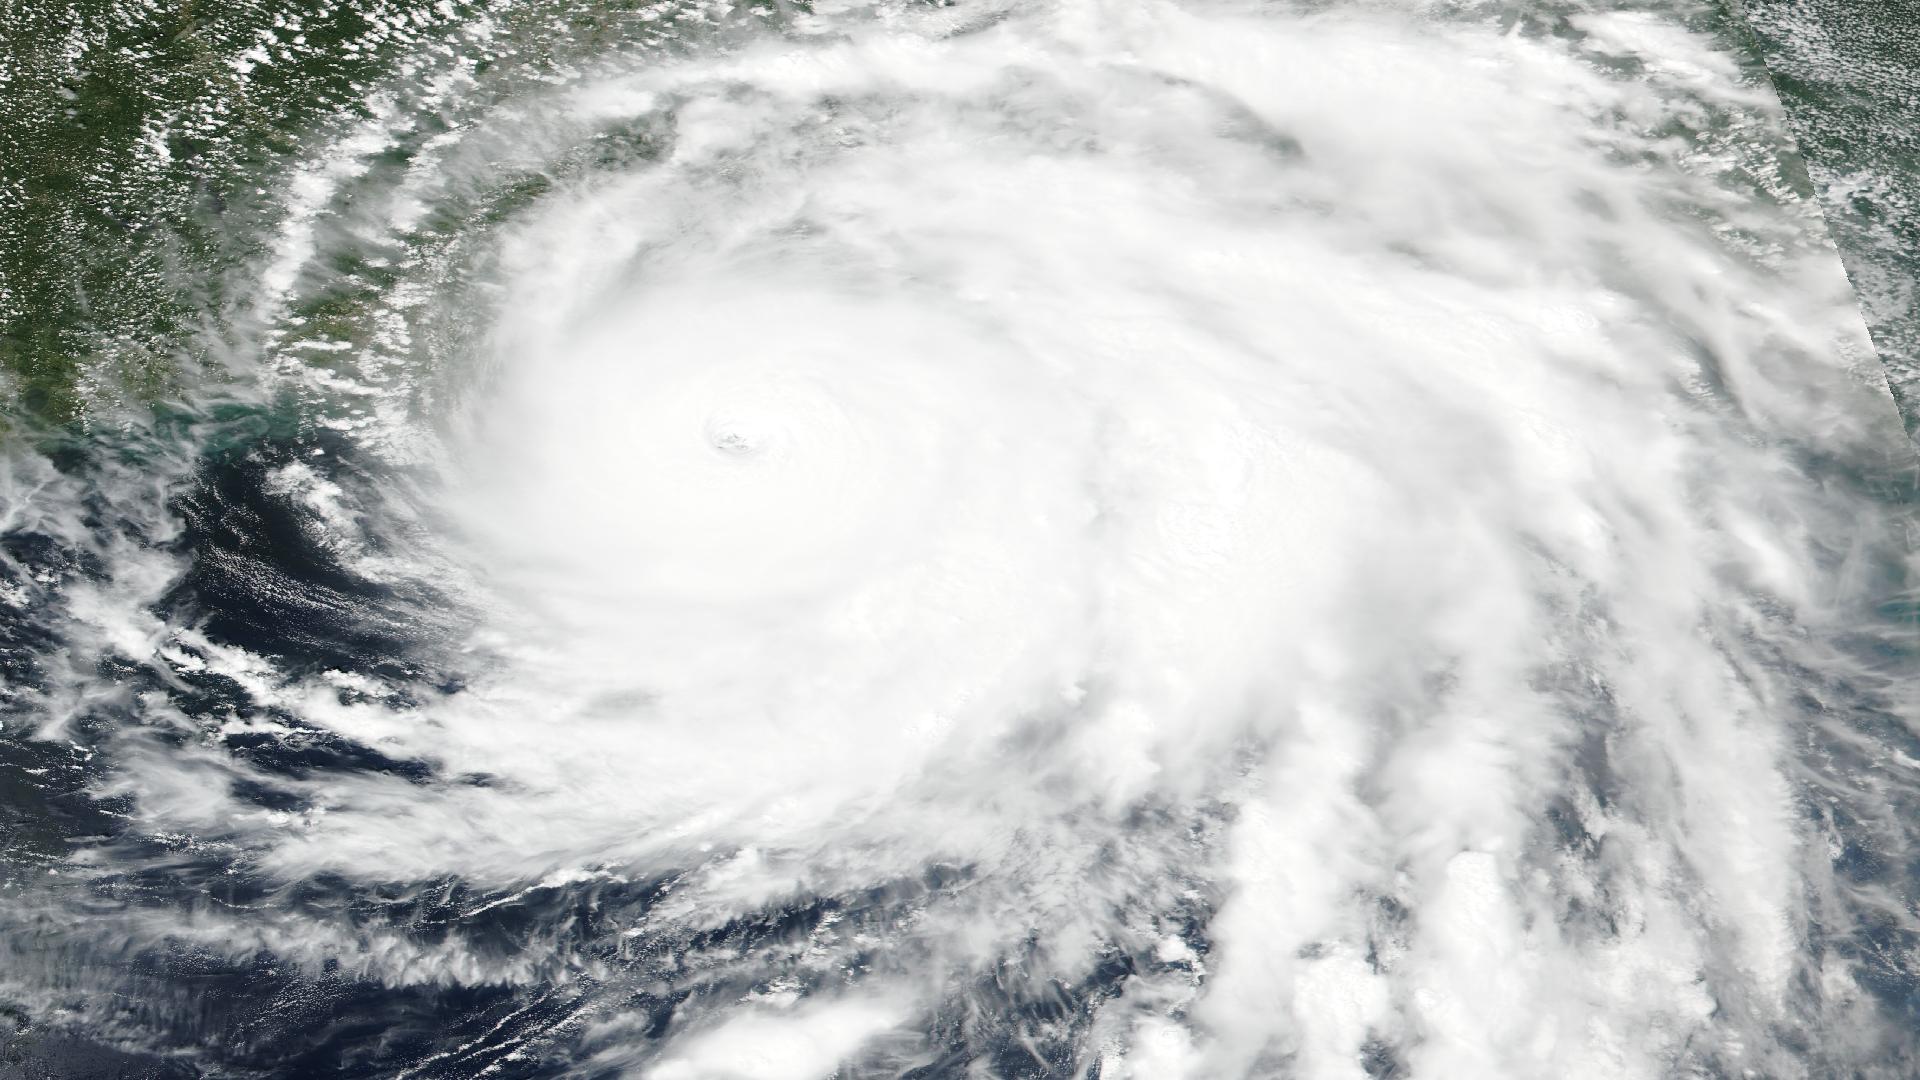
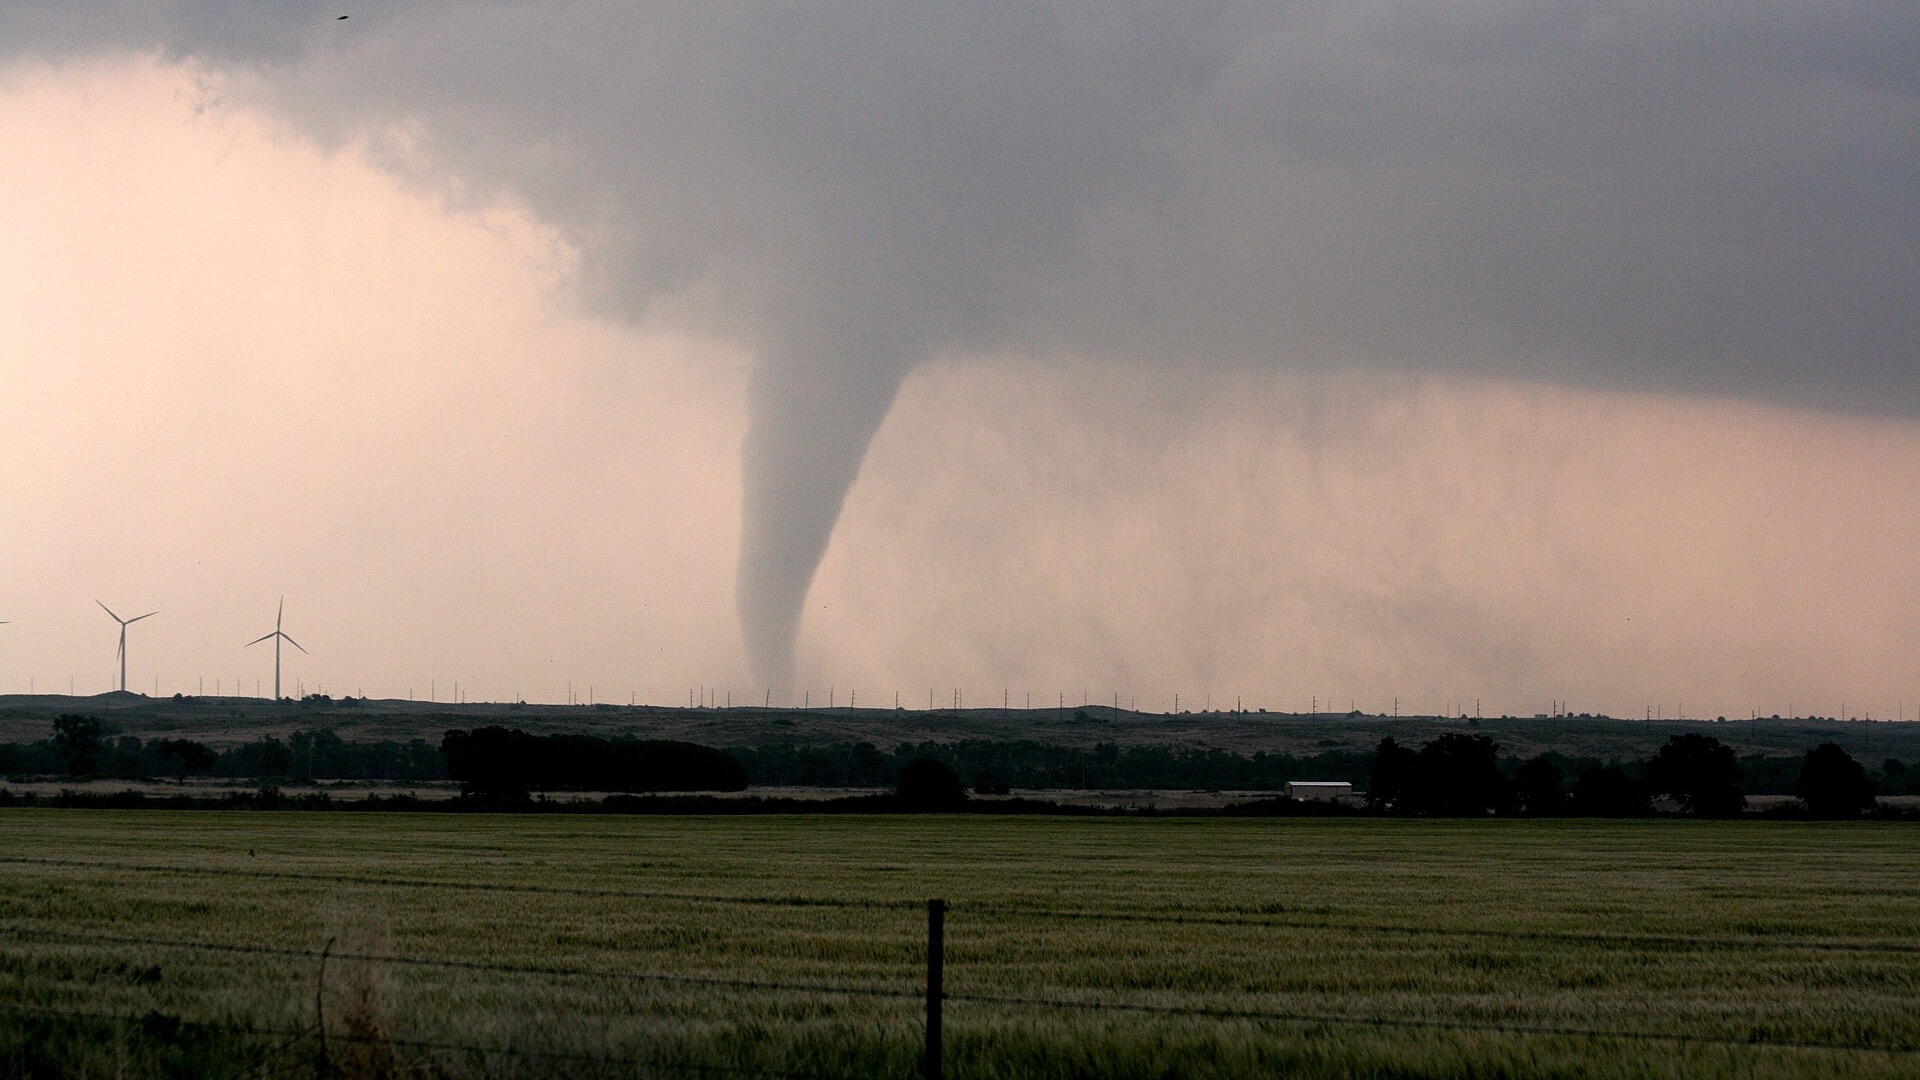
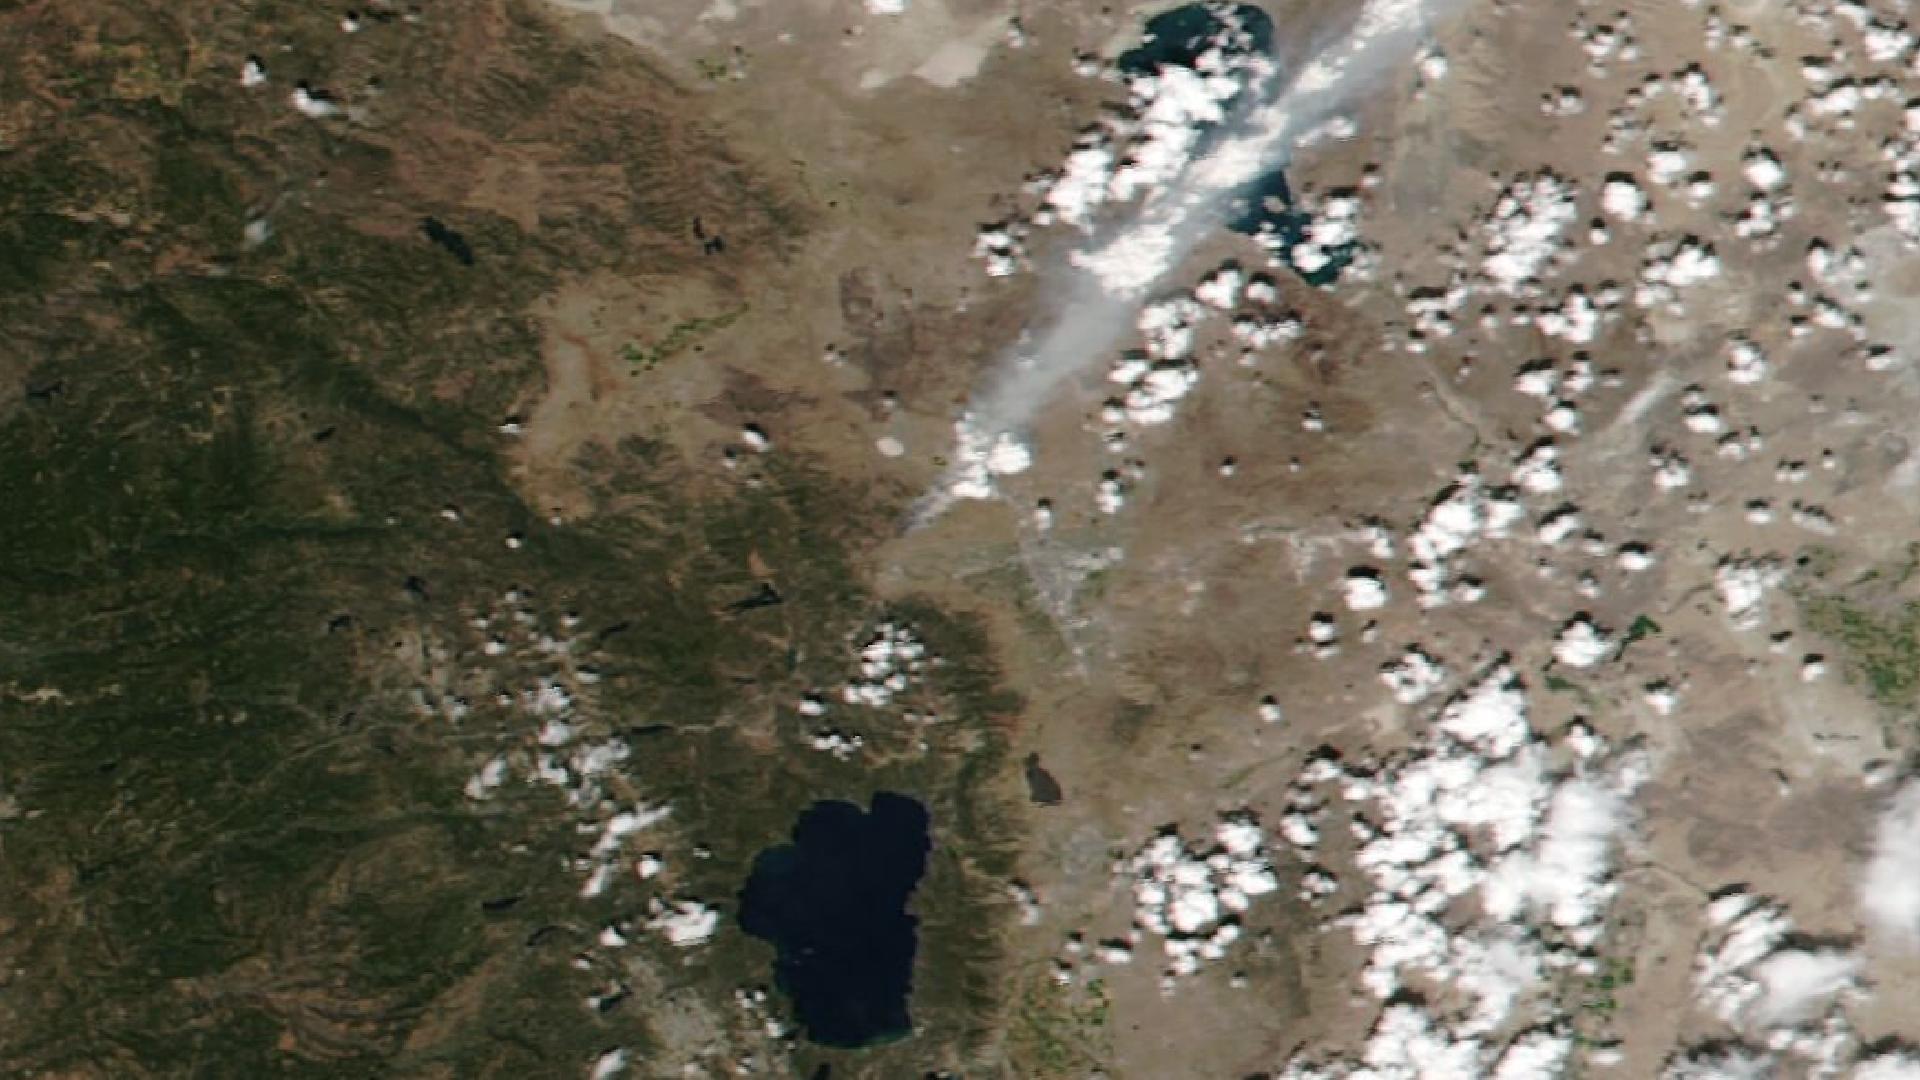
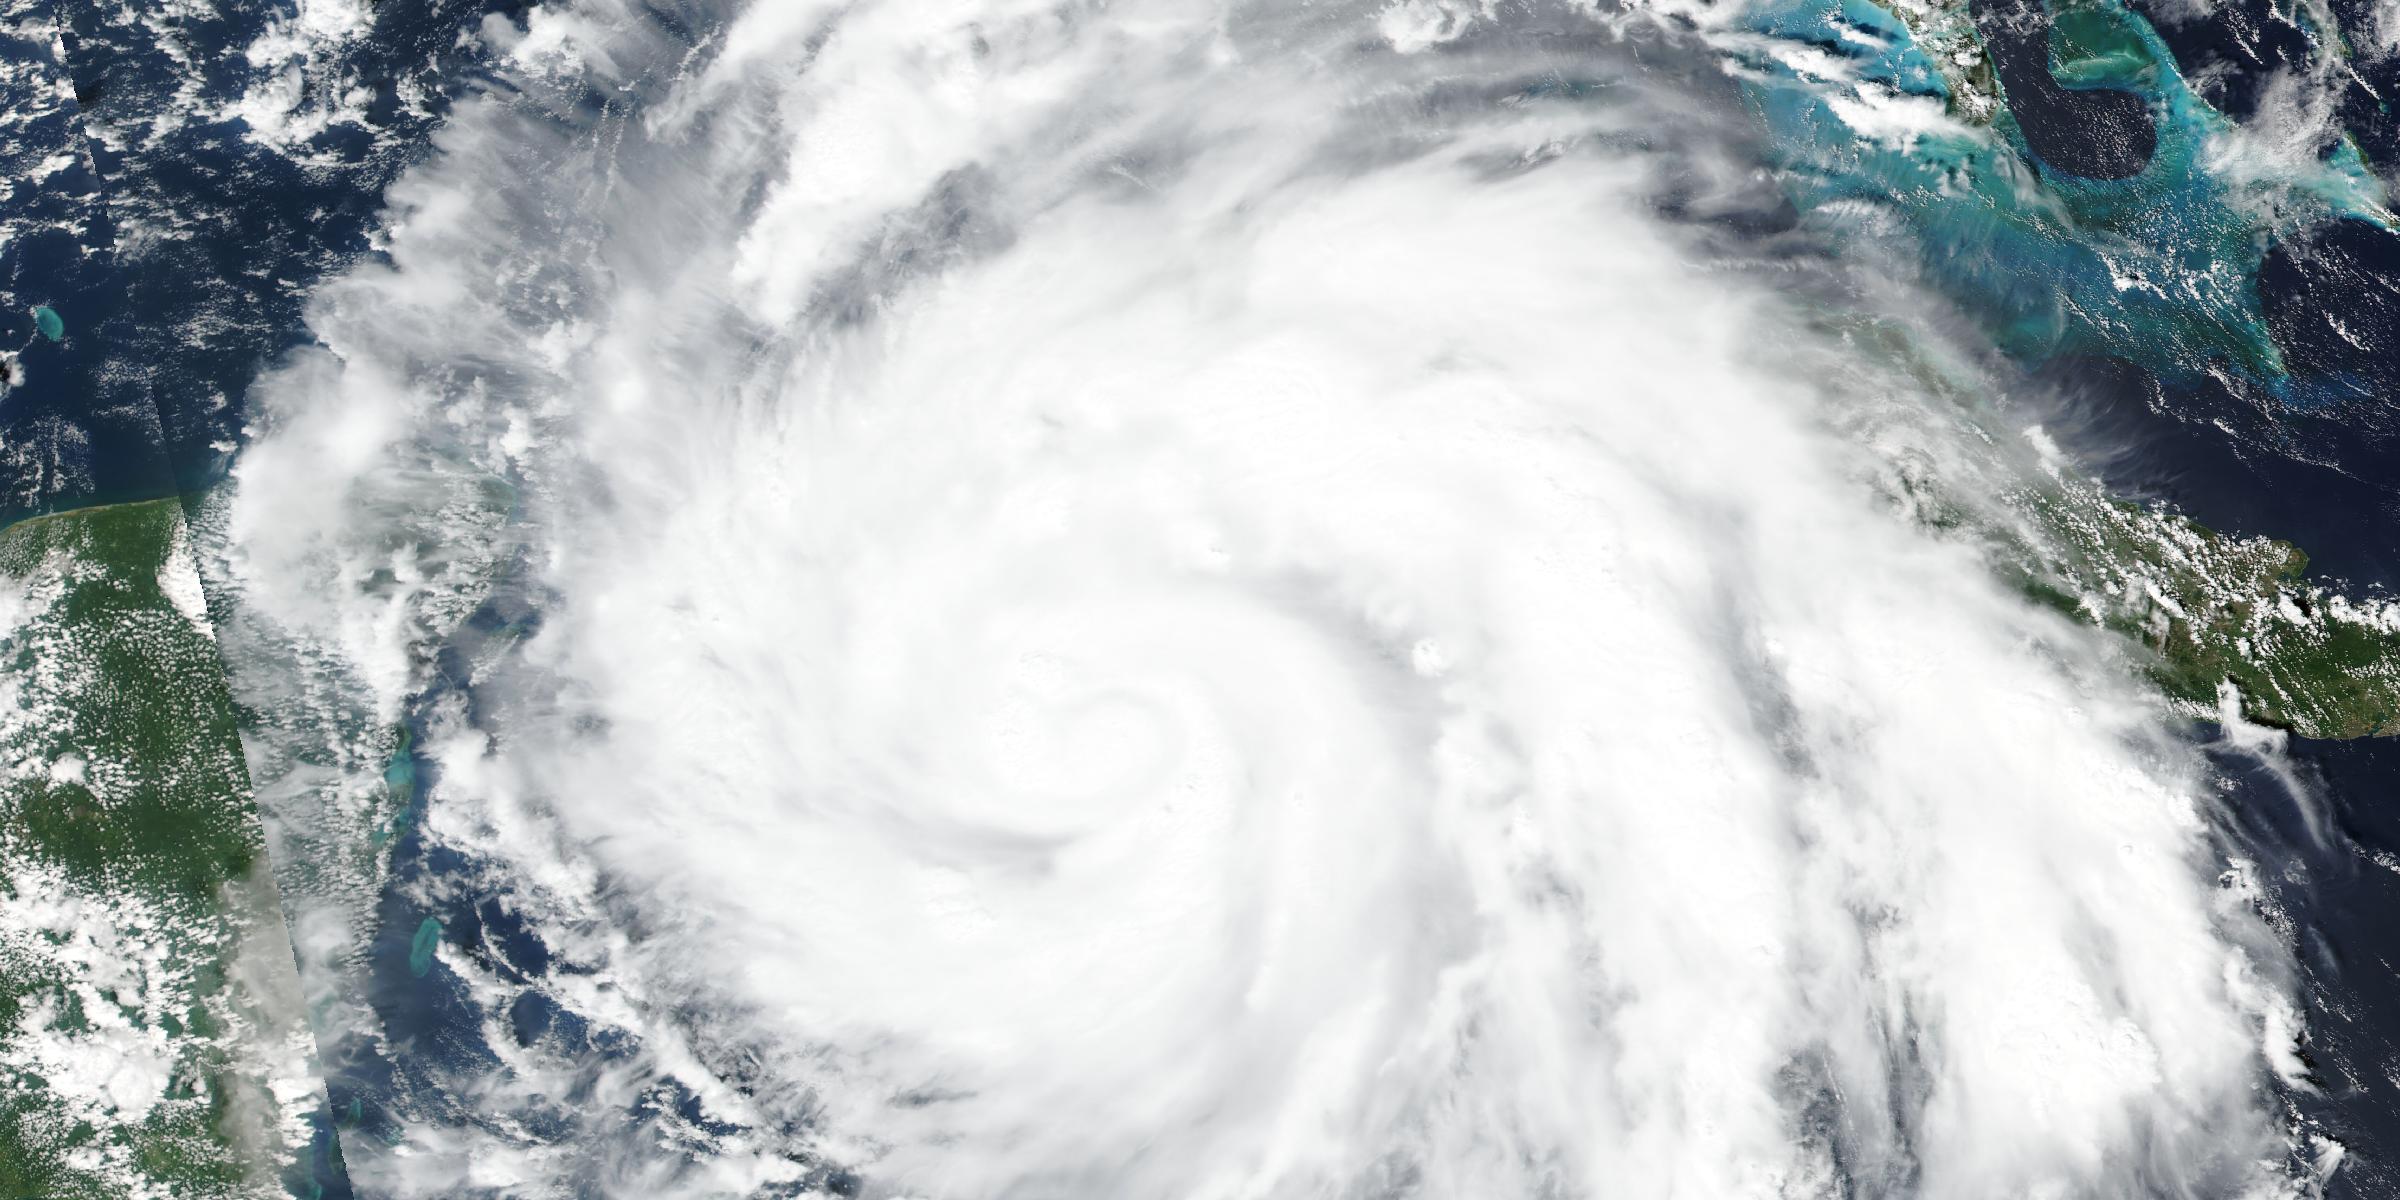
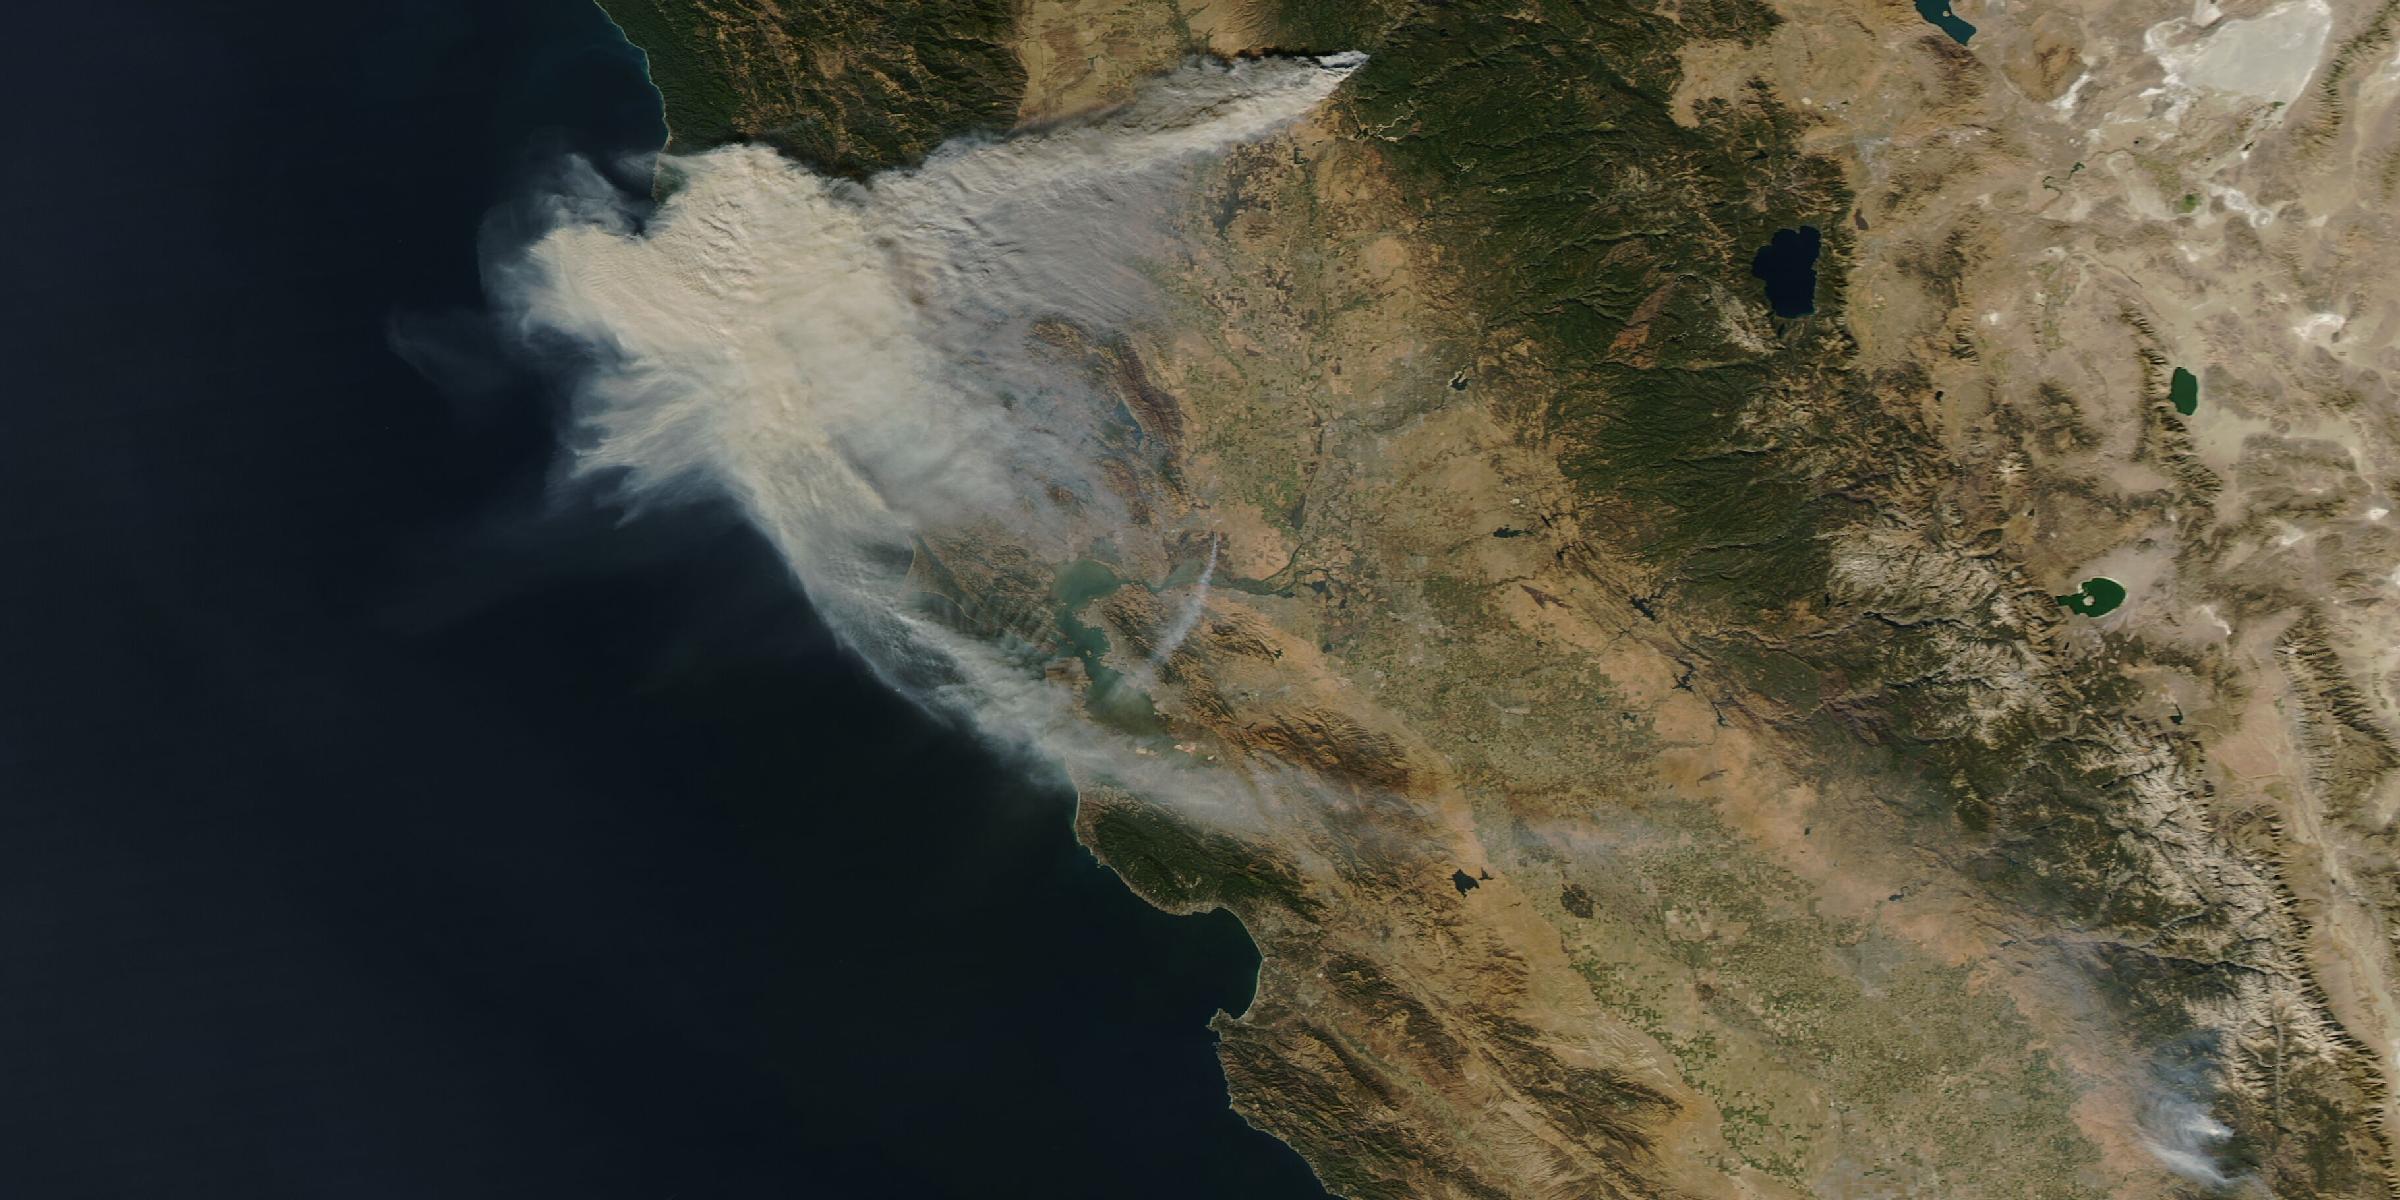
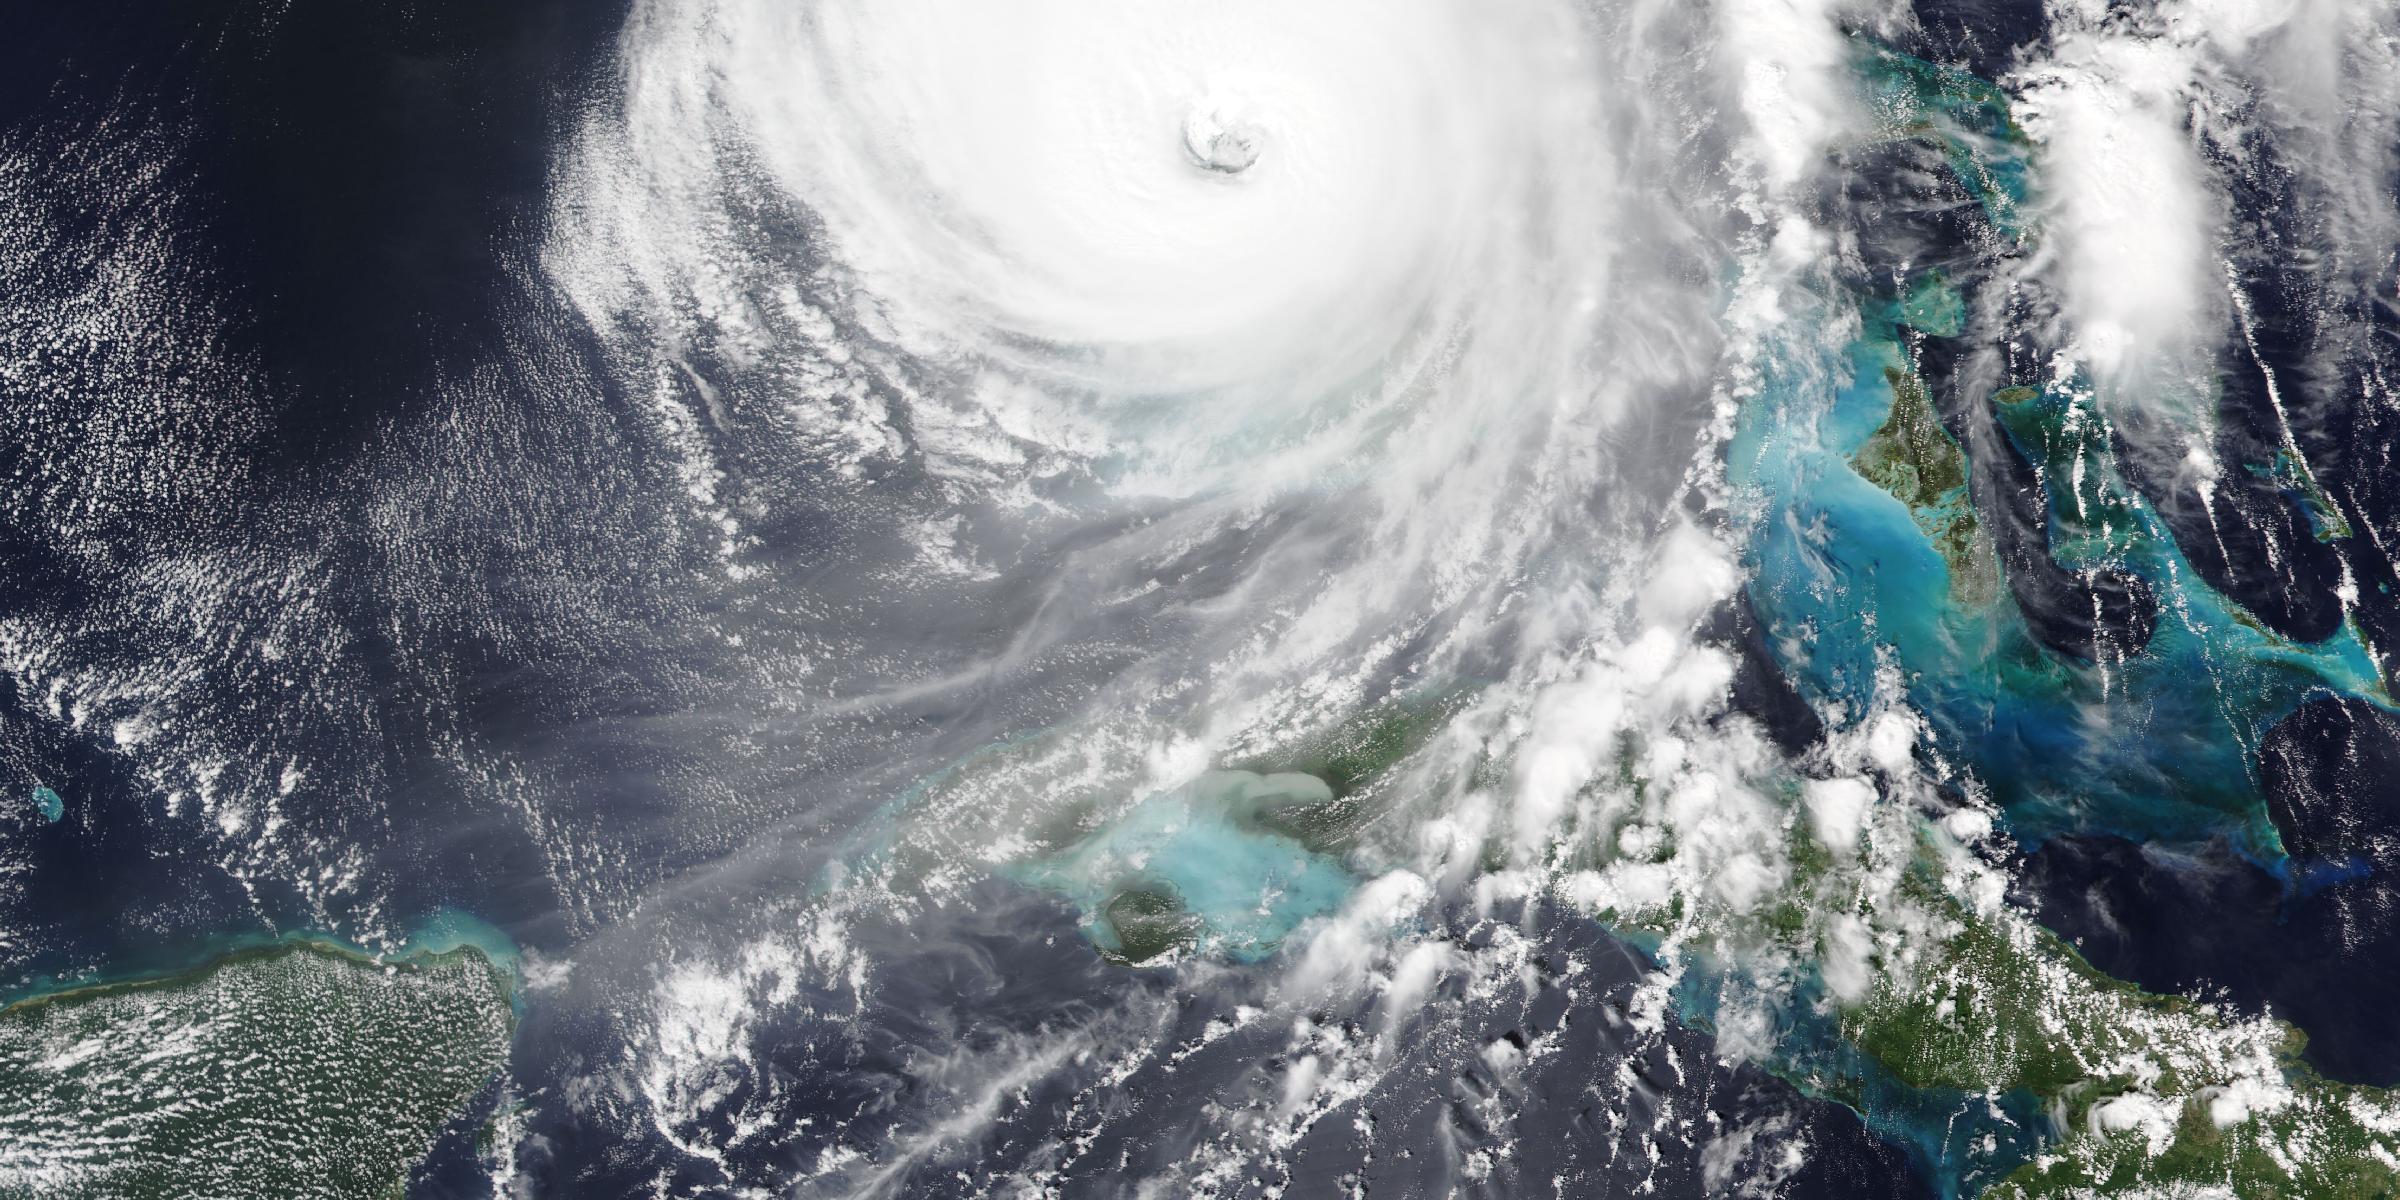
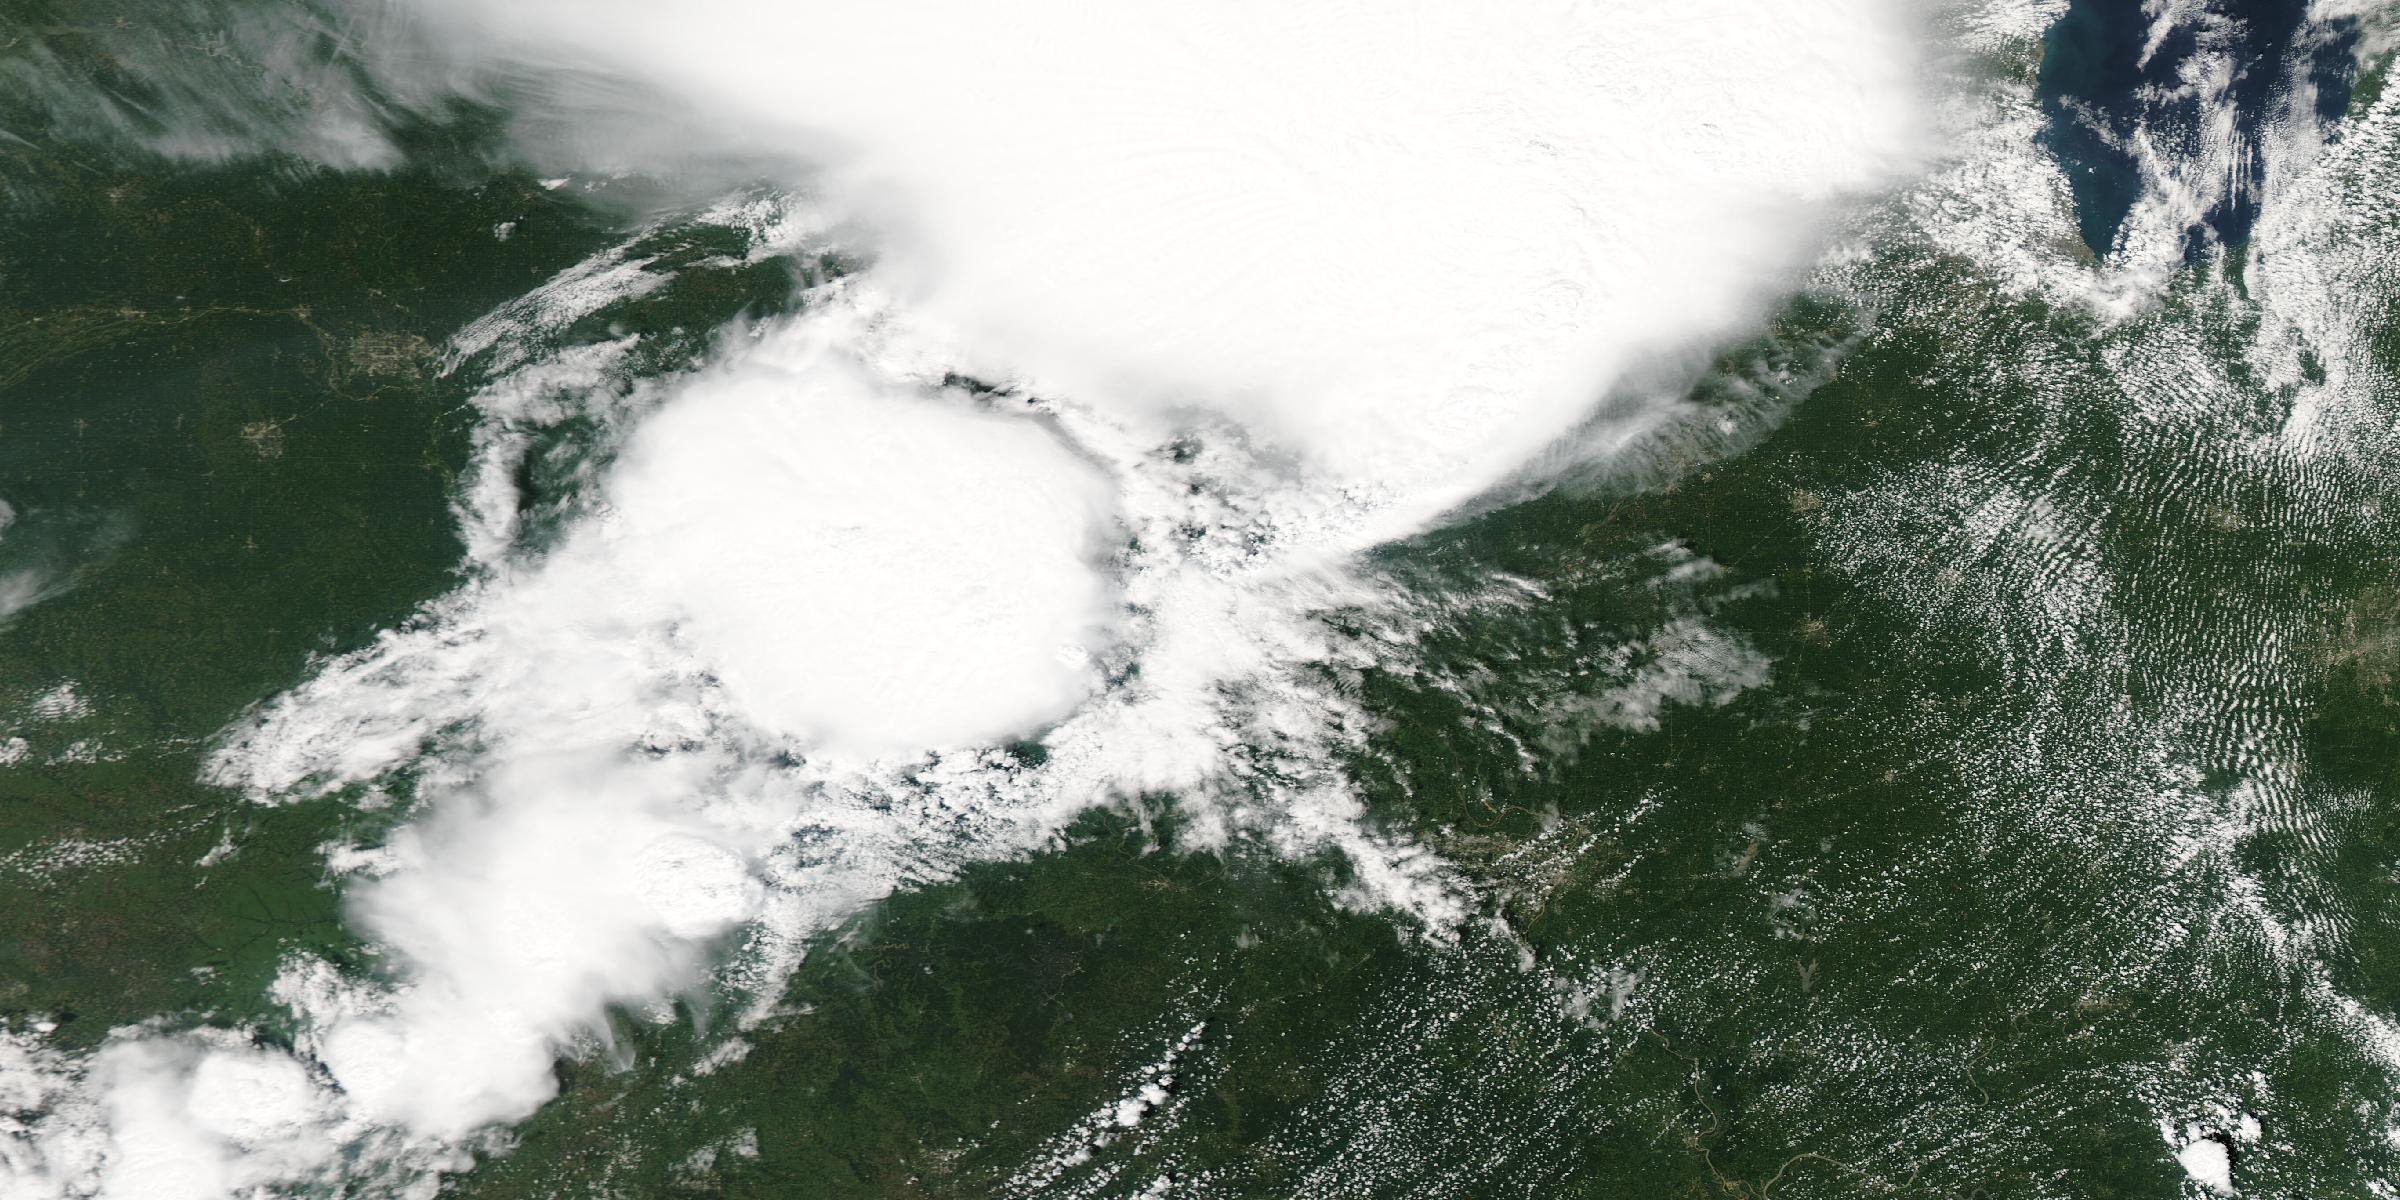
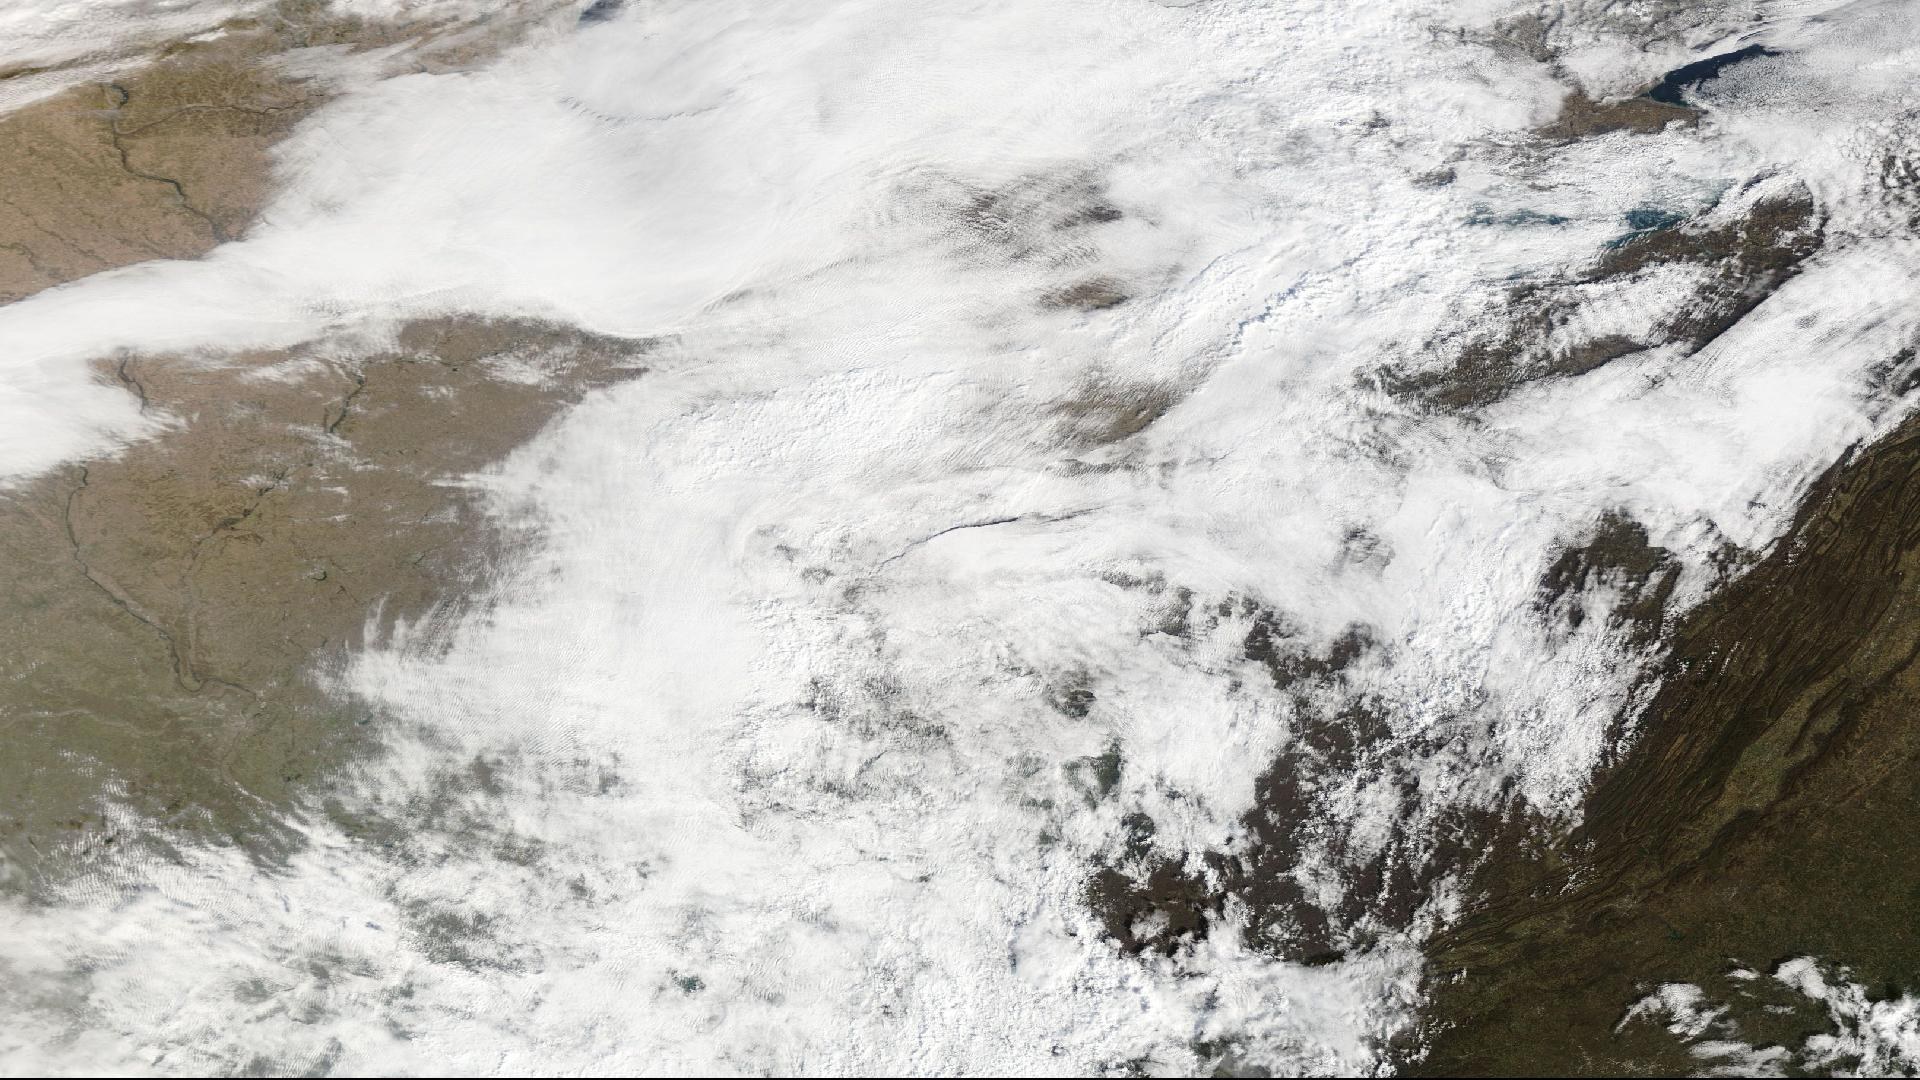
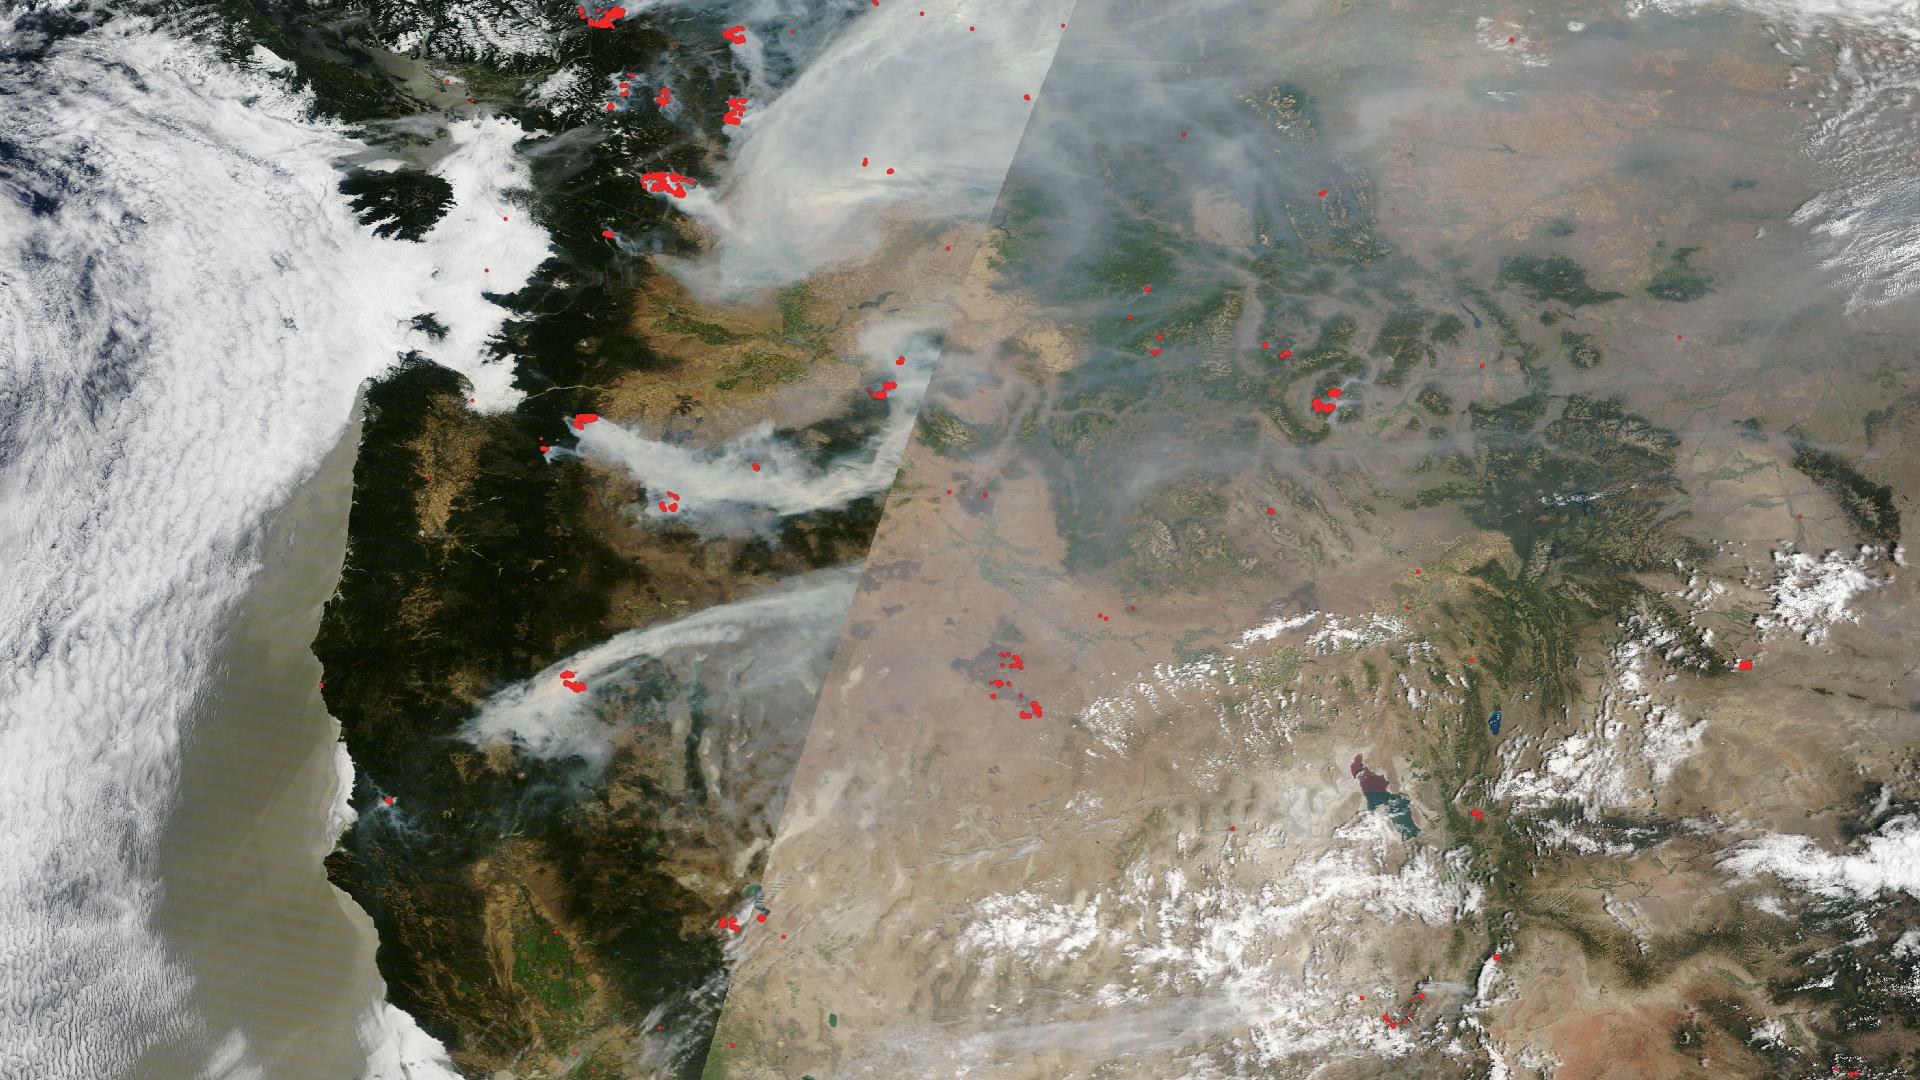
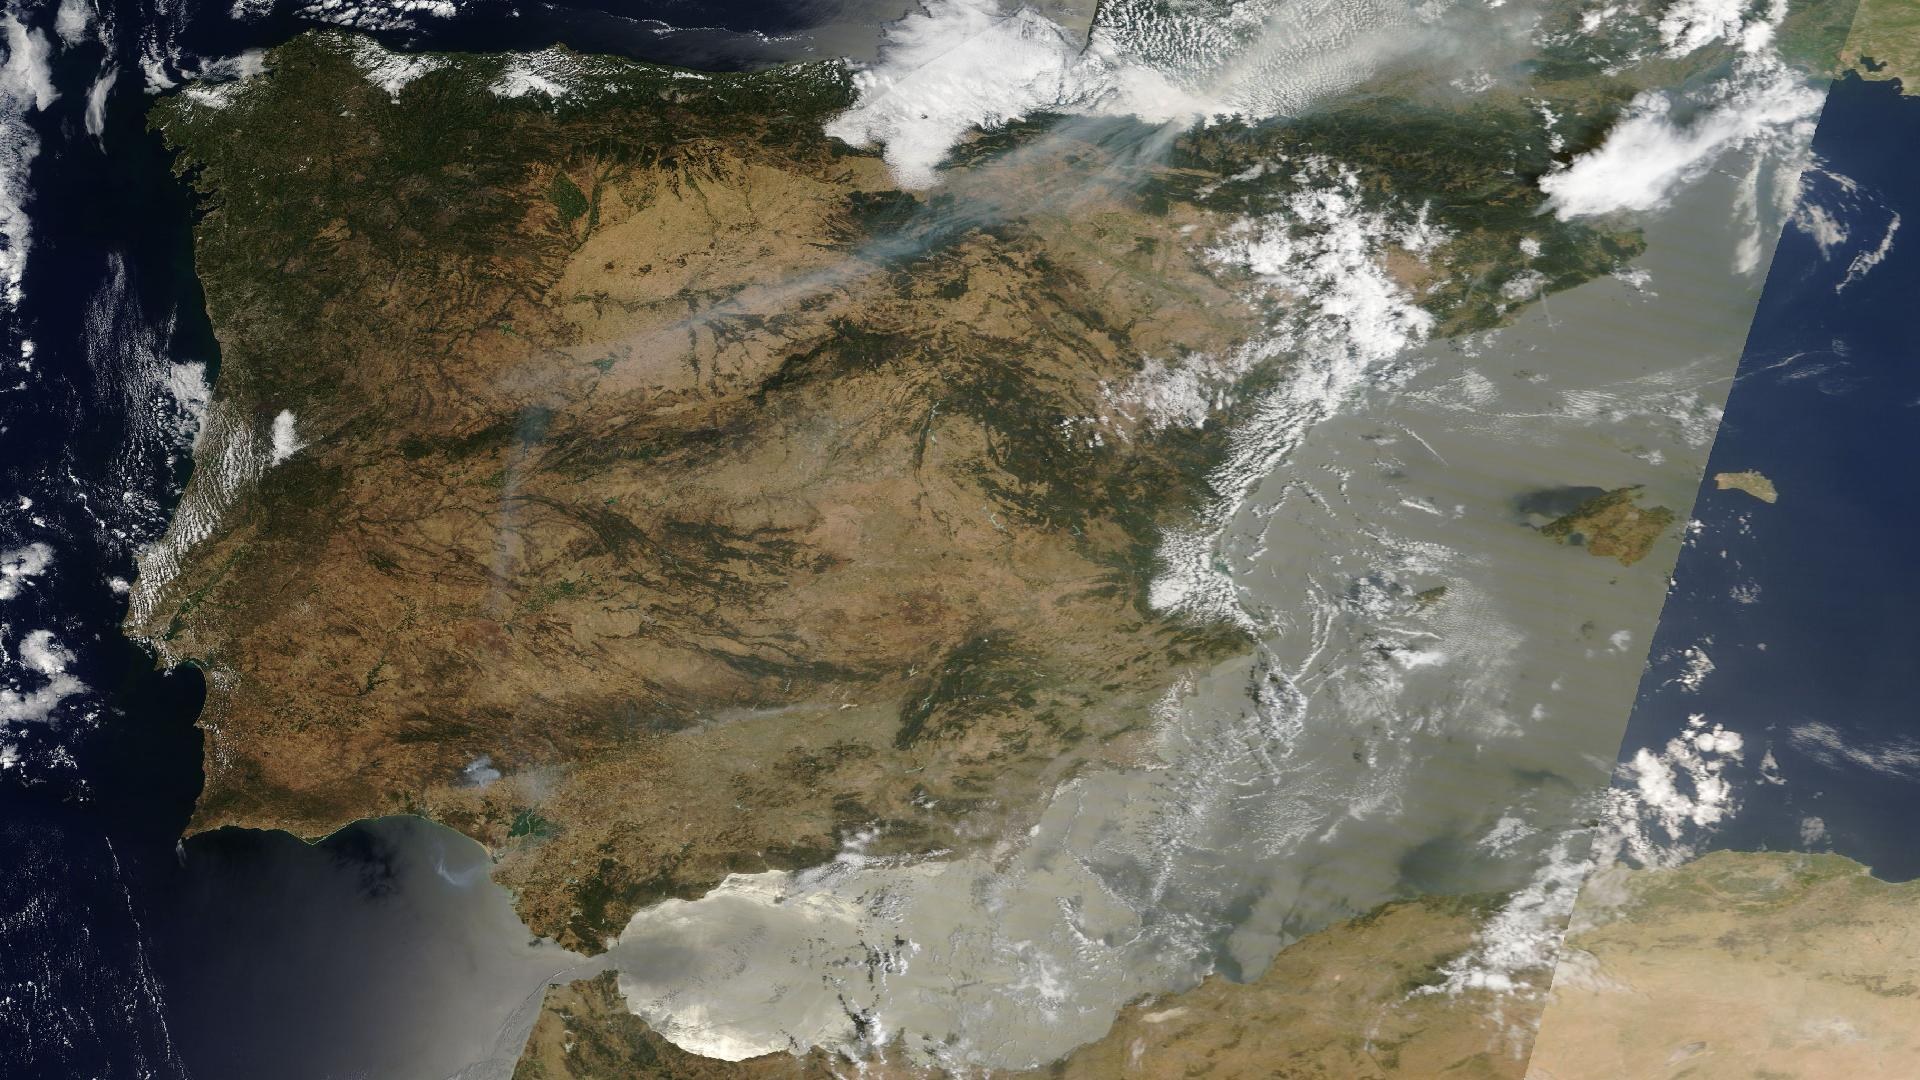
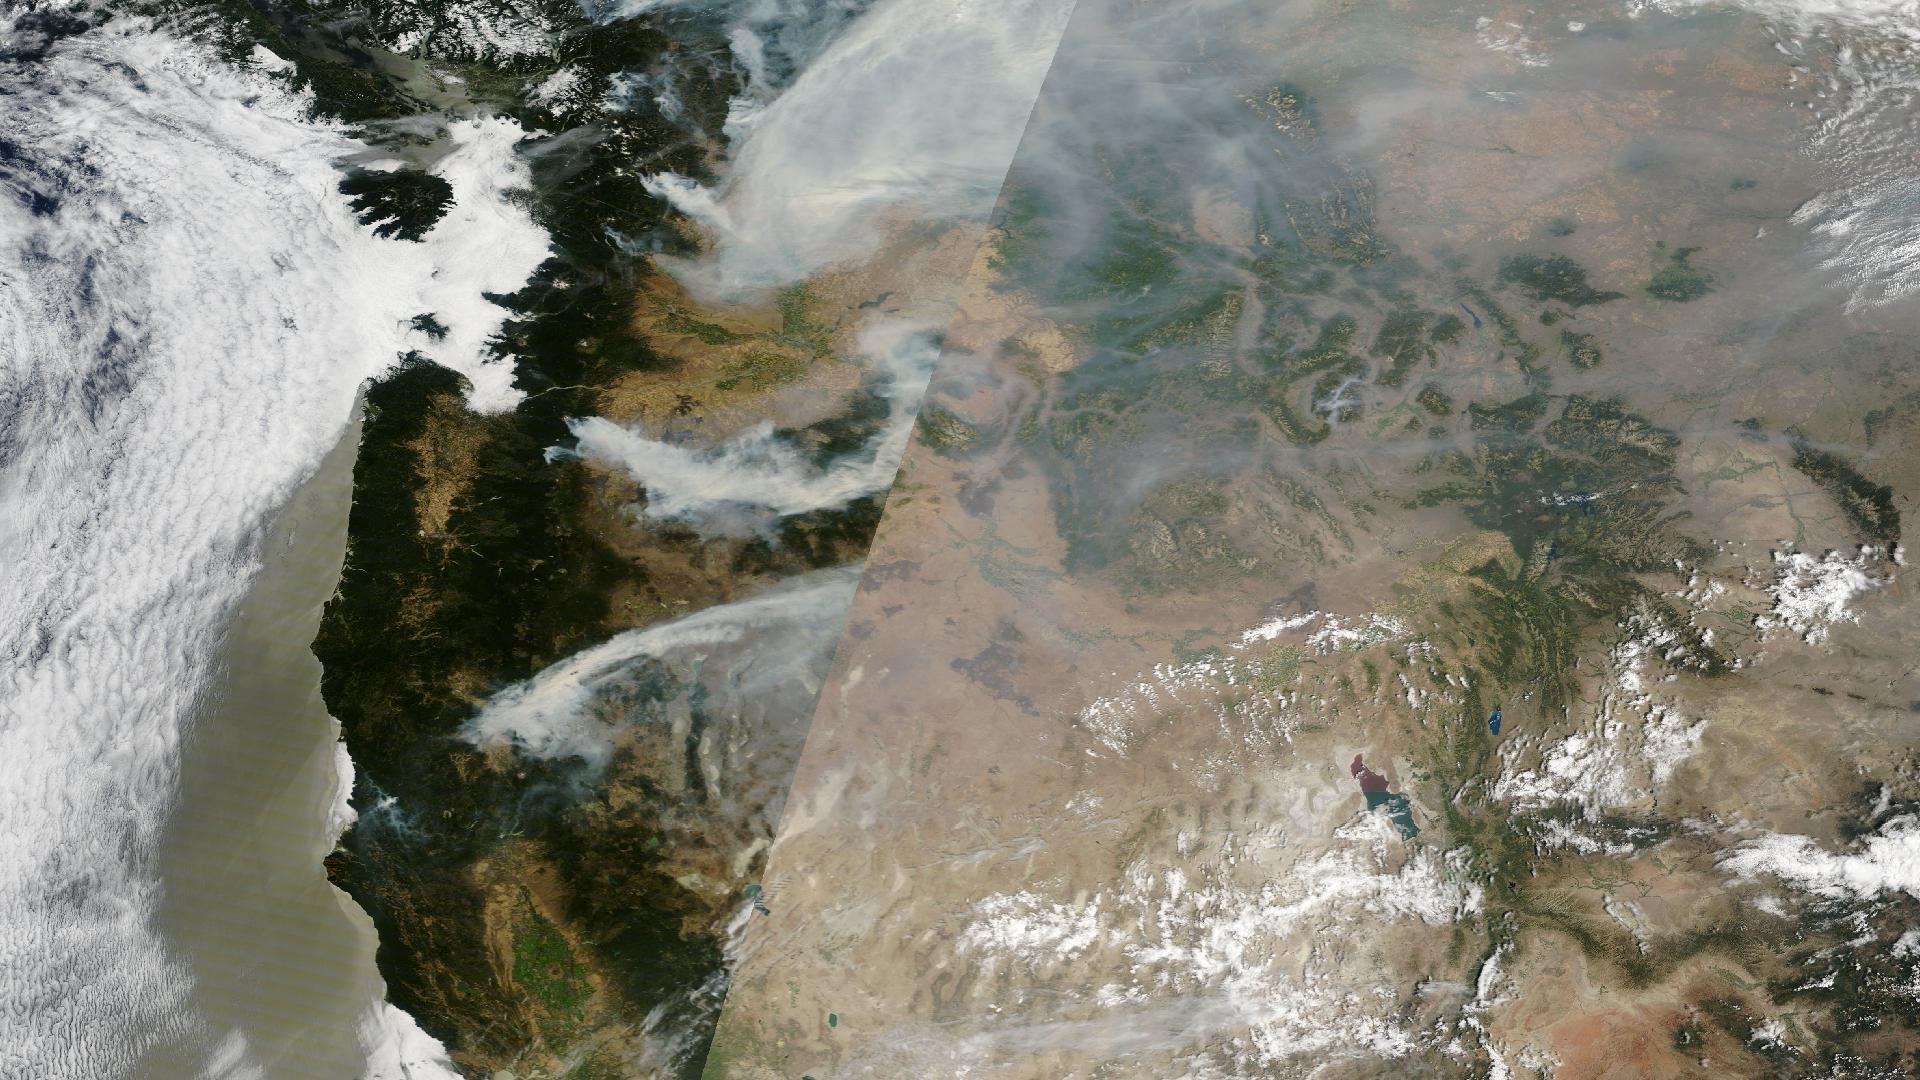
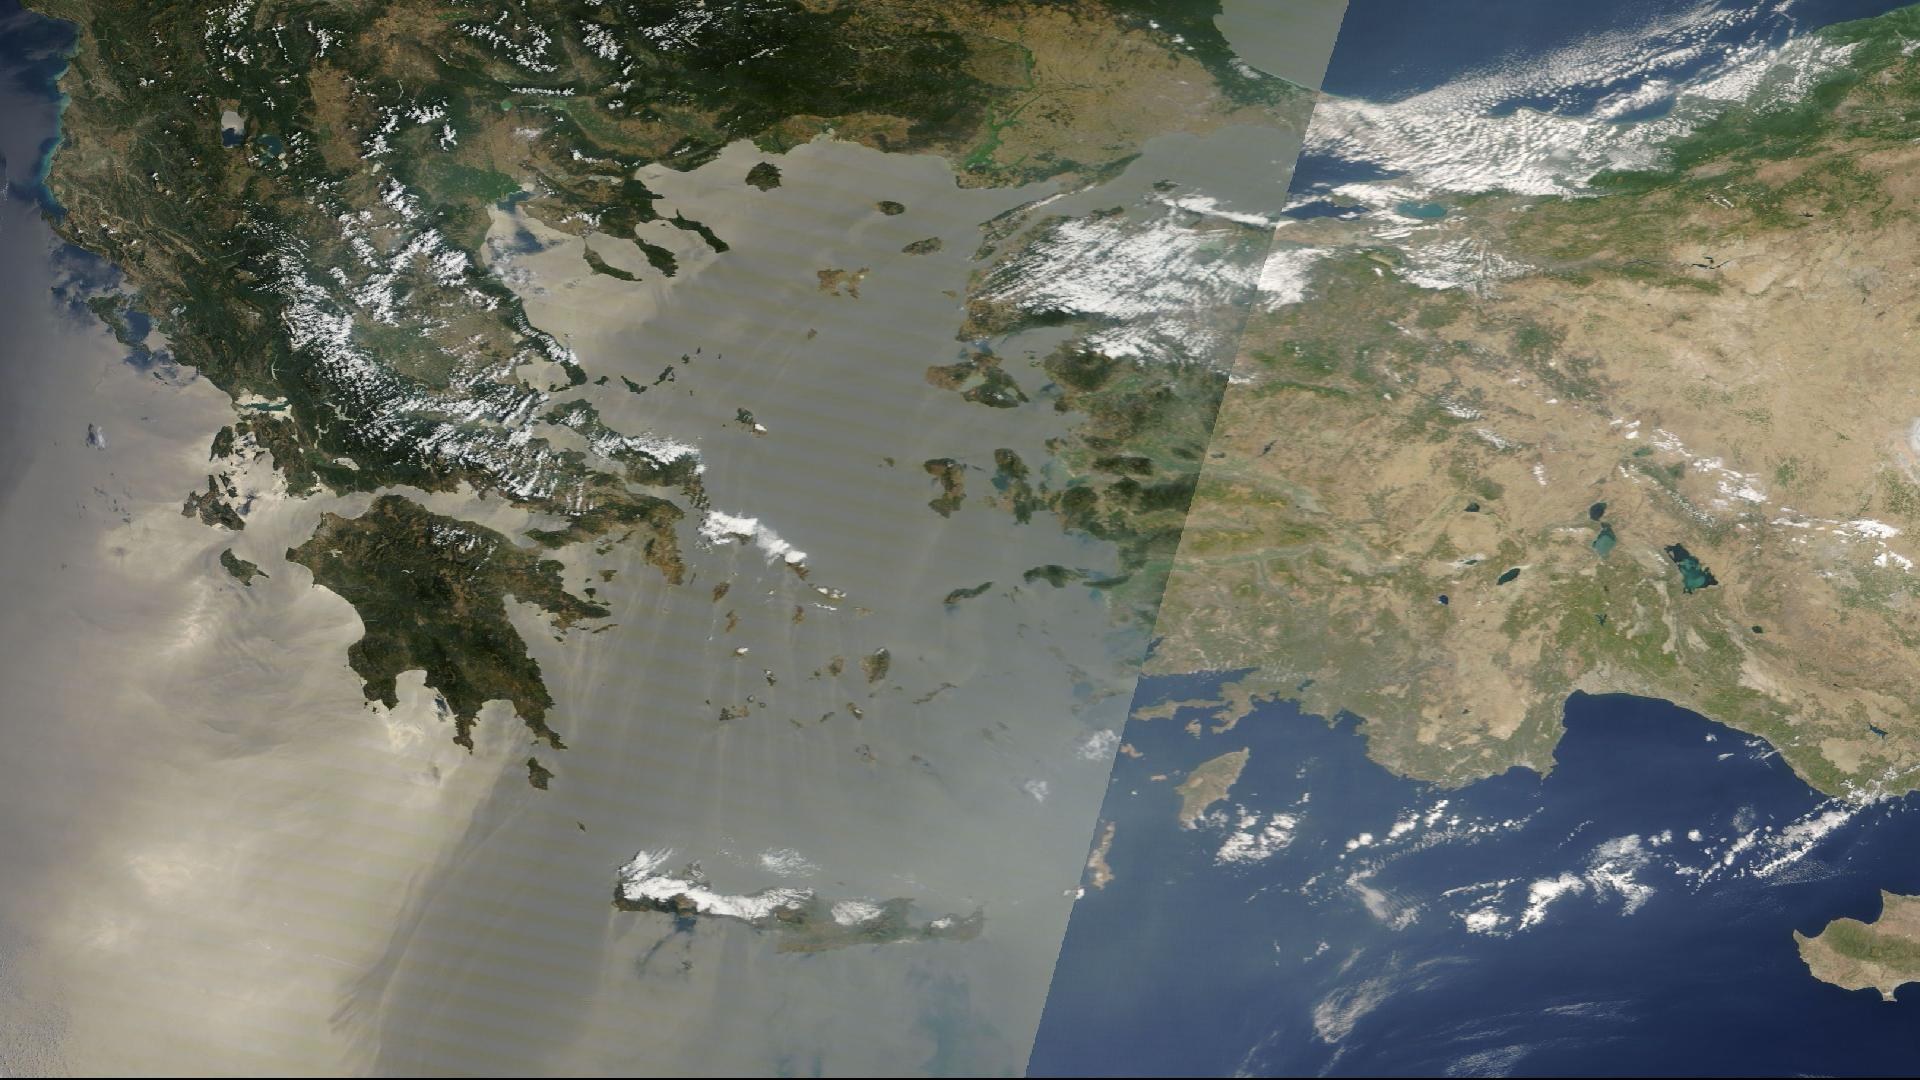
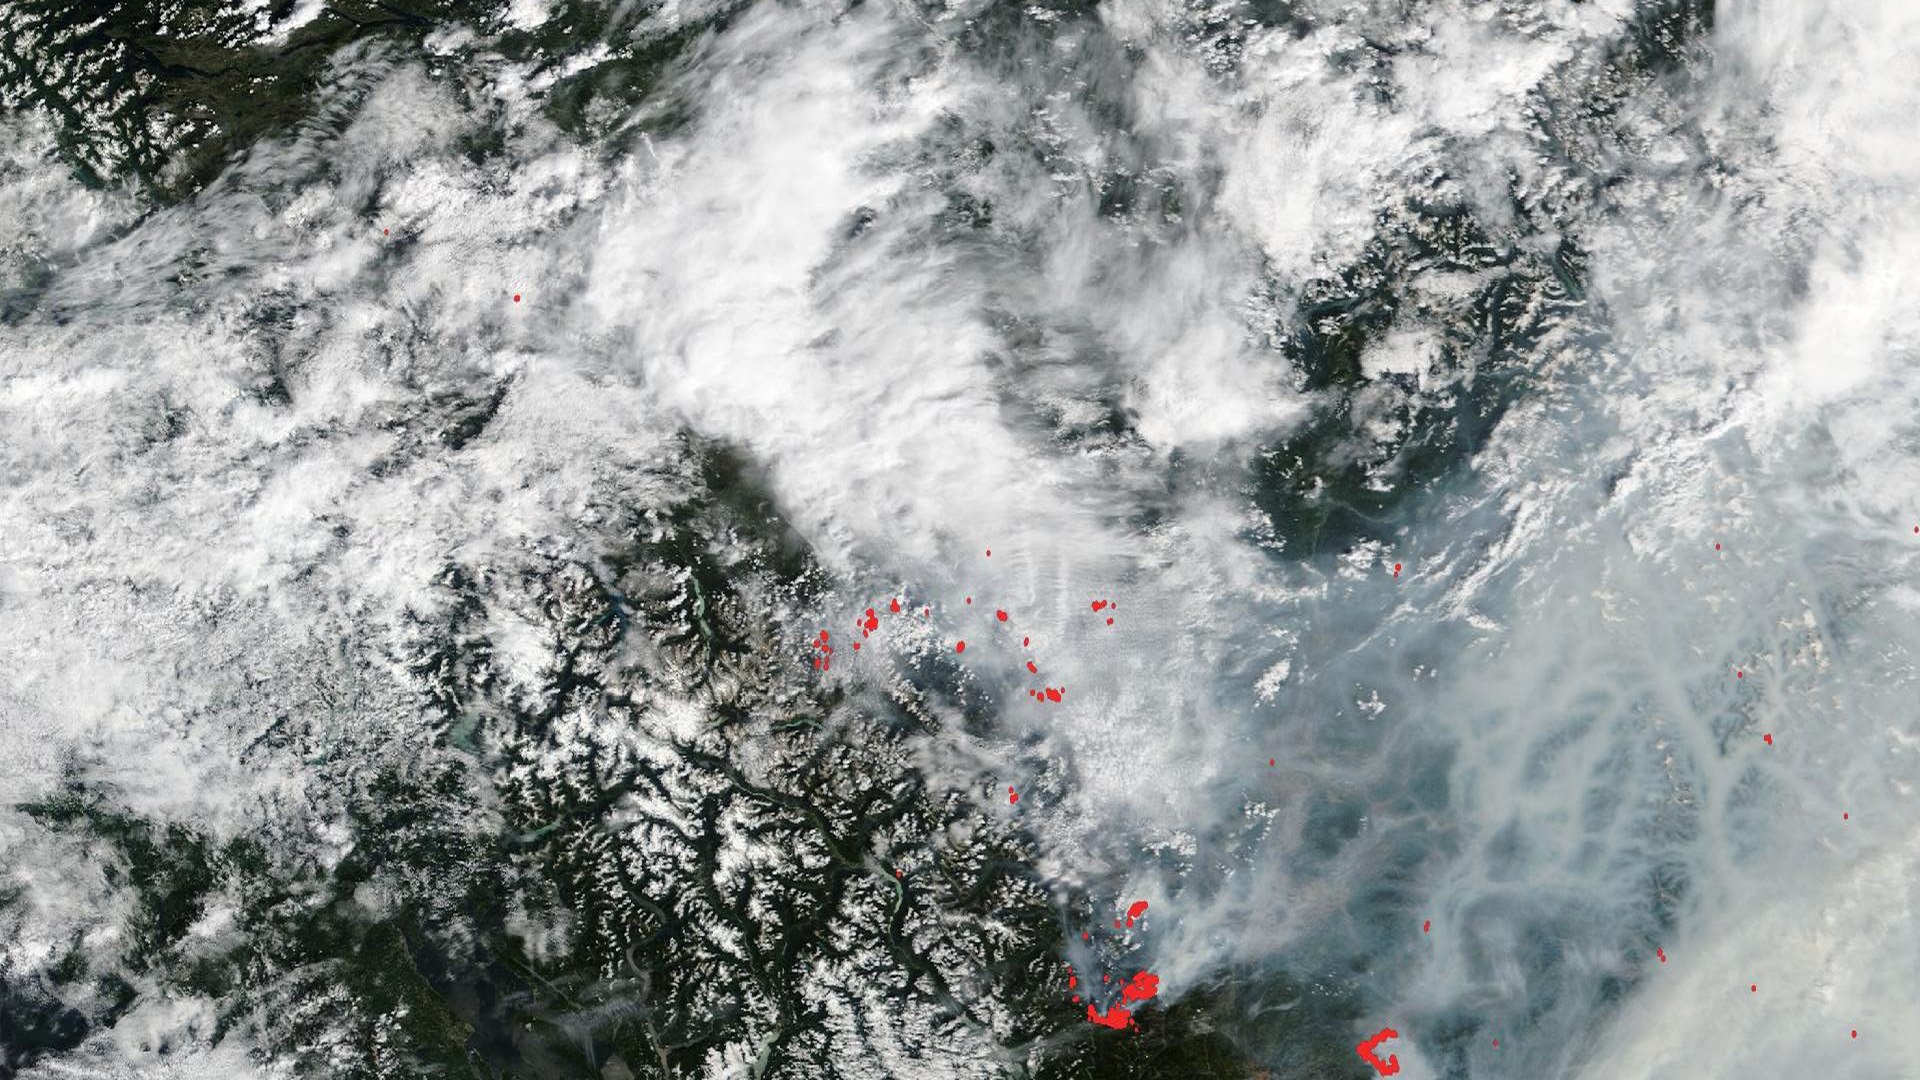
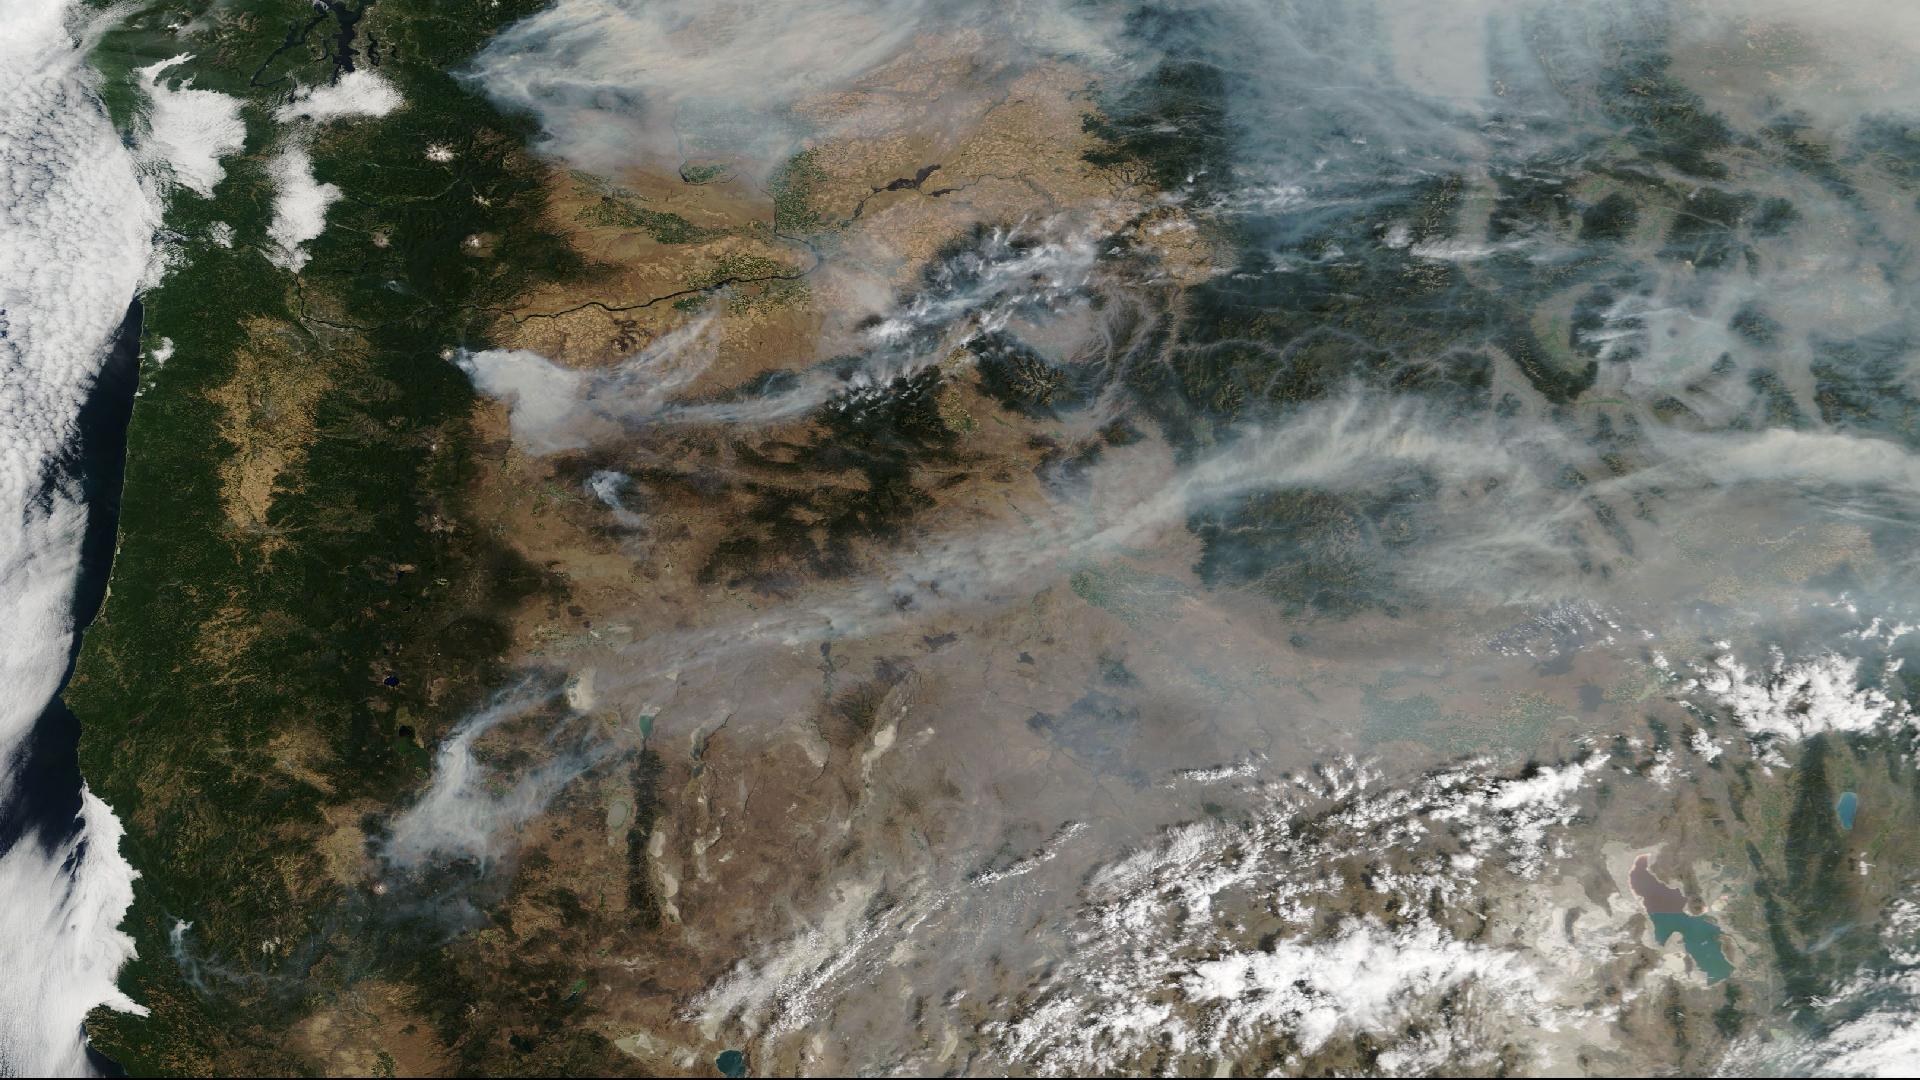
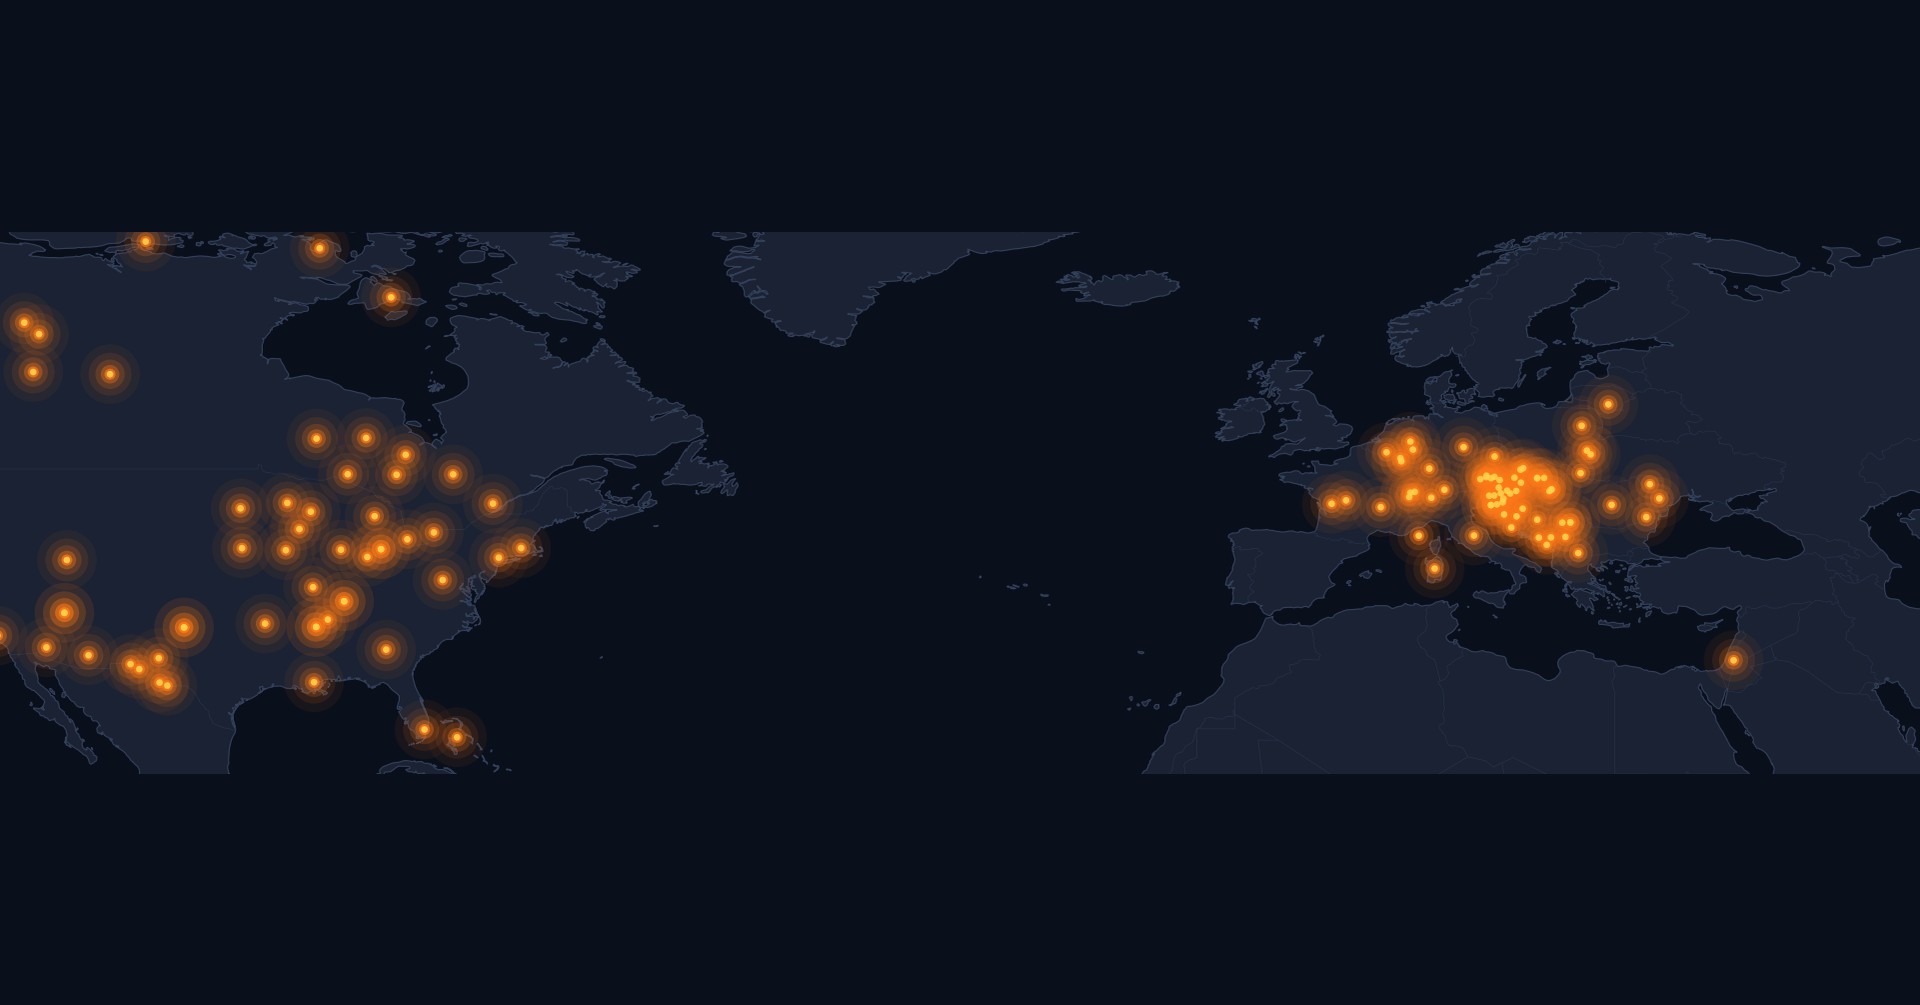
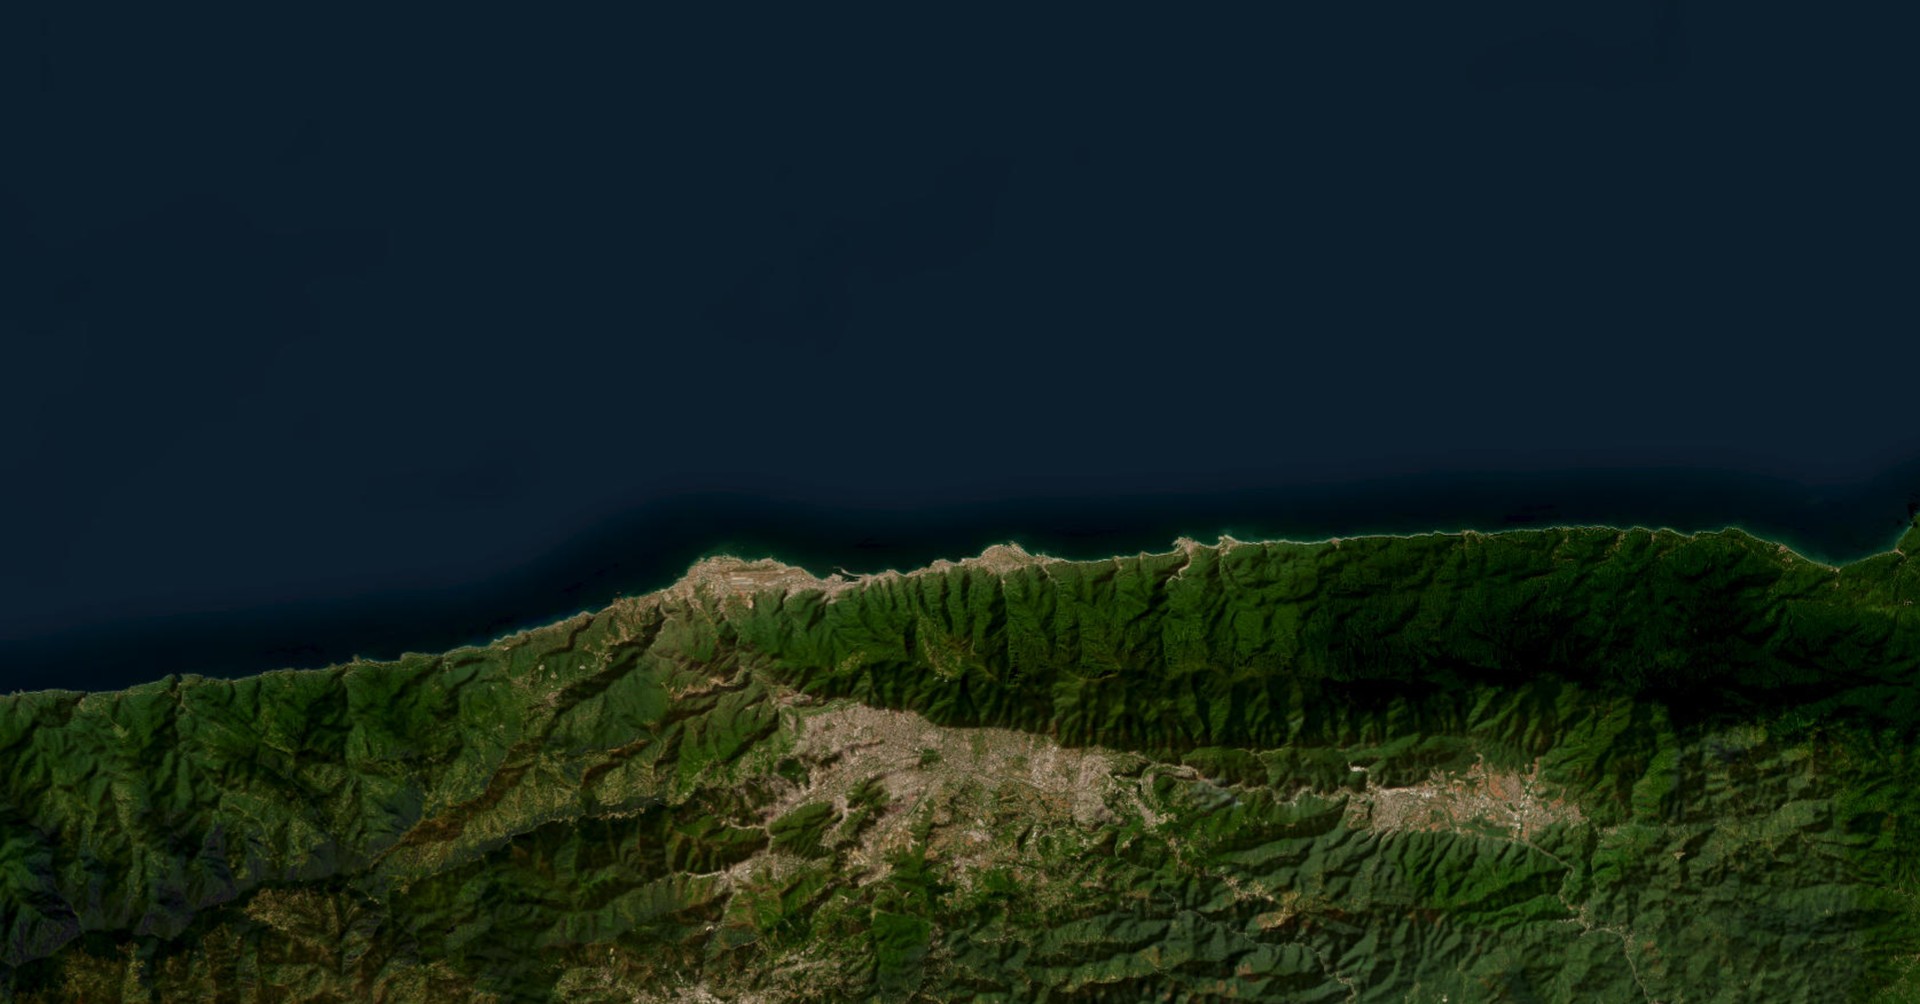
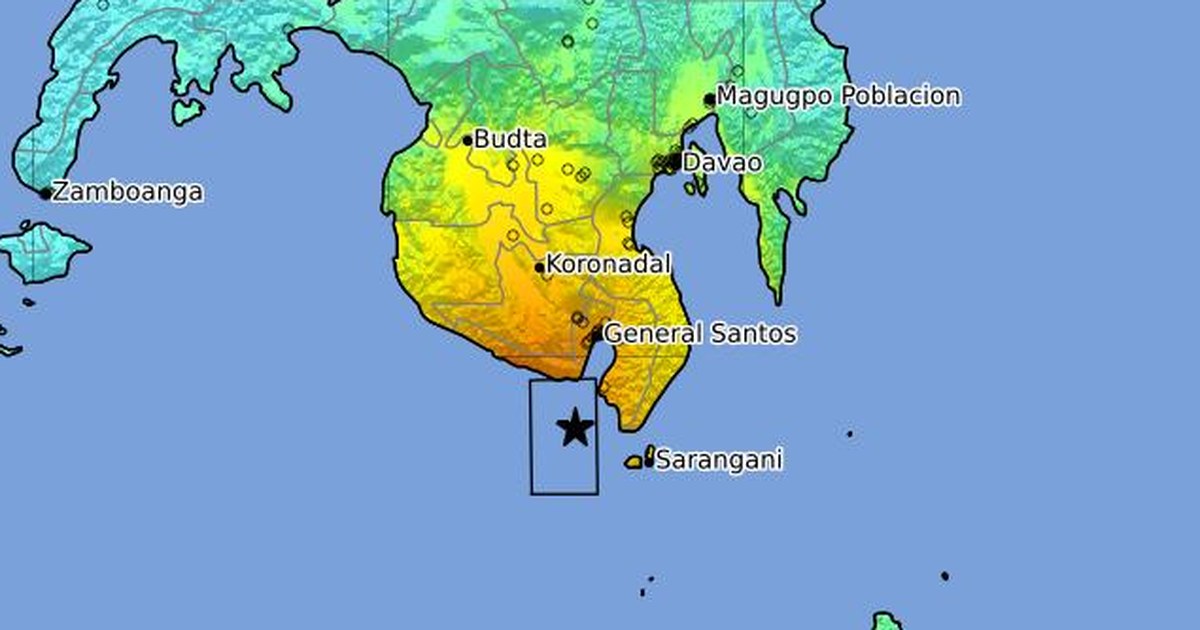
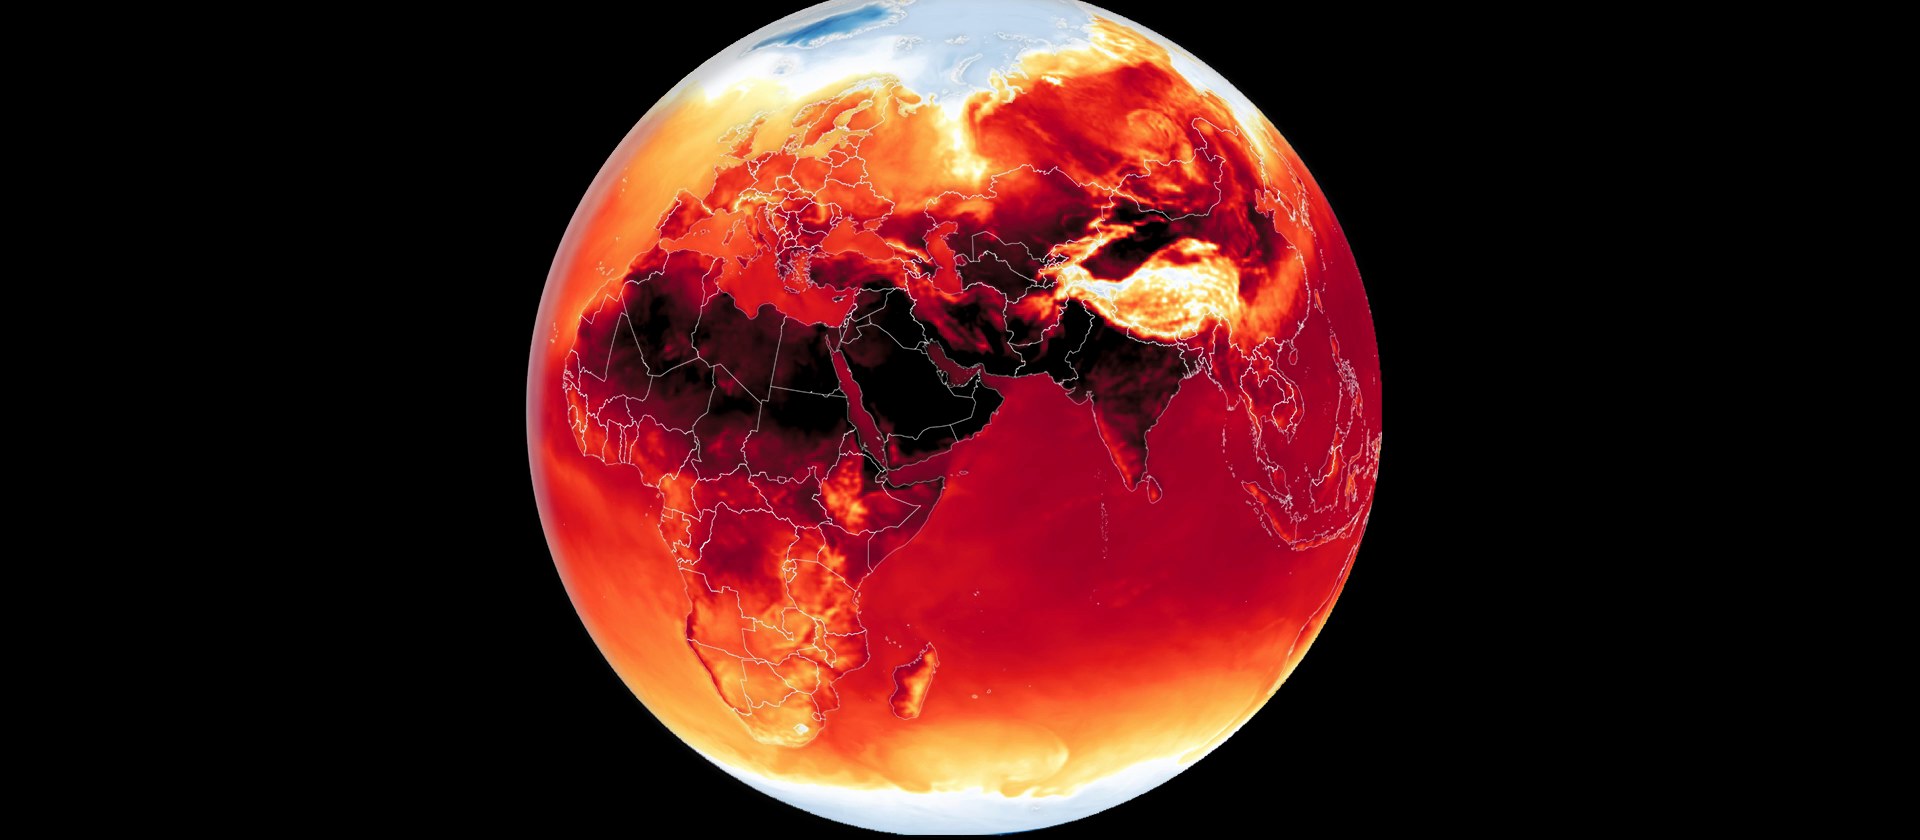
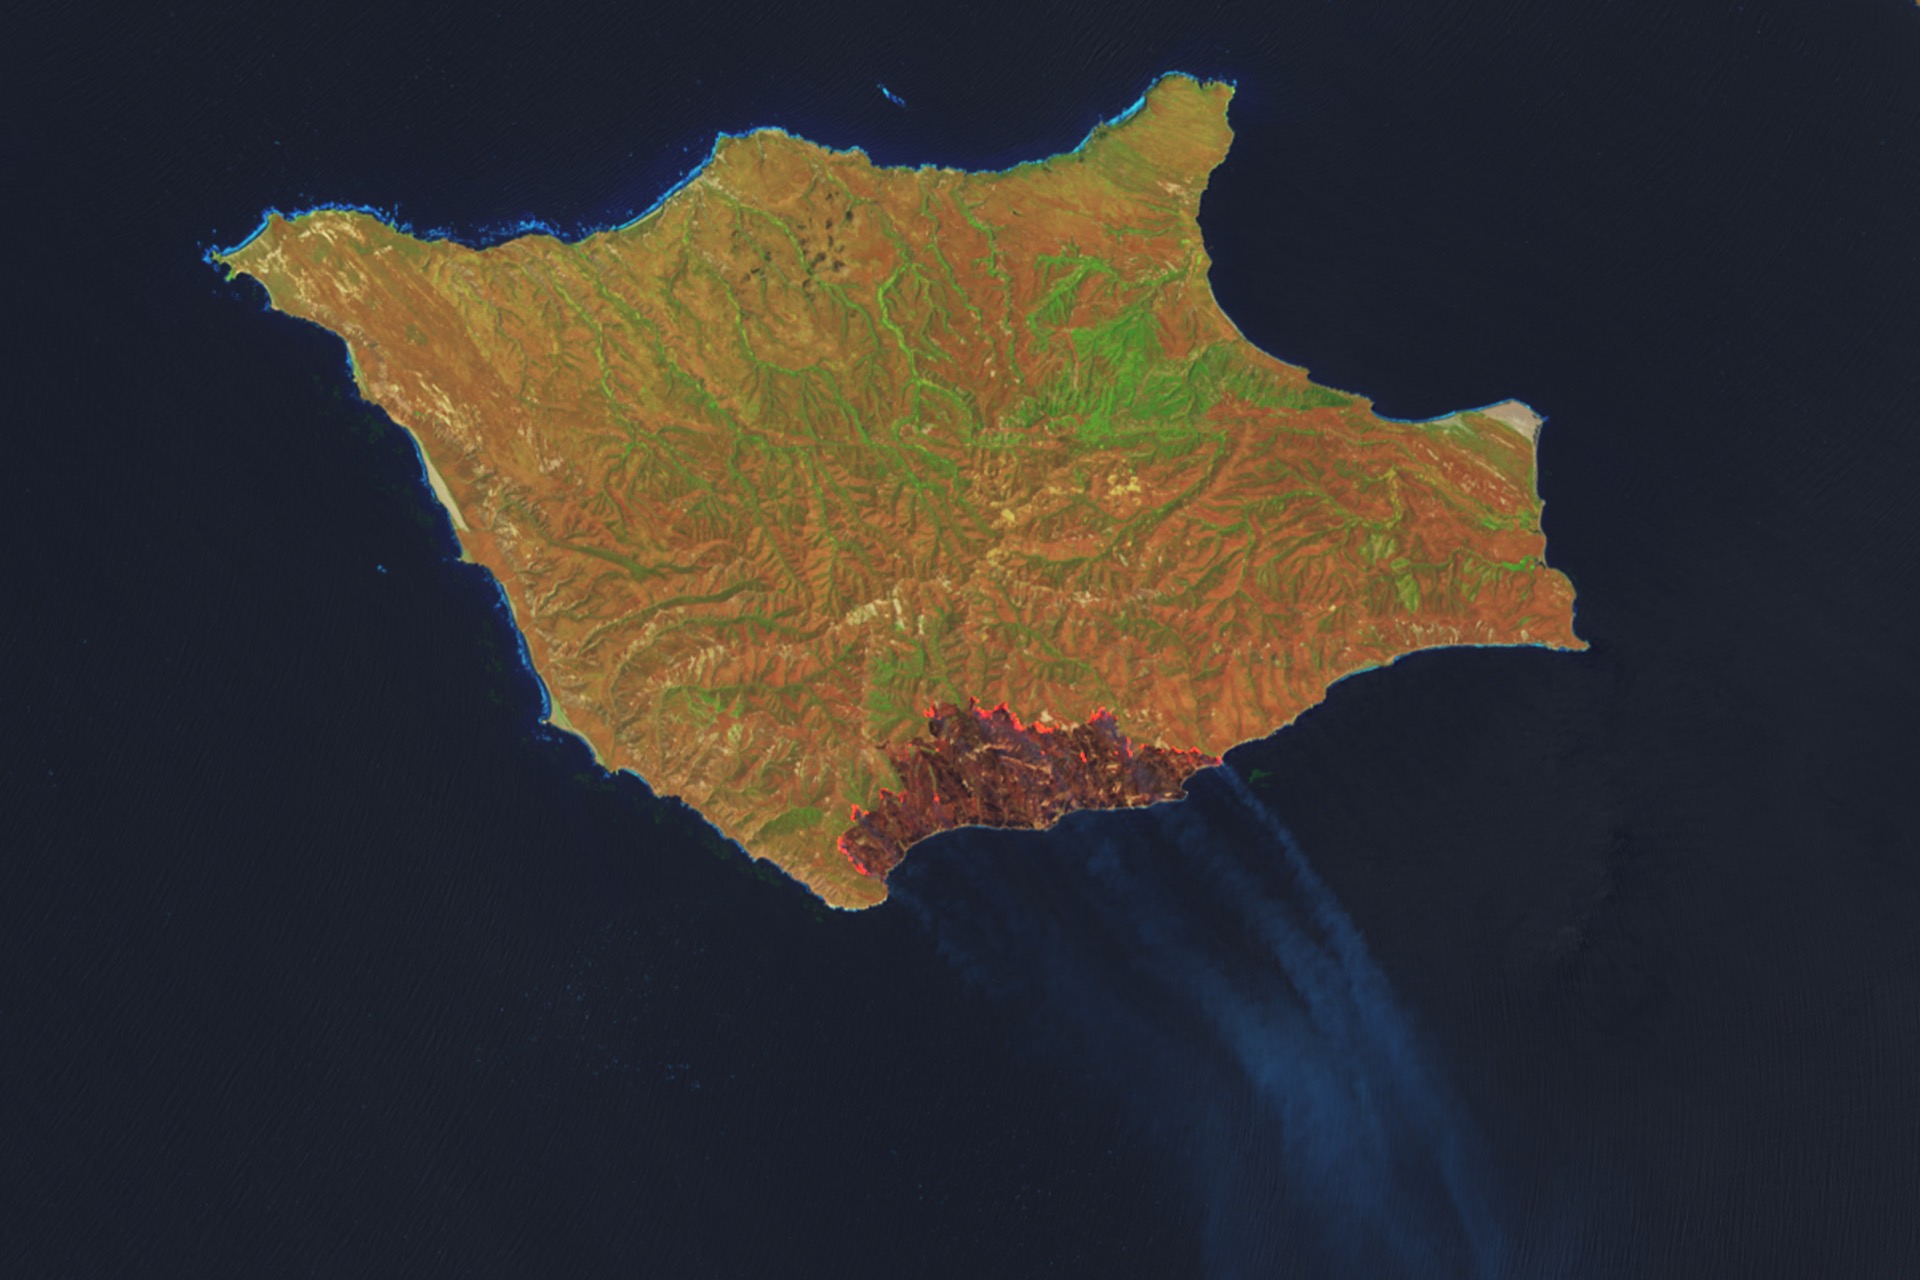
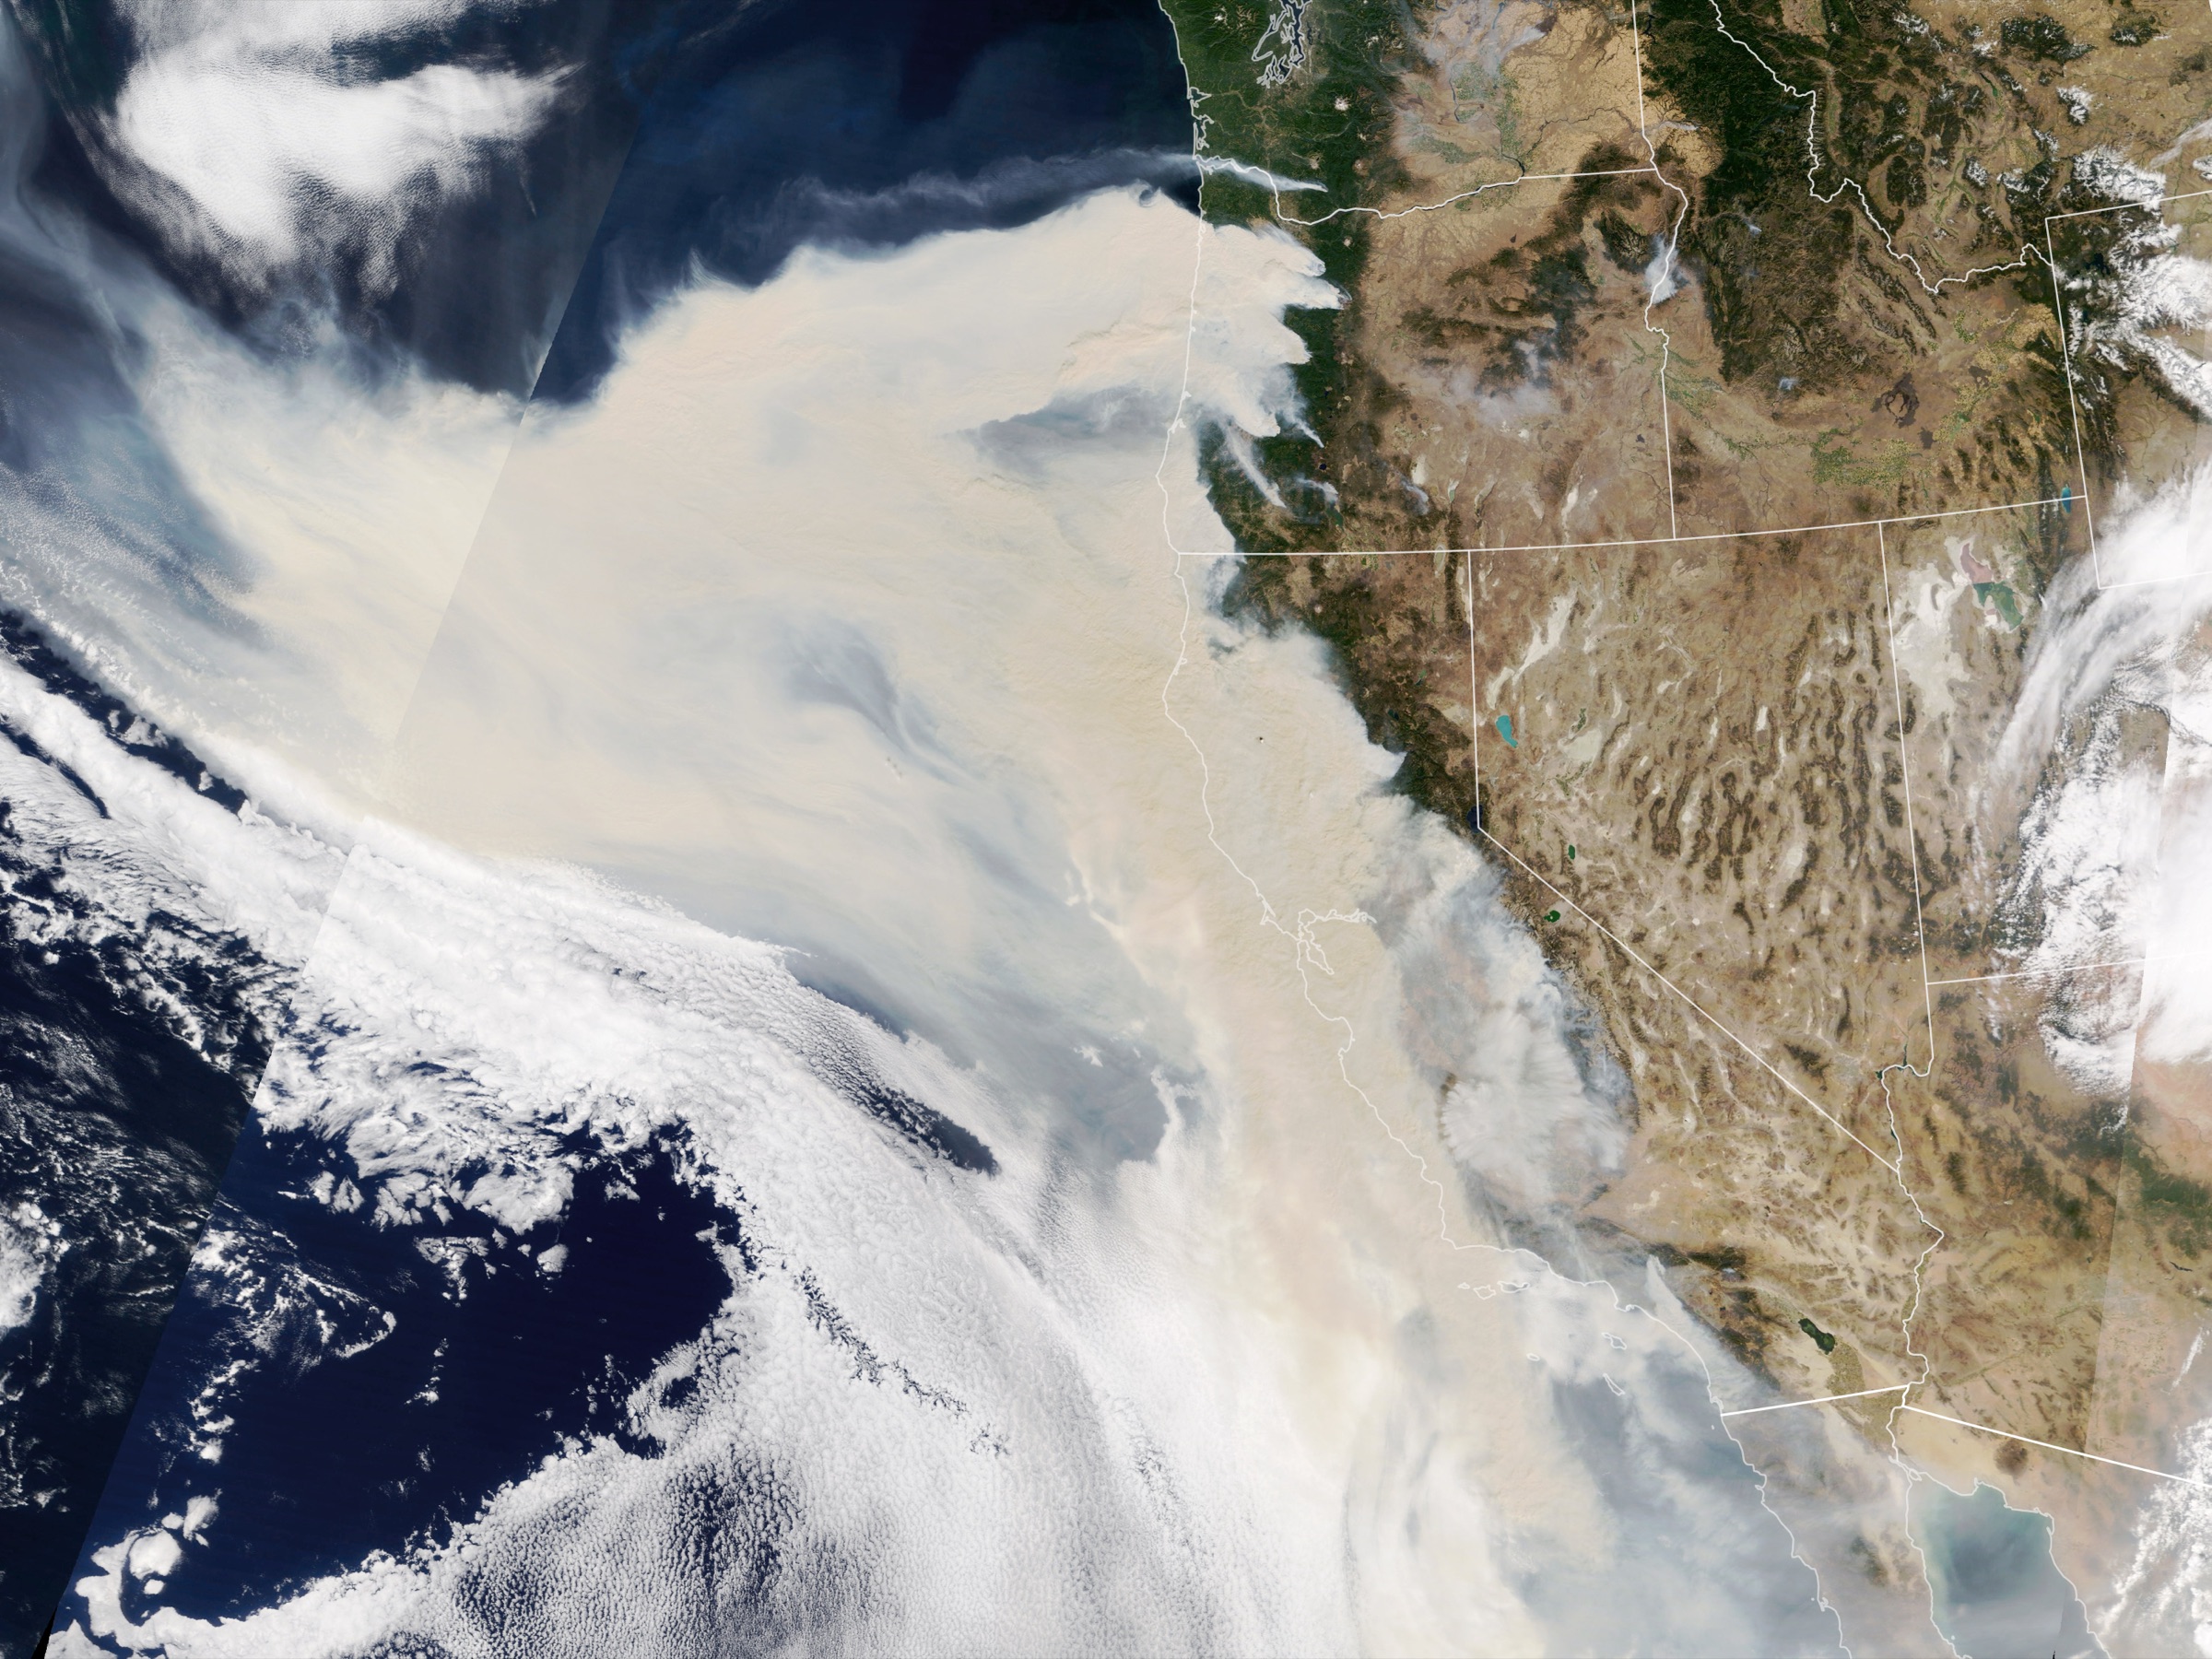
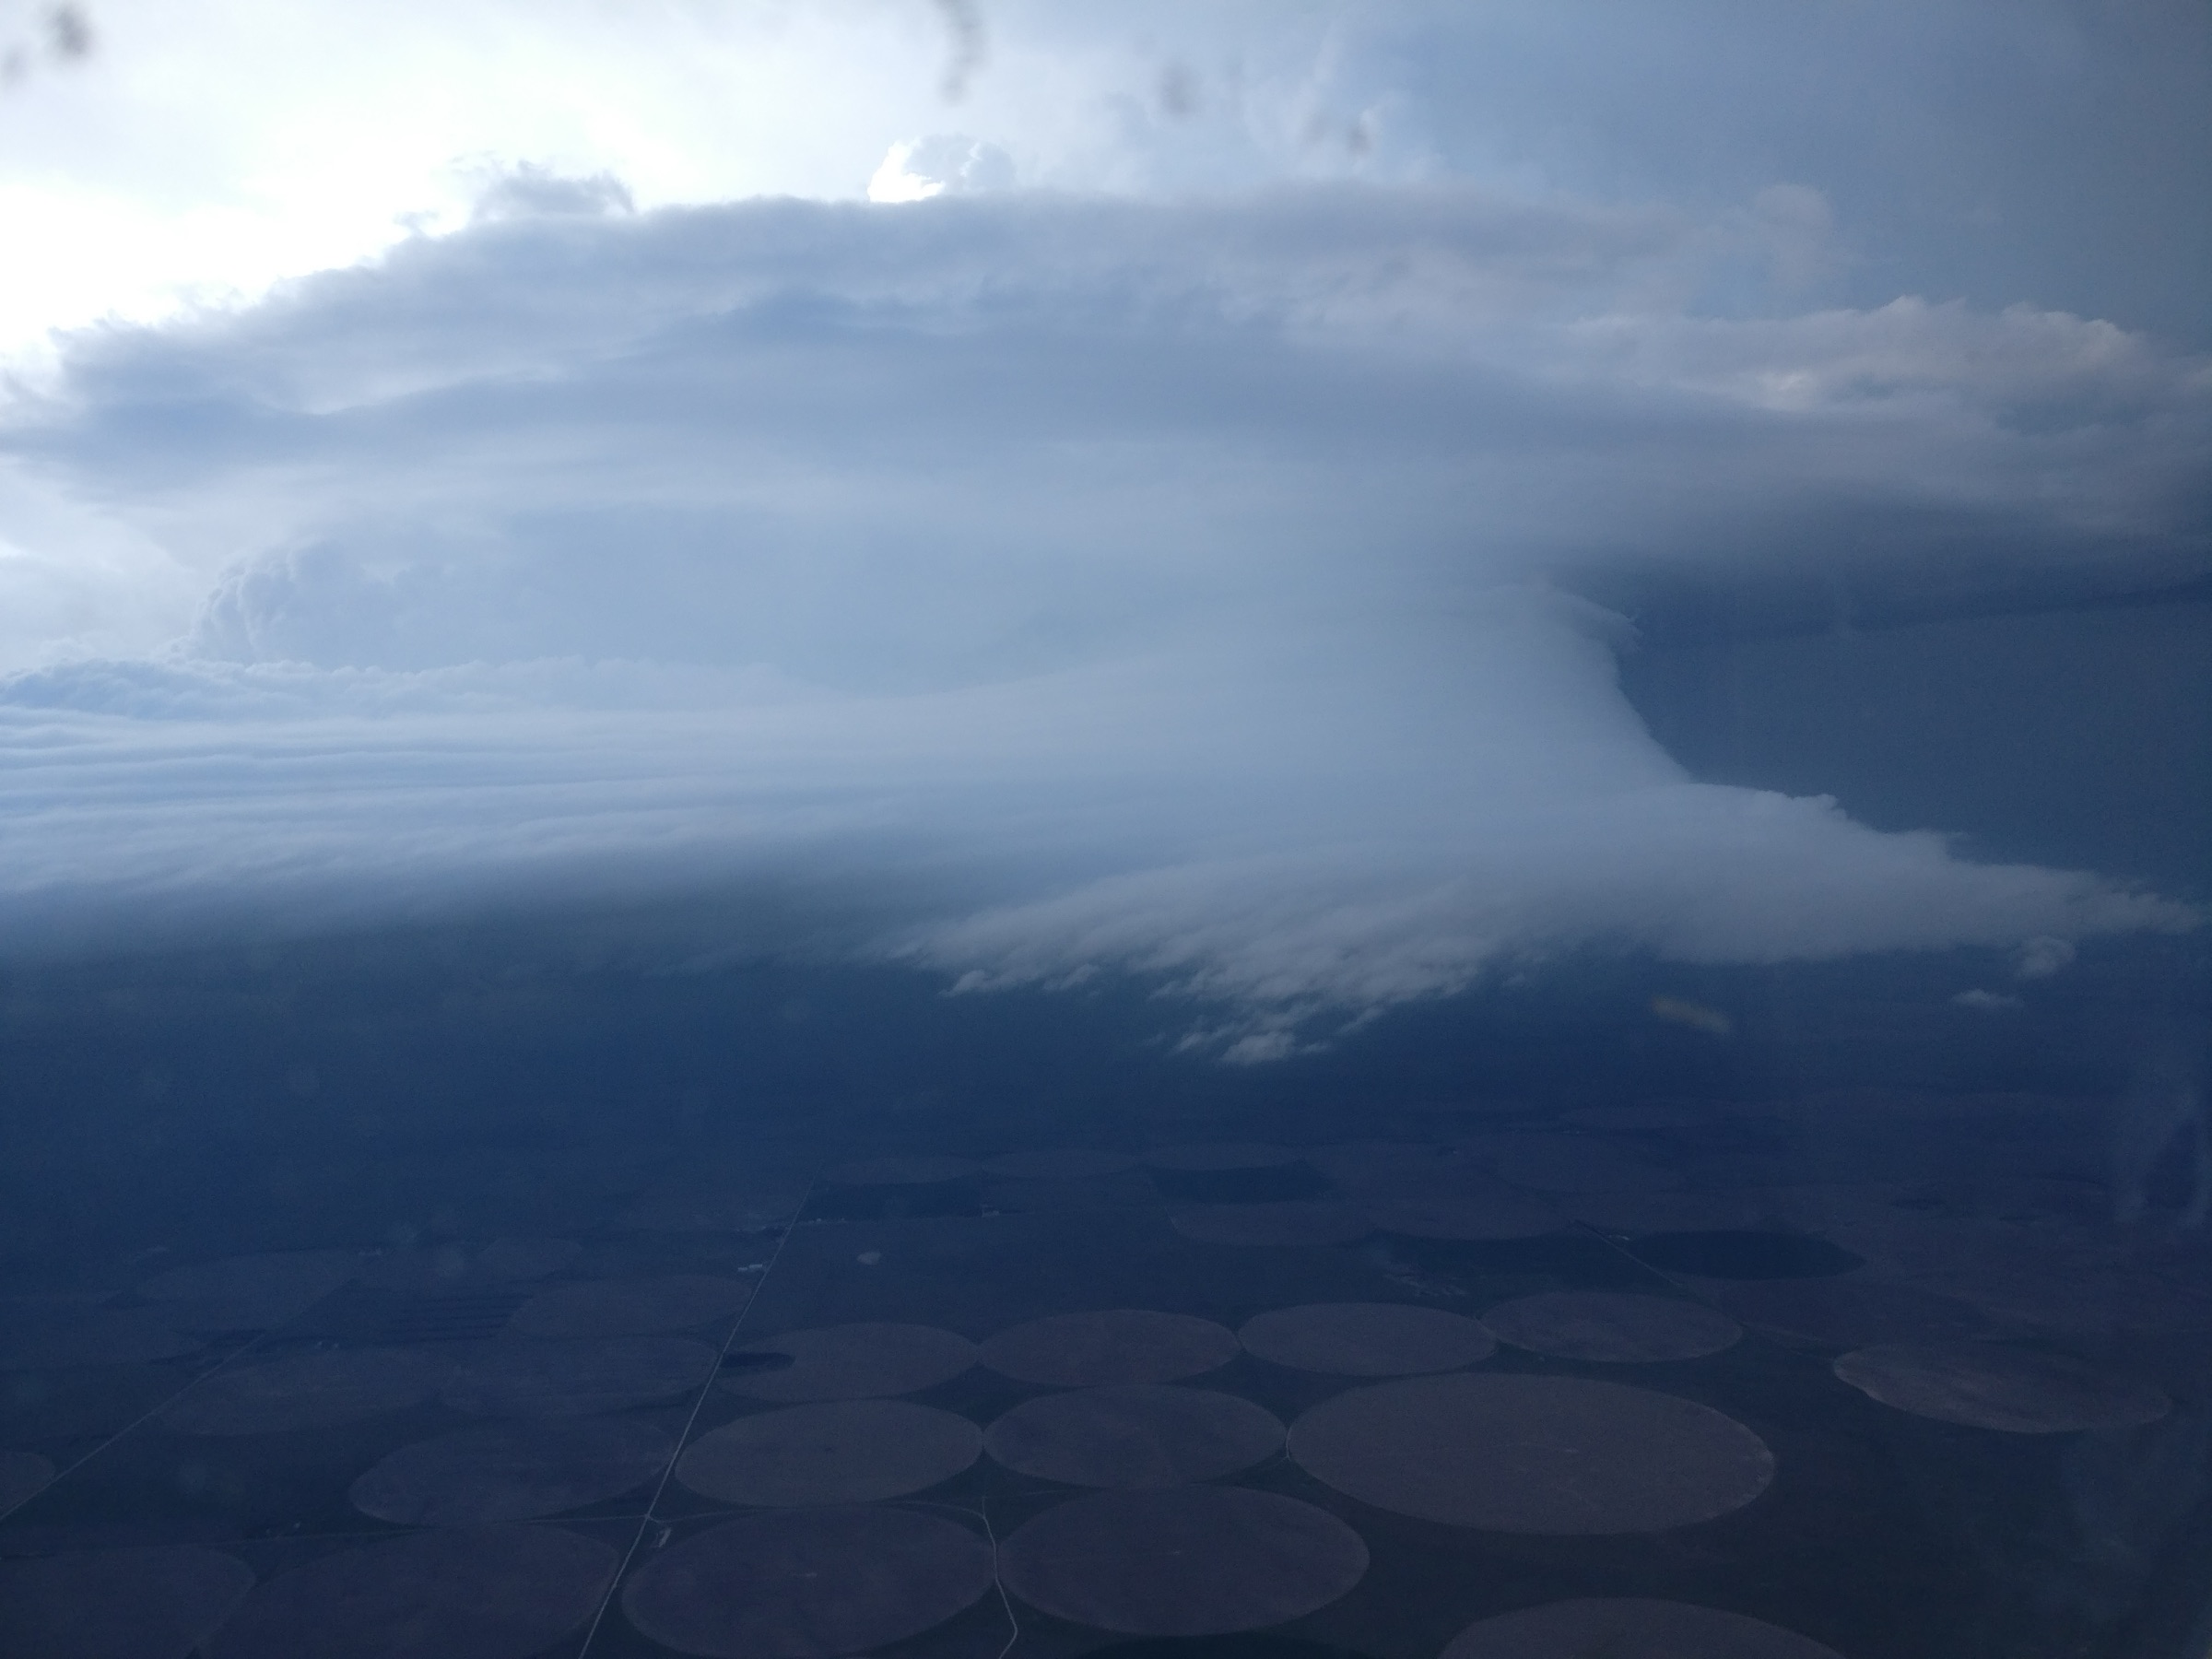
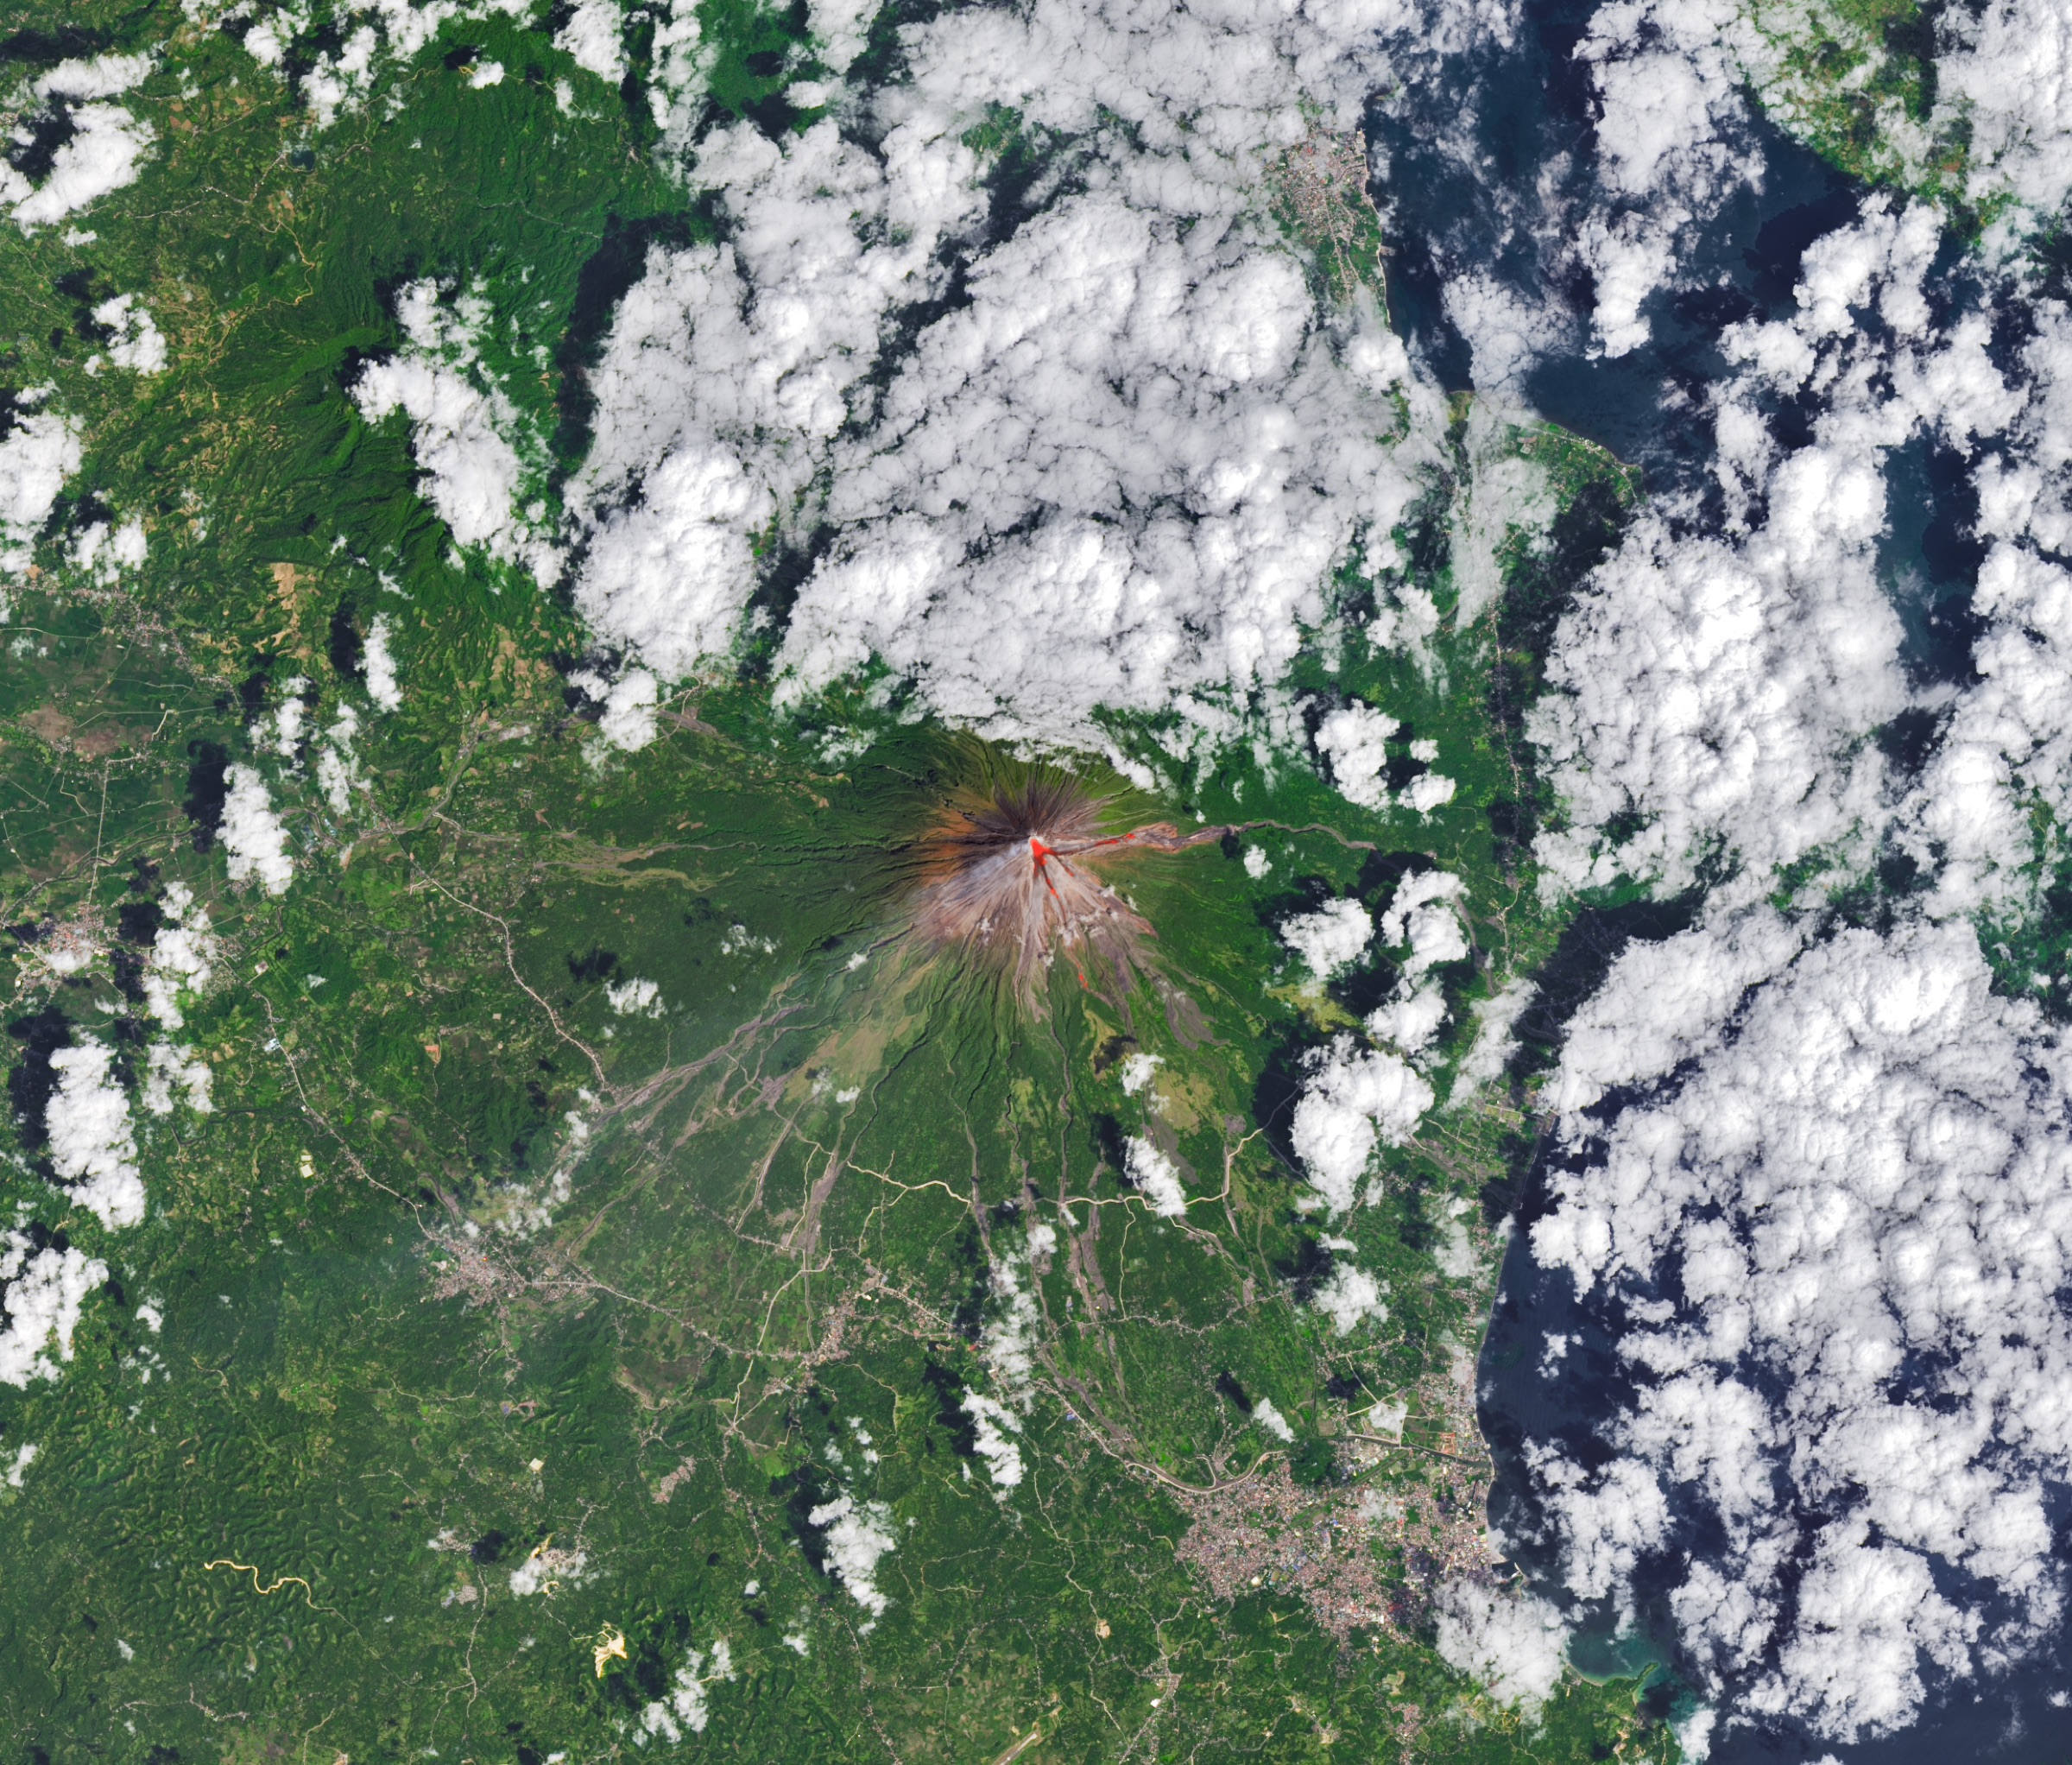
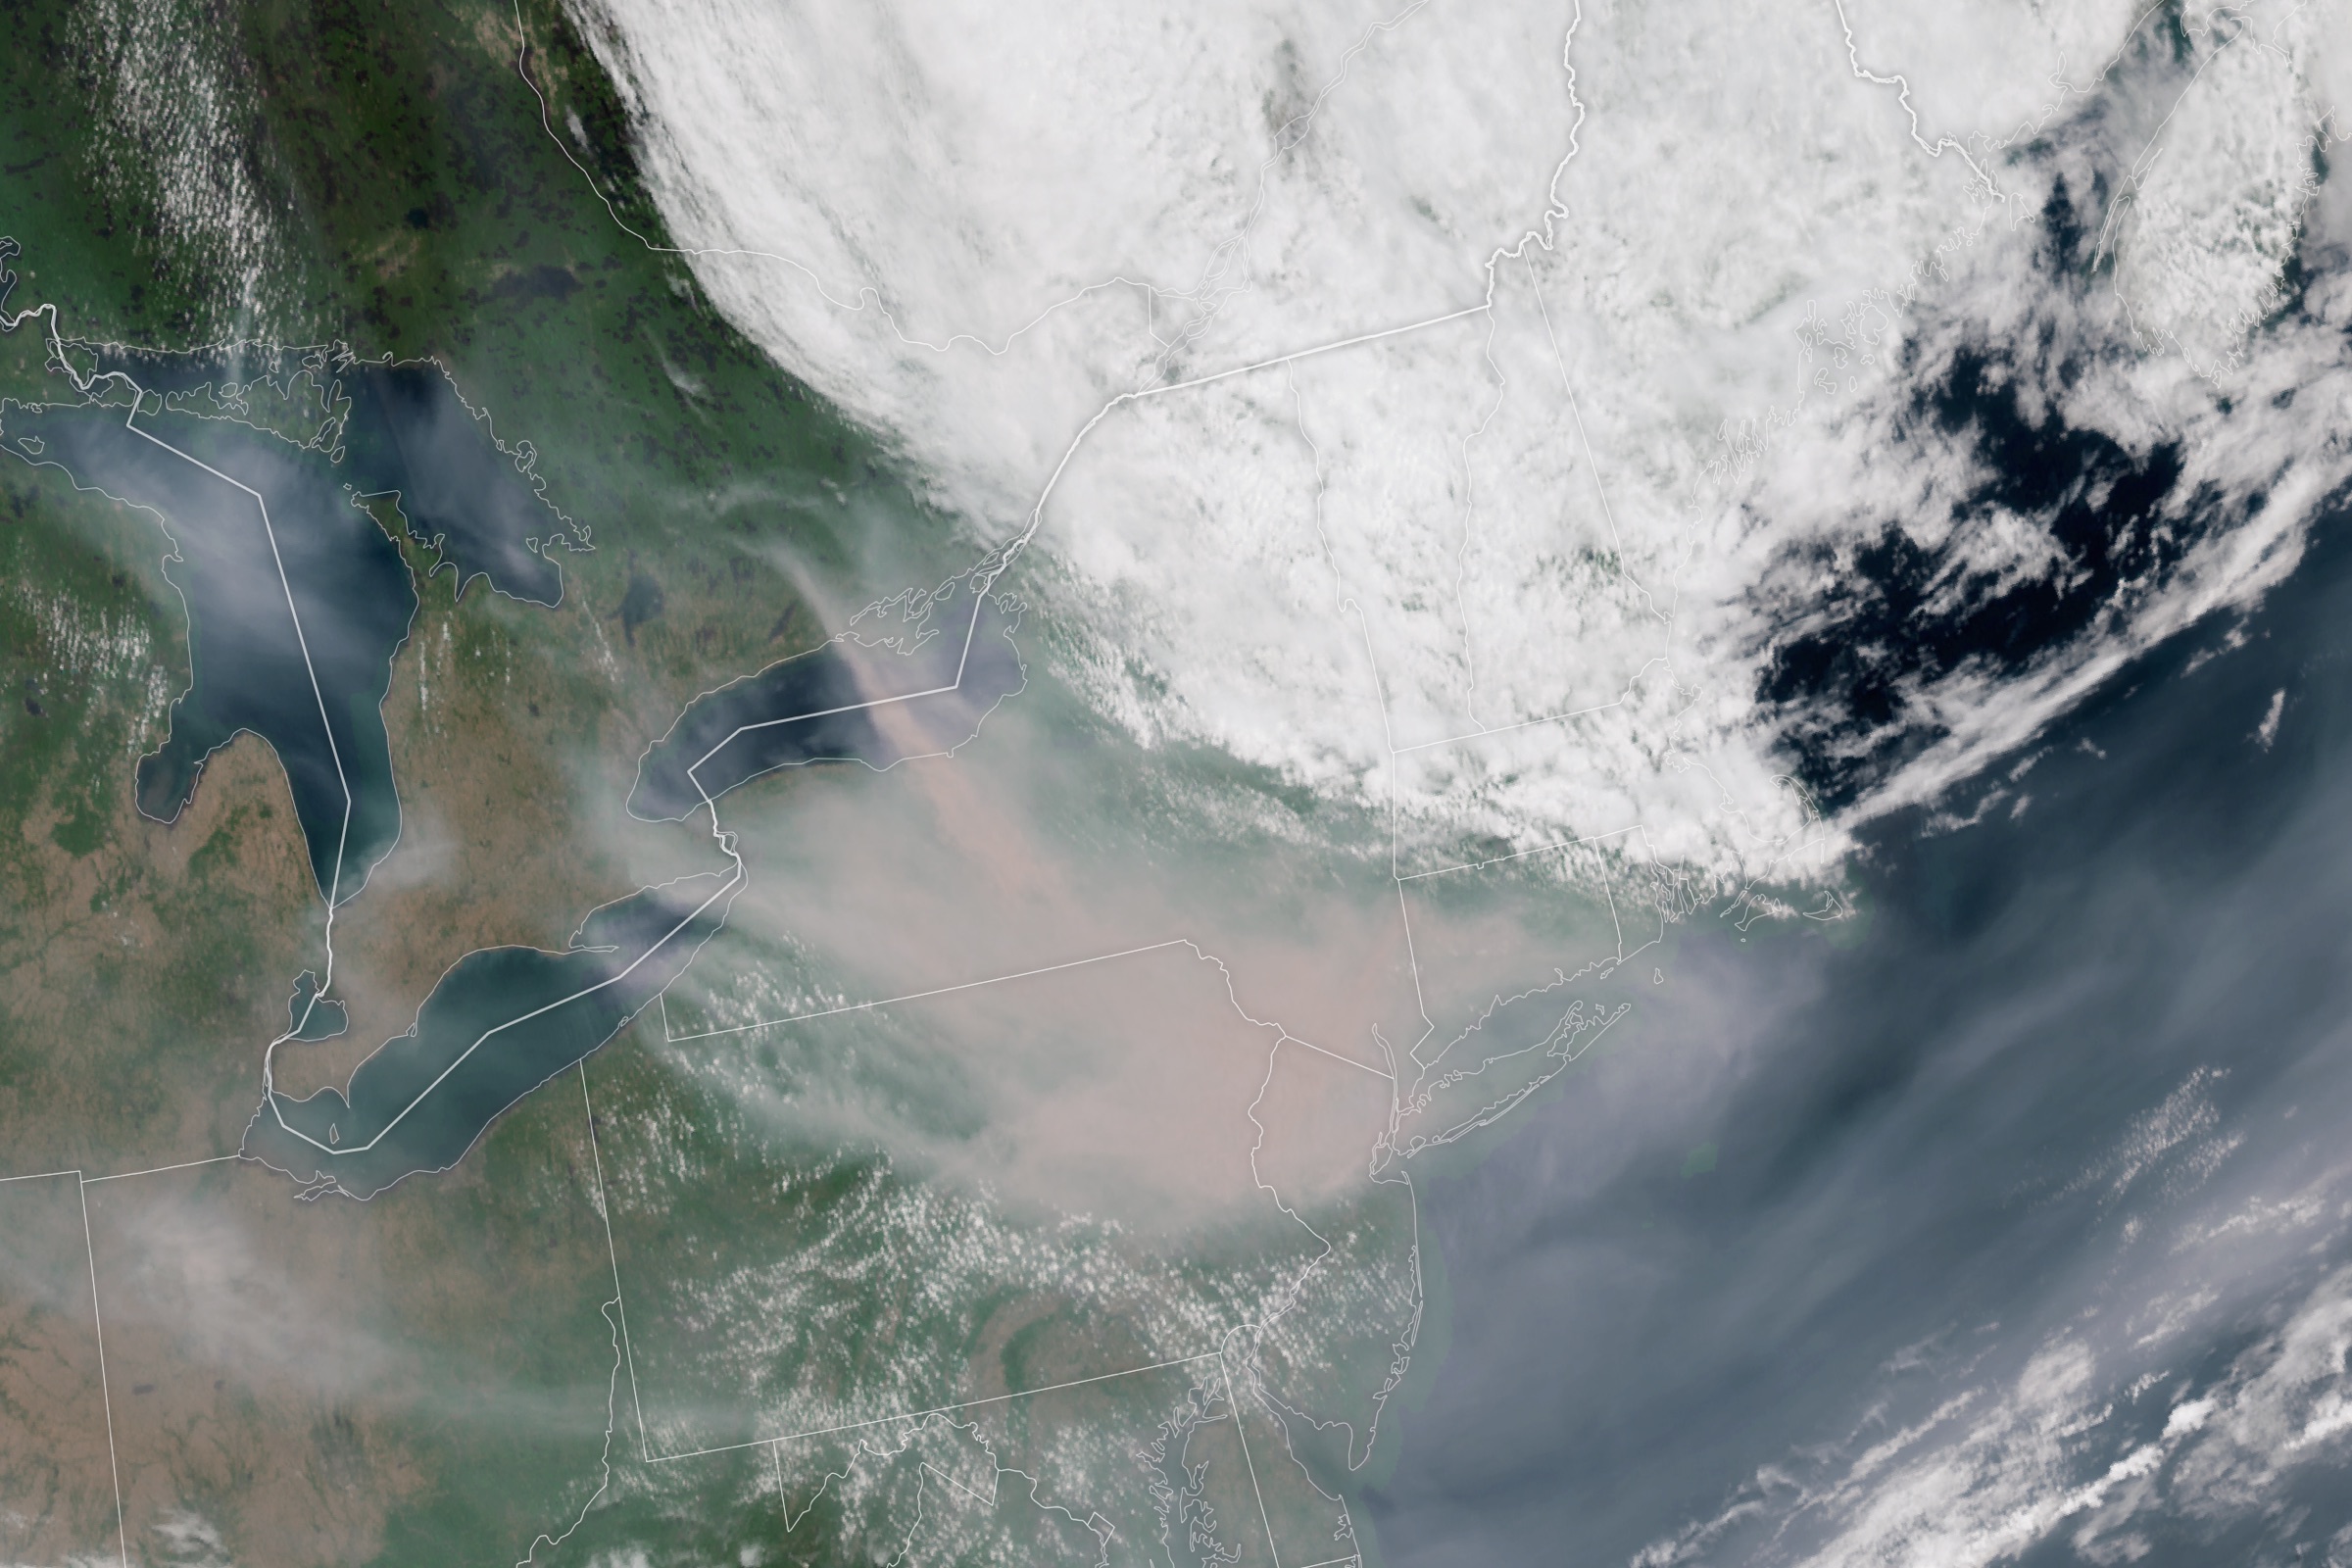
The observed-event layer, working in public, weekly:








-min.png)
.png)

.png)

Decision-ready intelligence for understanding what's happening, what is impacted, and what to do next. Global hazard, severe weather, catastrophe, and physical risk intelligence trusted by governments, enterprises, insurers, humanitarian organizations, and technology platforms worldwide.
Request DemoContact Us

