

April 15, 2026
On the night of April 13–14, a massive severe weather outbreak tore across the Central United States — producing 39 confirmed tornadoes (including an EF3), 785 hail reports (including two reports of 6-inch grapefruit-sized hail), and engaging 21 National Weather Service forecast offices across seven states. It was the most significant severe weather event since the deadly March tornado outbreak that included the nation's first EF5 since 2013.
But the raw numbers only tell part of the story. What sets this event apart from a risk intelligence perspective isn't just what happened — it's the depth of verified, structured data that DisasterAWARE captured for every tornado track, every hail report, and every NWS damage assessment survey point. This is the data that transforms a severe weather event from a news headline into an operational asset for insurance, supply chain, and emergency management teams.
This map shows all 39 tornado events with damage paths, 785 hail reports sized and colored by diameter, tornado warning polygons, and NWS damage assessment survey points. Click any marker for event details.
Data: NWS storm reports, damage assessment teams (DAT), tornado warning polygons, and severe thunderstorm warnings across 21 WFO jurisdictions. Visualization powered by DisasterAWARE.
This map zooms into one storm tracked by the Topeka, KS (TOP) Weather Forecast Office — showing the level of detail DisasterAWARE captures for a single supercell: 217 hail reports, 3 confirmed tornadoes (EF2), 4 documented damage paths, and 84 individual NWS damage survey points.
Data: NWS Topeka (TOP) damage assessment team surveys, hail reports, tornado warnings. Every pink dot is a location visited and assessed by NWS field teams.
The outbreak developed as a potent spring storm system pushed east across the Great Plains during the late afternoon and evening hours of April 13, intensifying through the overnight hours into the early morning of April 14.
Thirty-nine tornadoes were confirmed across the outbreak — a number that places this event among the most prolific single-day tornado events of 2026. The strongest, an EF3, was documented by the La Crosse, Wisconsin (ARX) Weather Forecast Office, with a track of 8.8 miles. Multiple EF2 tornadoes struck in the Kansas City (EAX) and Topeka (TOP) WFO areas, with documented injuries.
The tornado activity spanned an enormous geographic range — from California (Sacramento WFO) to Wisconsin (Milwaukee WFO), with the heaviest concentration across Kansas, Missouri, and South Dakota. Seven NWS forecast offices documented tornado events:
The EF3 in Wisconsin continues a pattern that began with the March 2026 outbreak — significant tornadoes occurring in states and at times of year that historically see far less activity.
If the tornadoes were the headline, the hail was the financial story. 785 hail reports were logged across 21 NWS forecast offices — a staggering number for a single event. But it's the size distribution that matters most for insurance and property risk:
Six-inch hail is historically rare. To put it in perspective: hail above 4 inches is considered "giant hail" by the NWS and can penetrate standard roofing materials, shatter vehicle windshields, and cause injuries. Two reports of 6-inch hail in a single outbreak is a data point that insurance catastrophe modelers will be analyzing for months.
This is where the story shifts from "what happened" to "what can you do with it."
For every severe weather event, DisasterAWARE captures and structures multiple layers of verified intelligence — not from a single source, but from the integration of NWS warnings, field team surveys, and storm reports into a unified, queryable dataset.
The Kansas supercell deep-dive map illustrates this: 84 individual damage survey points for just 3 tornadoes from a single WFO. Each pink dot on that map represents a location where an NWS team physically went, assessed the damage, and assigned an EF rating. That's the ground truth that validates — or invalidates — insurance claims.
For insurance and reinsurance teams: 785 hail reports with precise sizes and locations, correlated with tornado damage paths, provide the foundation for claims validation, exposure assessment, and parametric trigger evaluation. This isn't newspaper data — it's structured, geolocated, time-stamped intelligence that maps directly to insured properties.
For supply chain and logistics: 21 WFOs across seven states means this outbreak likely impacted highways, rail corridors, distribution centers, and agricultural operations across the entire Central US. The damage path data shows exactly where.
For corporate risk and business continuity: Knowing an EF3 tornado hit Wisconsin or that 6-inch hail fell in Kansas is useful. Knowing the exact track, the exact time, and the exact damage assessment for each event is what enables the after-action reporting that boards and regulators require.
Every tornado track, every hail report, and every NWS survey point from this outbreak now joins DisasterAWARE's historical database — a repository spanning 125+ years and 340,000+ events. This isn't just archive — it's the foundation for:
The March 2026 EF5 was the first in the US since 2013. This April EF3 in Wisconsin — a state that rarely sees tornadoes this strong this early — adds another data point to the growing evidence that severe tornado events are shifting in both geography and seasonality.
This outbreak is a reminder that the 2026 severe weather season is not slowing down. The March EF5 was historically early. This April outbreak produced 39 tornadoes and historically large hail. The drought conditions across the Western US and the La Niña pattern both suggest continued above-average severe weather risk through the spring.
DisasterAWARE's tornado intelligence provides real-time tracking from the initial tornado warning through NWS damage assessment team surveys — the complete lifecycle of each event, structured for decision-making.
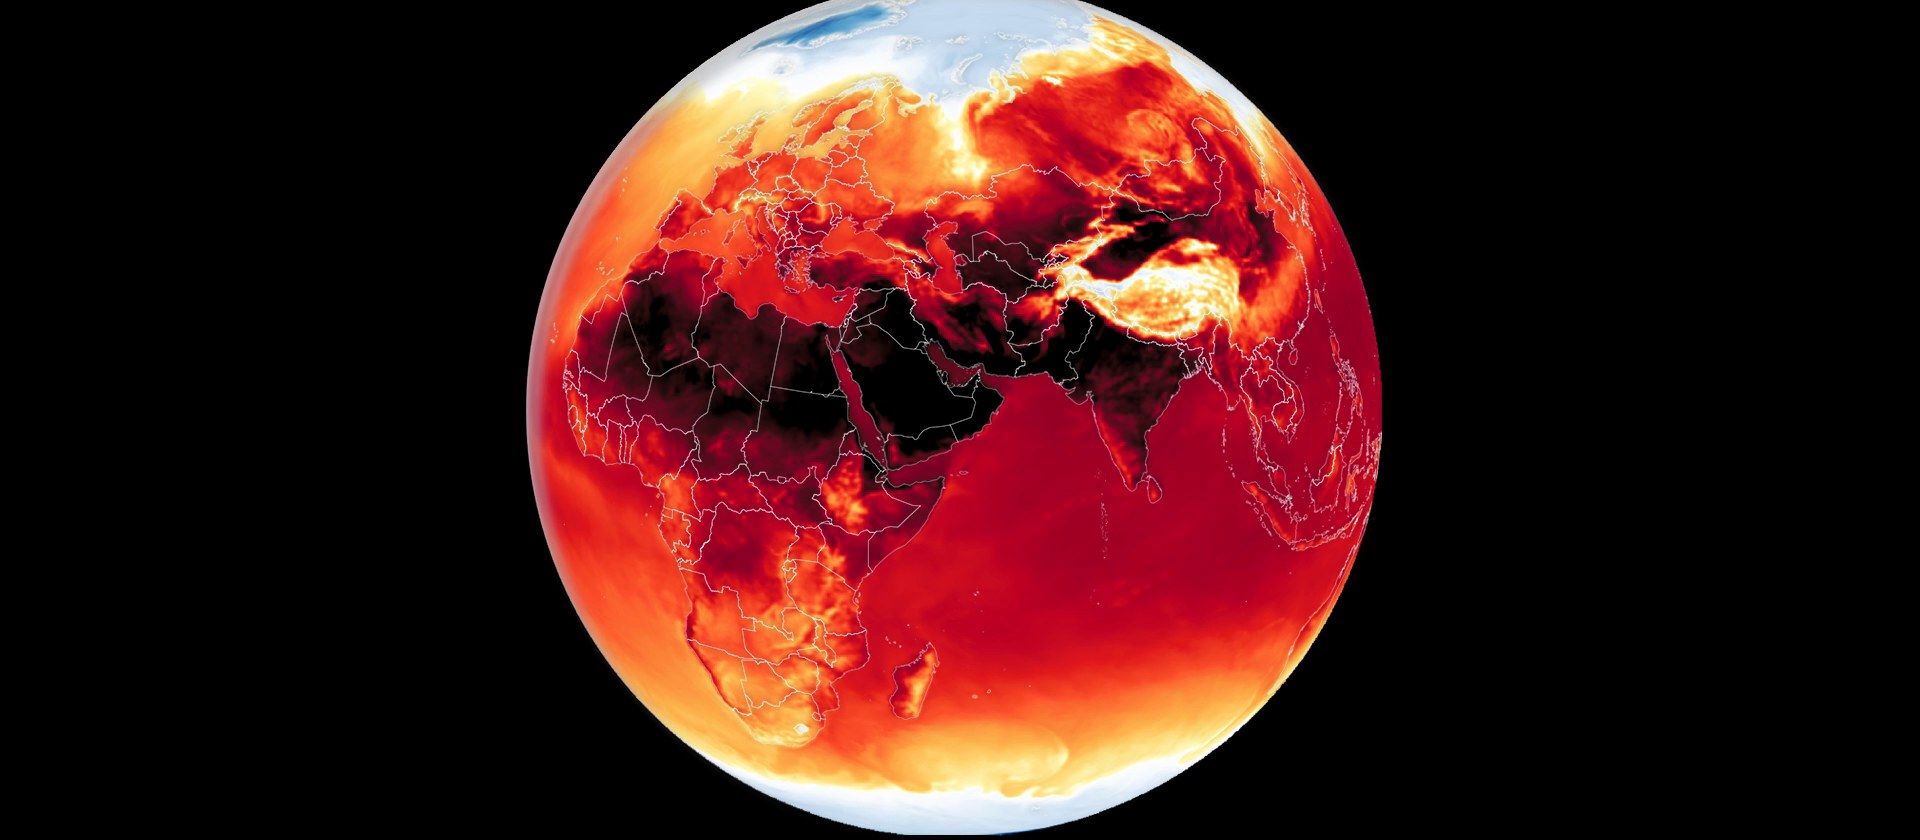
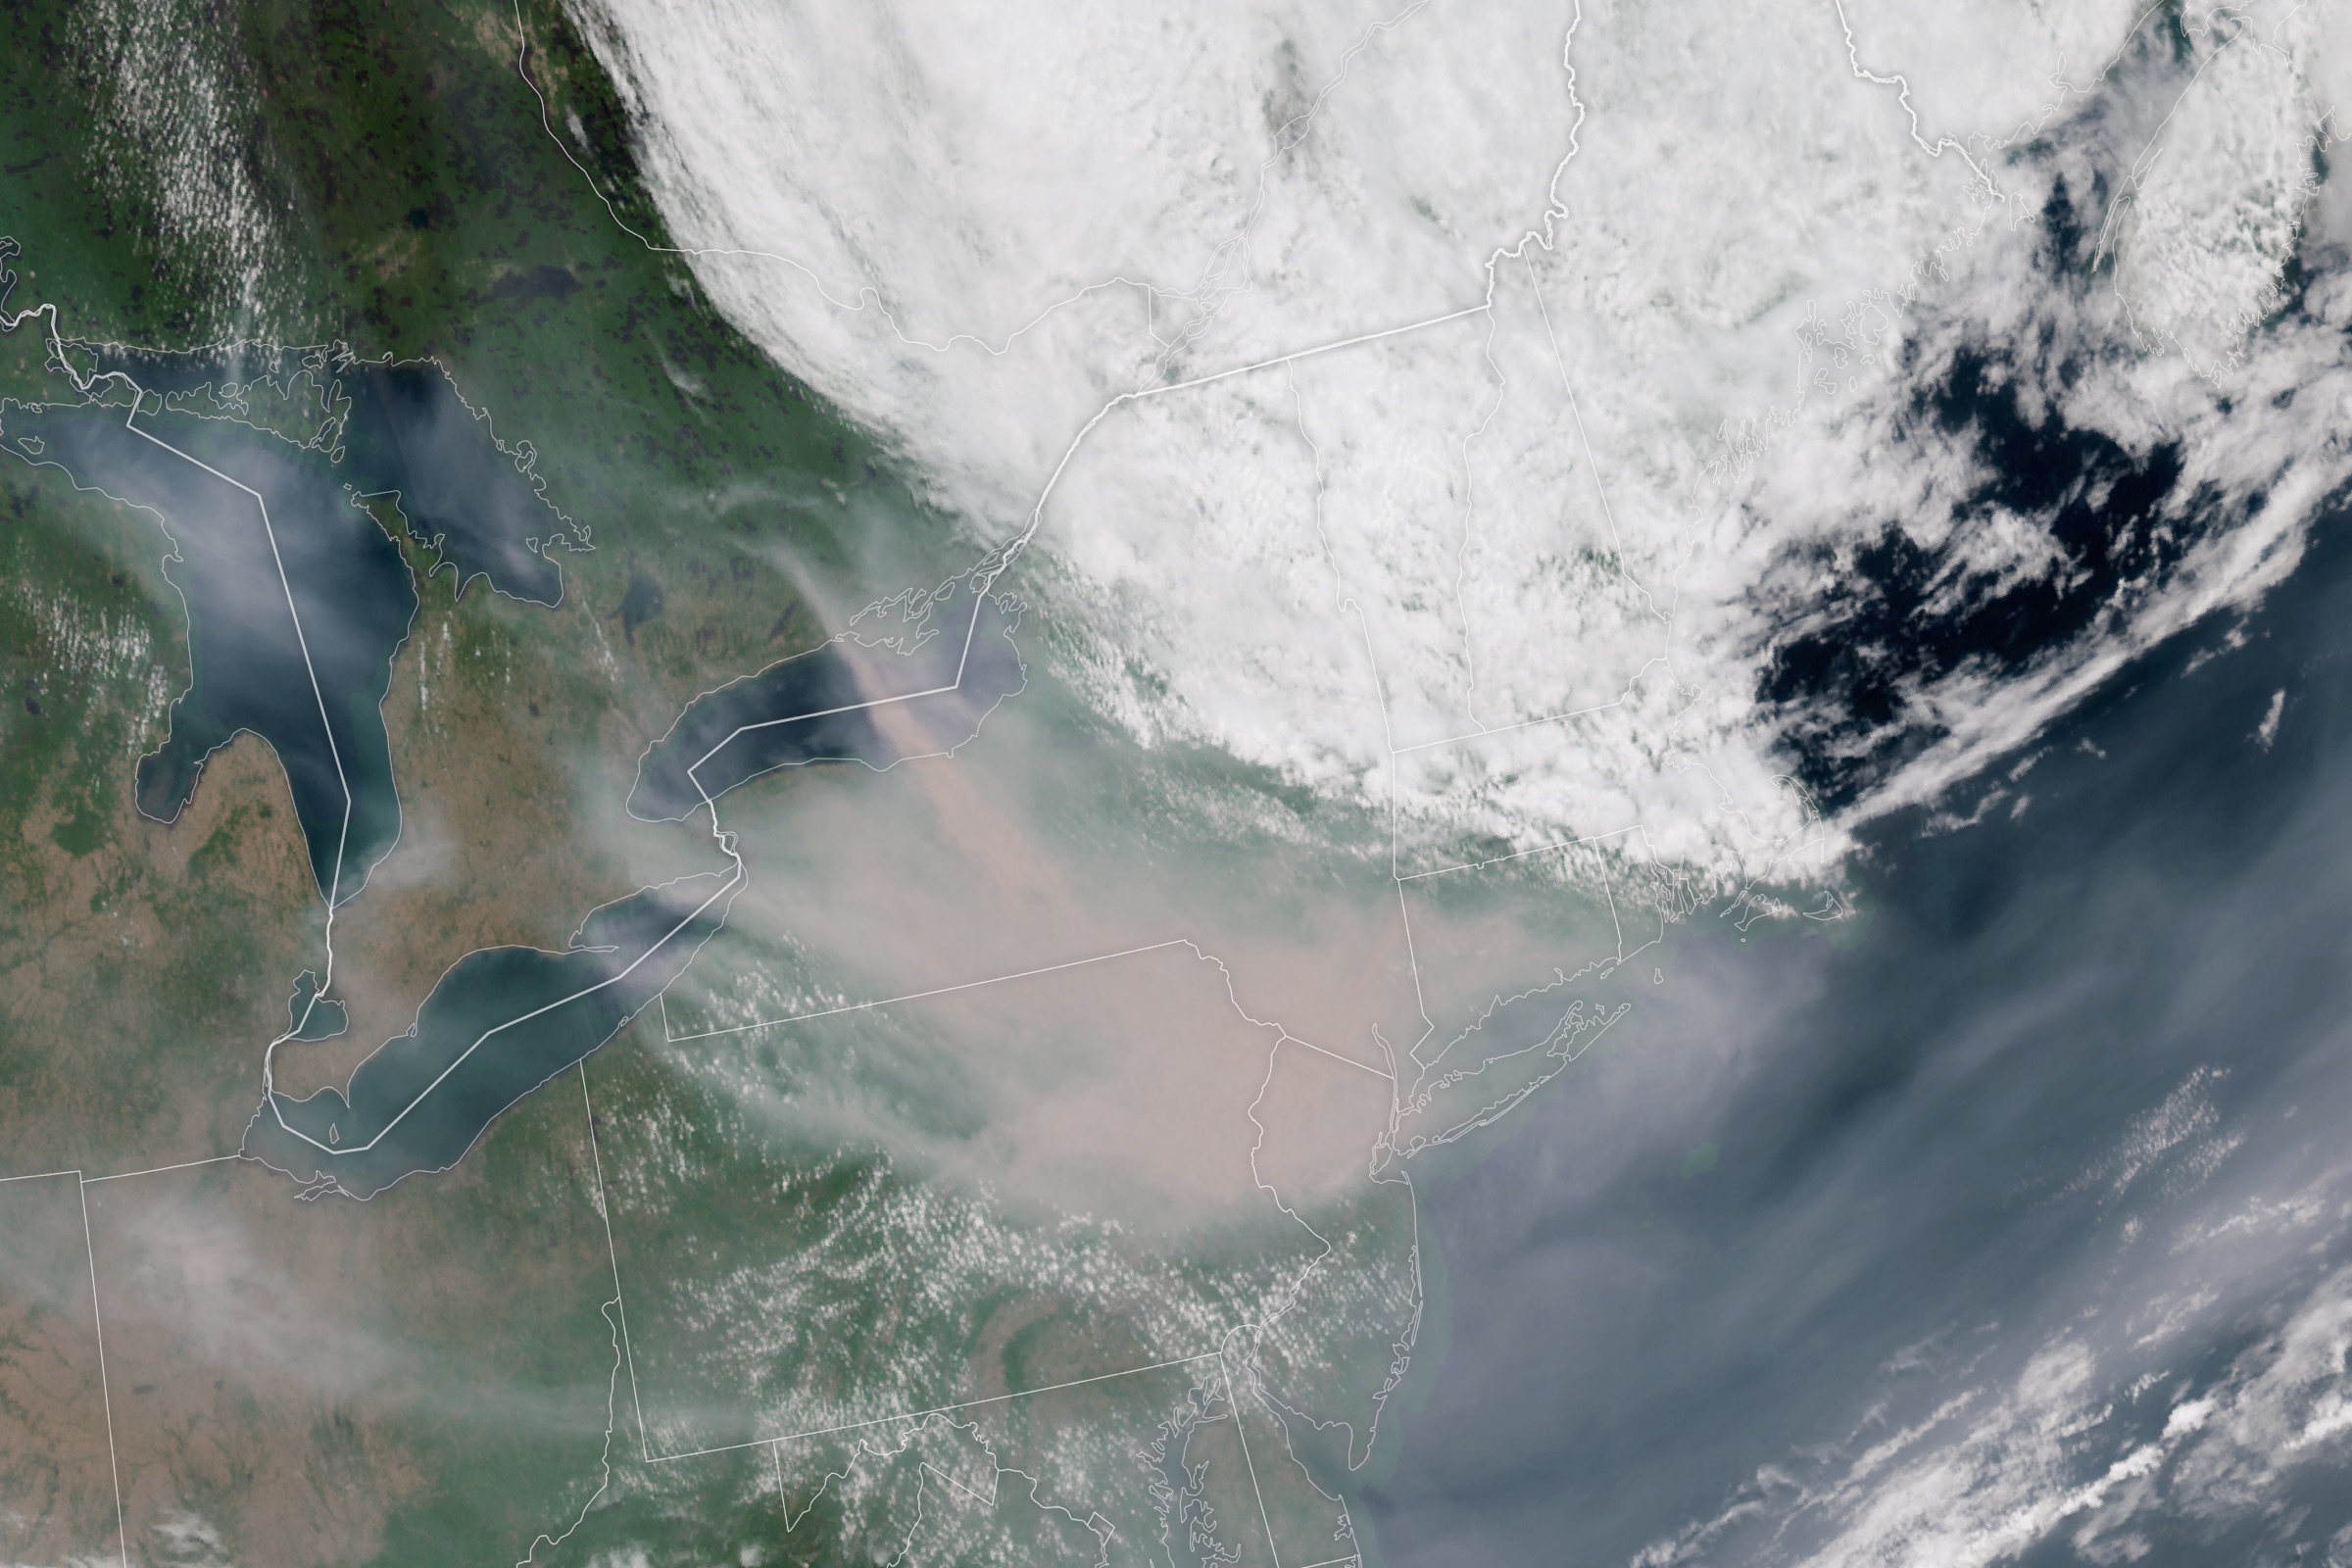
Data sources: National Weather Service damage assessment teams (TOP, EAX, FSD, MPX, ARX, MKX, STO, and 14 additional WFOs), Storm Prediction Center, NWS severe thunderstorm and tornado warnings, local storm reports. Map visualization and data integration by DisasterAWARE. Banner image: NASA Earth Observatory (public domain).


-min.png)


.png)


.png)


Decision-ready intelligence for understanding what's happening, what is impacted, and what to do next. Global hazard, severe weather, catastrophe, and physical risk intelligence trusted by governments, enterprises, insurers, humanitarian organizations, and technology platforms worldwide.
Request DemoContact Us