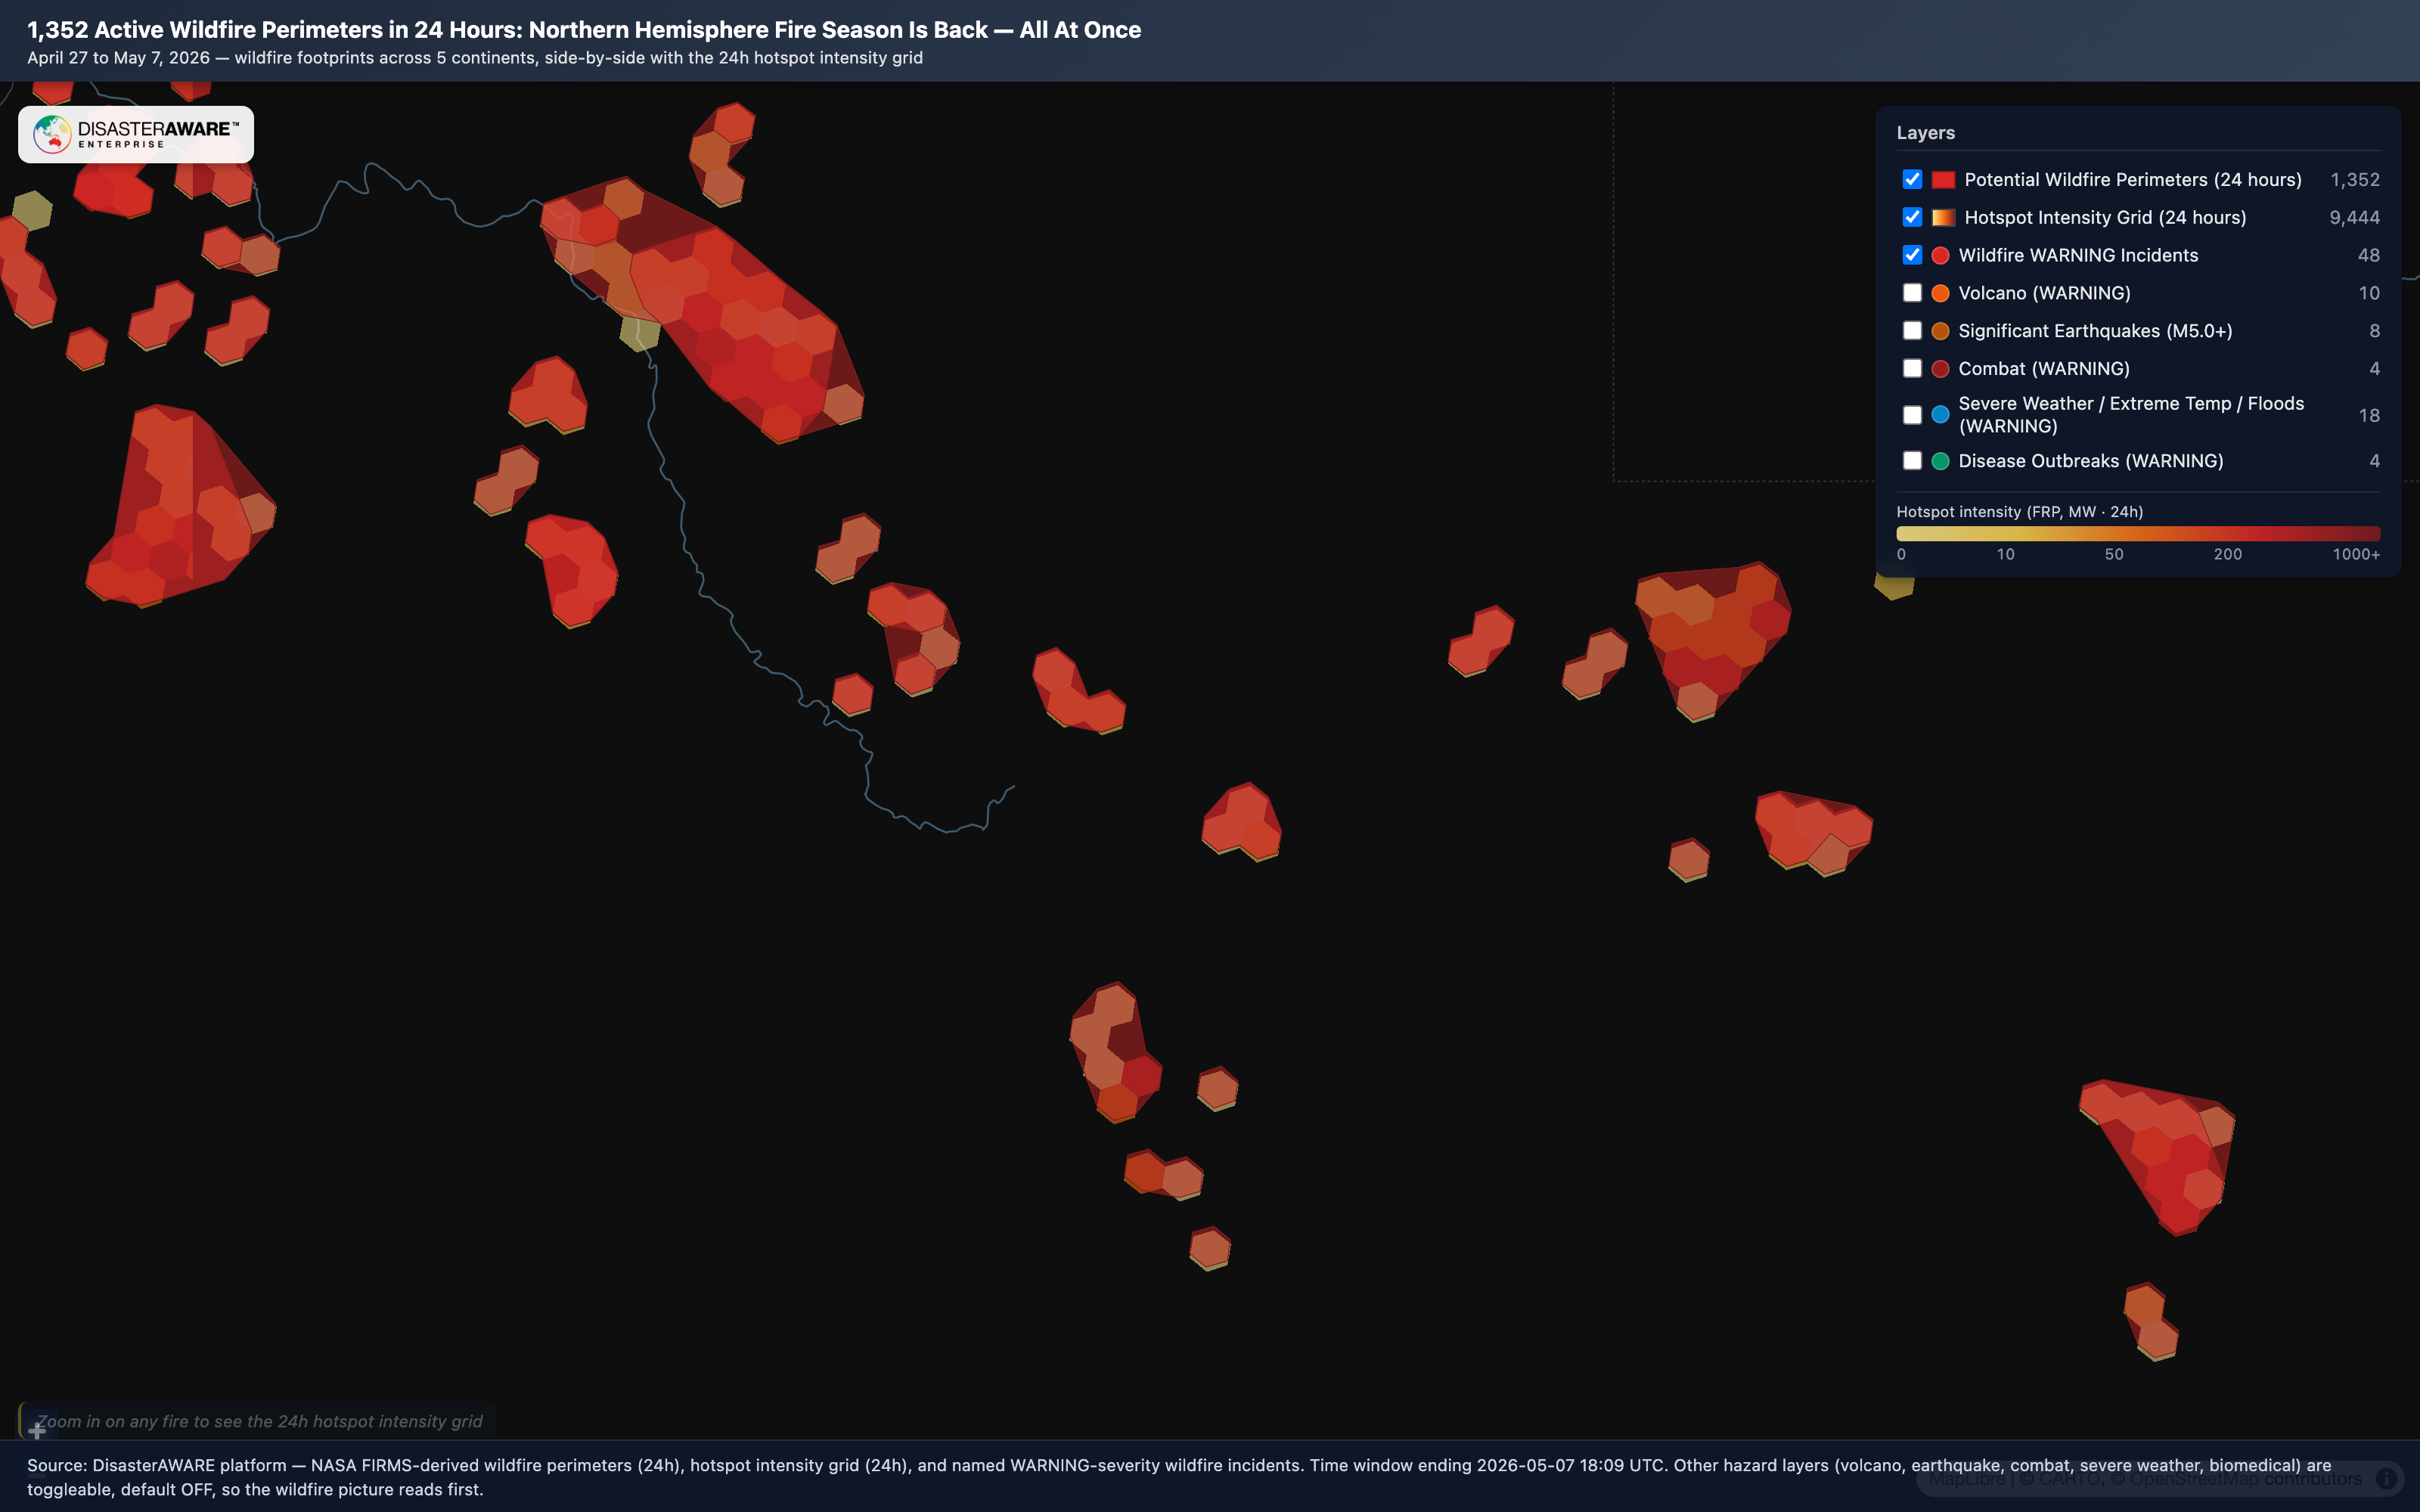
In the last 24 hours alone, DisasterAWARE detected 1,352 active wildfire perimeters and 9,444 thermal hotspot cells across five continents — a combined burning footprint of approximately 1.5 million acres. The Northern Hemisphere fire season has begun, and it has not started quietly. Russia and Ukraine's spring fire season is underway along the Bryansk–Chernihiv–Sumy–Kursk border. The US Southeast is in active wildfire warning across Georgia and Florida. Honduras, Nicaragua, Mexico, Sierra Leone, and Guinea are still in their late dry season. The Netherlands has a wildfire warning in densely populated Noord-Holland with $6.07 billion in capital exposure. And the Southern Hemisphere fire season has not finished — Australia's Northern Territory and Western Australia are still producing some of the largest active perimeters on the planet.
This brief leads with wildfire because that is the story of the week. But the bigger story is what is now visible in DisasterAWARE: every active fire on every continent, automatically assembled from raw NASA FIRMS thermal detections into coherent, exposure-quantified incidents — and now, side-by-side with two new platform layers that show the operational picture at the highest resolution we have ever published: the 24-hour potential wildfire perimeters and the 24-hour hotspot intensity grid.
For organizations that monitor wildfire risk, the underlying problem has never been a shortage of data. NASA's FIRMS system detects thousands of thermal anomalies globally every day. The problem is meaning. A satellite hotspot does not tell you whether a fire is growing or dying. It does not distinguish a wildfire threatening a community from an agricultural burn in a cleared field. And it does not, by itself, sit next to your facilities, your transmission corridors, or your insured exposure.
This is the core problem DisasterAWARE's wildfire intelligence is built to solve, and this week's data is a case study in why it matters.
In the last 24 hours, the platform processed FIRMS thermal detections — alongside complementary satellite sources — into 9,444 hotspot intensity cells (a hex-grid summary of where heat is being detected, weighted by FRP, or fire radiative power). Those cells were then aggregated into 1,352 potential wildfire perimeters, each with land-cover attribution (tree cover, grassland, cropland, wetland), an estimate of FRP delivered over 24 hours, and a flag indicating whether the perimeter intersects the wildland-urban interface. Of those 1,352 perimeters, 177 are flagged as WUI fires — the geometry where vegetation meets development, and where insurance loss tends to concentrate disproportionately.
Beyond the perimeter layer, the platform's incident intelligence layer assembles those raw detections into named, scored, lifecycle-tracked wildfire events with full population and capital exposure quantification — the same workflow described in our recent Wildfire Intelligence release. 44 of those incidents are at WARNING severity right now.
Here is what those 44 warnings tell us, region by region:
United States (8 active fires; 3 at WARNING). Georgia is in active wildfire warning across two multi-county fire complexes: Dougherty/Mitchell/Worth (220 people, $48.3M capital exposure) and Calhoun/Randolph/Terrell. Deschutes County, Oregon, is also at WARNING. Florida, Idaho, and Montana have active advisories. This is not the typical Western US fire season pattern — it is a Southeast-led, transcontinental early-May picture driven by drought conditions across the eastern two-thirds of the country.
Russia and Ukraine border (multiple WARNING fires). A coherent fire front is burning along the Bryansk-Chernihiv-Sumy-Kursk corridor, where the Russian-Ukrainian border crosses heavily forested terrain. At least eight named WARNING fires have been confirmed in this zone in the last week, including the Sumy/Kursk border fire (2,280 people, $43.1M capital), Bryansk regional fires, Klimovskiy rayon, Ivankivskyi, and multiple Chernihiv-area incidents. These fires are simultaneously burning in active conflict territory — DisasterAWARE customers see the wildfire layer and the combat layer in the same view, on the same exposure model.
Netherlands. A wildfire WARNING in the Beverwijk and Velsen municipalities of Noord-Holland is one of the more striking fires of the week. The affected area model encompasses 9,850 people, 4,660 households, and $6.07 billion in capital exposure — a reminder that European wildfire risk is no longer a Mediterranean phenomenon. The North Sea coastal dune ecosystem and adjacent built-up areas put significant infrastructure value at risk from a single fire.
Mexico (Chiapas, Campeche, Yucatán). At least seven WARNING-level fires across Chiapas (Tumbalá, Venustiano Carranza, Ocosingo, Altamirano, Las Margaritas) and Campeche (Carmen, Champotón). Combined, these fires put more than 14,000 people and over $200 million in capital exposure in their footprints. The Mexican late dry season is overlapping the Northern Hemisphere fire season ramp.
Honduras and Nicaragua. WARNING fires across Yoro, El Paraíso, Nueva Segovia, and Gracias a Dios.
West Africa (Guinea, Sierra Leone). Guinea has multiple active fires, including the Coyah fire (18,900 people, $20.4M capital) and the Sierra Leone–Guinea border fire near Kambia and Forécariah (19,600 people). West Africa's late dry season is producing wildfire activity in densely populated coastal districts.
Australia (Northern Territory and Western Australia). Despite the Southern Hemisphere fire season nominally winding down, Australia continues to host the single largest active perimeters in the platform — multiple Northern Territory perimeters in the 20,000–32,000 acre range, dominated by tree-cover and grassland fuels. Western Australia has WARNING fires at Brookton, Nannup, Augusta-Margaret River, Tiwi Islands, Chittering, Beverley, and Oberon. Australian fires this week make up the bulk of the >5,000-acre perimeters in the global dataset.
South America. Active fires in Venezuela (Carirubana — 10,300 people, $826M; Monagas — 19,800 people, $1.89B) and Brazil's Mato Grosso are continuing the Southern Hemisphere late-season pattern.
Every individual fire above is meaningful on its own. But the operational reality our customers experience is what happens when you can see all of them in one place — perimeter polygons, hotspot intensity, named incidents, and asset exposure together — without stitching feeds across four monitoring tools. A single insurance portfolio can have property exposure in Beverwijk, Brookton, and Brantley County simultaneously this week. The question for risk teams is not which of those fires is the biggest. It is which ones intersect the book.
The map above layers three streams of fire intelligence on top of the standard active-hazards view:
Other hazard categories (volcano, earthquake, severe weather, combat, biomedical, flood) are also available as toggleable layers but ship default-off in this brief — the goal is to let the wildfire picture speak first, then let the reader bring in correlating context (e.g., the Russia/Ukraine fires next to the combat layer).
At a world view, the map answers the question “where are fires burning right now?” — the answer is “everywhere.” The real value is at higher zoom. As you zoom in on any active fire, the 24-hour hotspot intensity grid resolves into individual H3 hex cells colored by Fire Radiative Power, showing exactly where the heat is concentrated inside the perimeter — and where it has spread in the last 24 hours. This is the resolution that turns a single red blob into a usable operational picture: you can see leading edges, you can see internal intensity gradients, and you can see whether a fire's energy is still concentrated or has begun to fragment.
As an example, here is the largest active perimeter on the platform this week — a ~32,000-acre tree-cover fire complex in Australia's Northern Territory — viewed at zoom level 11. The red polygons are the 24-hour potential wildfire perimeters; the smaller orange hexagons are the 24-hour hotspot intensity cells, each colored by FRP. Zoomed out, this is a single dot. Zoomed in, it is the structure of the fire itself.
For organizations whose assets sit anywhere on this map, the actionable workflow is the same: zoom into the fires that are near your operations, click any perimeter or hex cell to read the underlying detection data (acreage, dominant land cover, FRP, WUI flag, last-seen timestamp), and use that to drive evacuation, supply rerouting, asset protection, or pre-loss notification decisions. The platform does the same automatically against your defined asset model — alerting on intersection events without anyone needing to drive the map by hand.
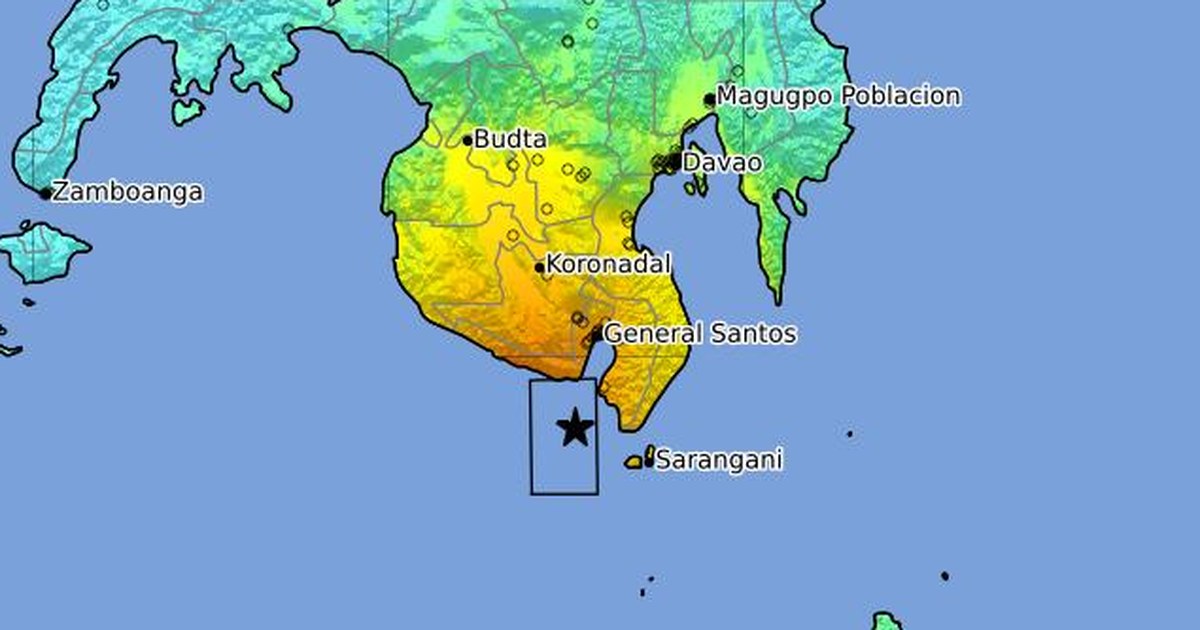
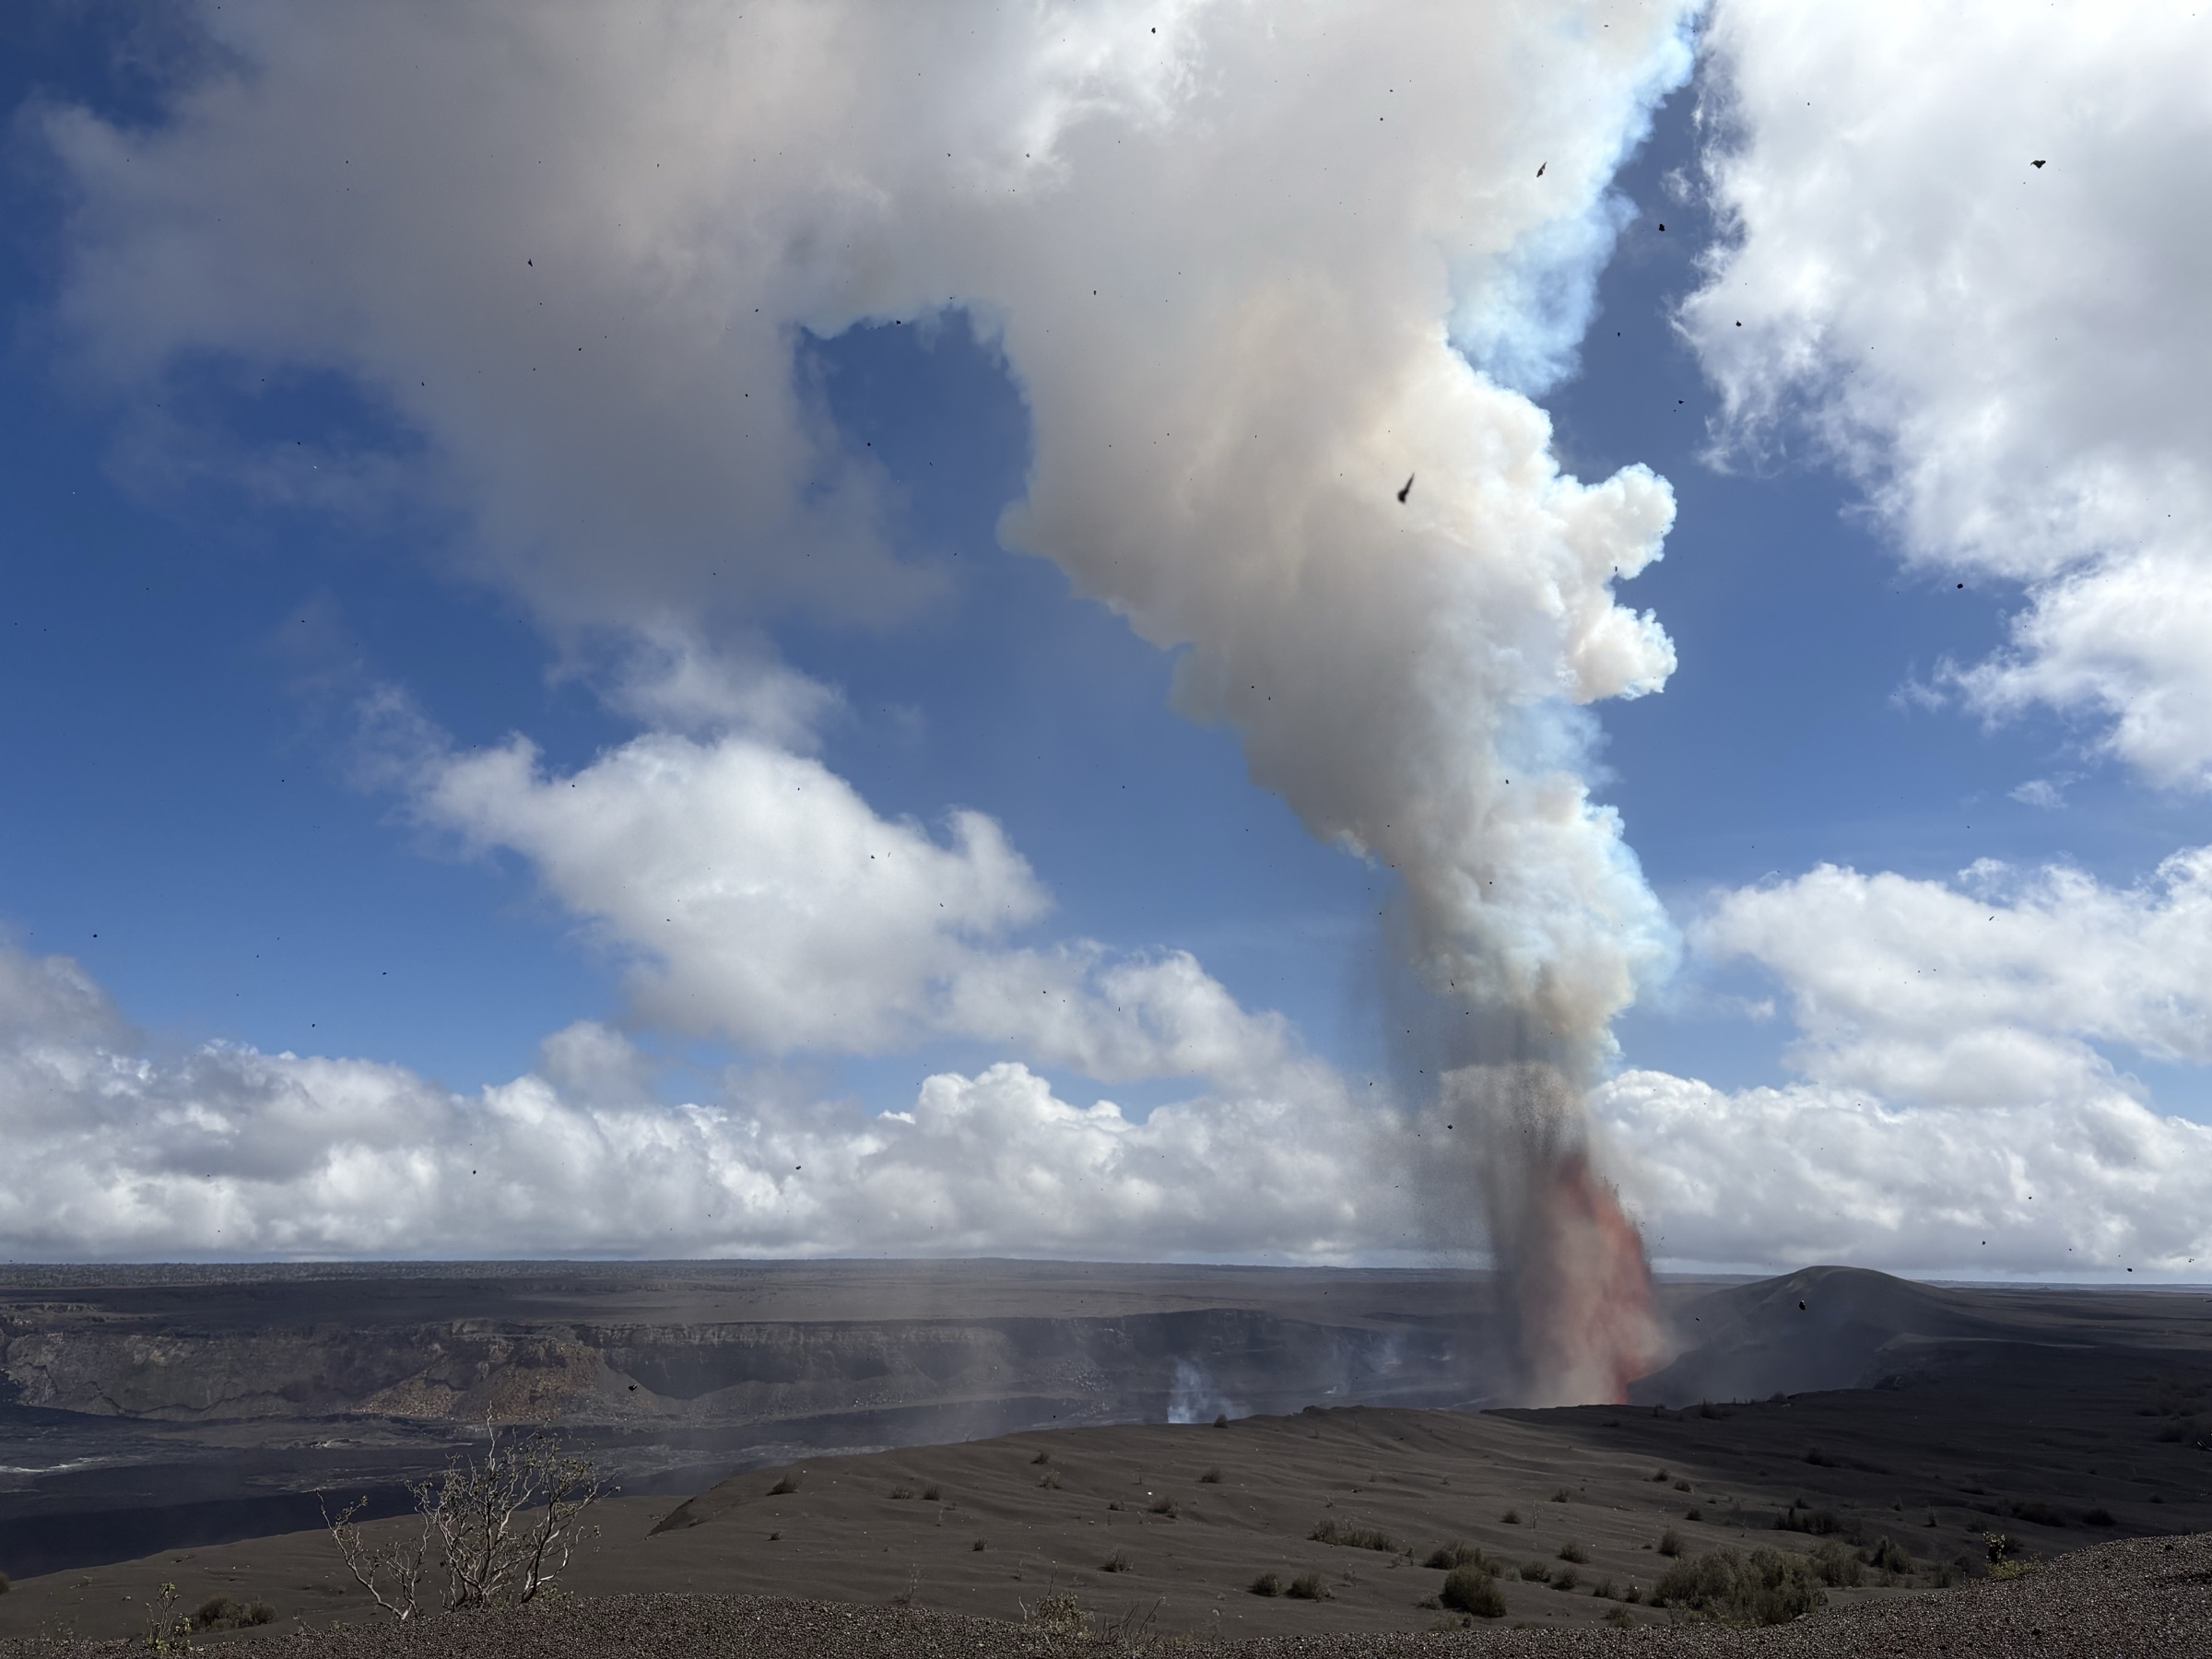
Indonesia (Ibu, Semeru, Dukono), the Philippines (Mayon), Guatemala (Fuego, Santa Maria), Ecuador (Reventador), Japan (Aira), Vanuatu (Aoba), Peru (Sabancaya), and Hawaii (Kilauea) are all producing active eruption alerts or VAAC ash advisories. For aviation operators in the Asia-Pacific, ash advisories are not a side concern — Mayon, Semeru, and Aira are within or adjacent to some of the busiest air corridors in the world.
Two earthquakes — M5.8 and M5.6 — both 235 km ESE of Attu Station, Alaska, both at 10 km depth, both at WATCH severity. Additional M5+ events in the Kermadec Islands (M5.6, M5.3), Mindanao (M5.5), Fiji region, Papua New Guinea, and the South Sandwich Islands. None individually consequential, but the Aleutians clustering is worth tracking.
This week saw 15 combat events including a Beirut airstrike (13 fatalities), Zaporizhia airstrikes (55 total casualties), Lake Chad attacks, a Mali terrorism incident in Mopti Cercle (50 fatalities), and ongoing Iran/Lebanon response support operations. Separately, news streams flagged Strait of Hormuz vessel fires and a UAE Fujairah petroleum complex strike — supply-chain and maritime exposure that increasingly intersects with conflict event tracking.
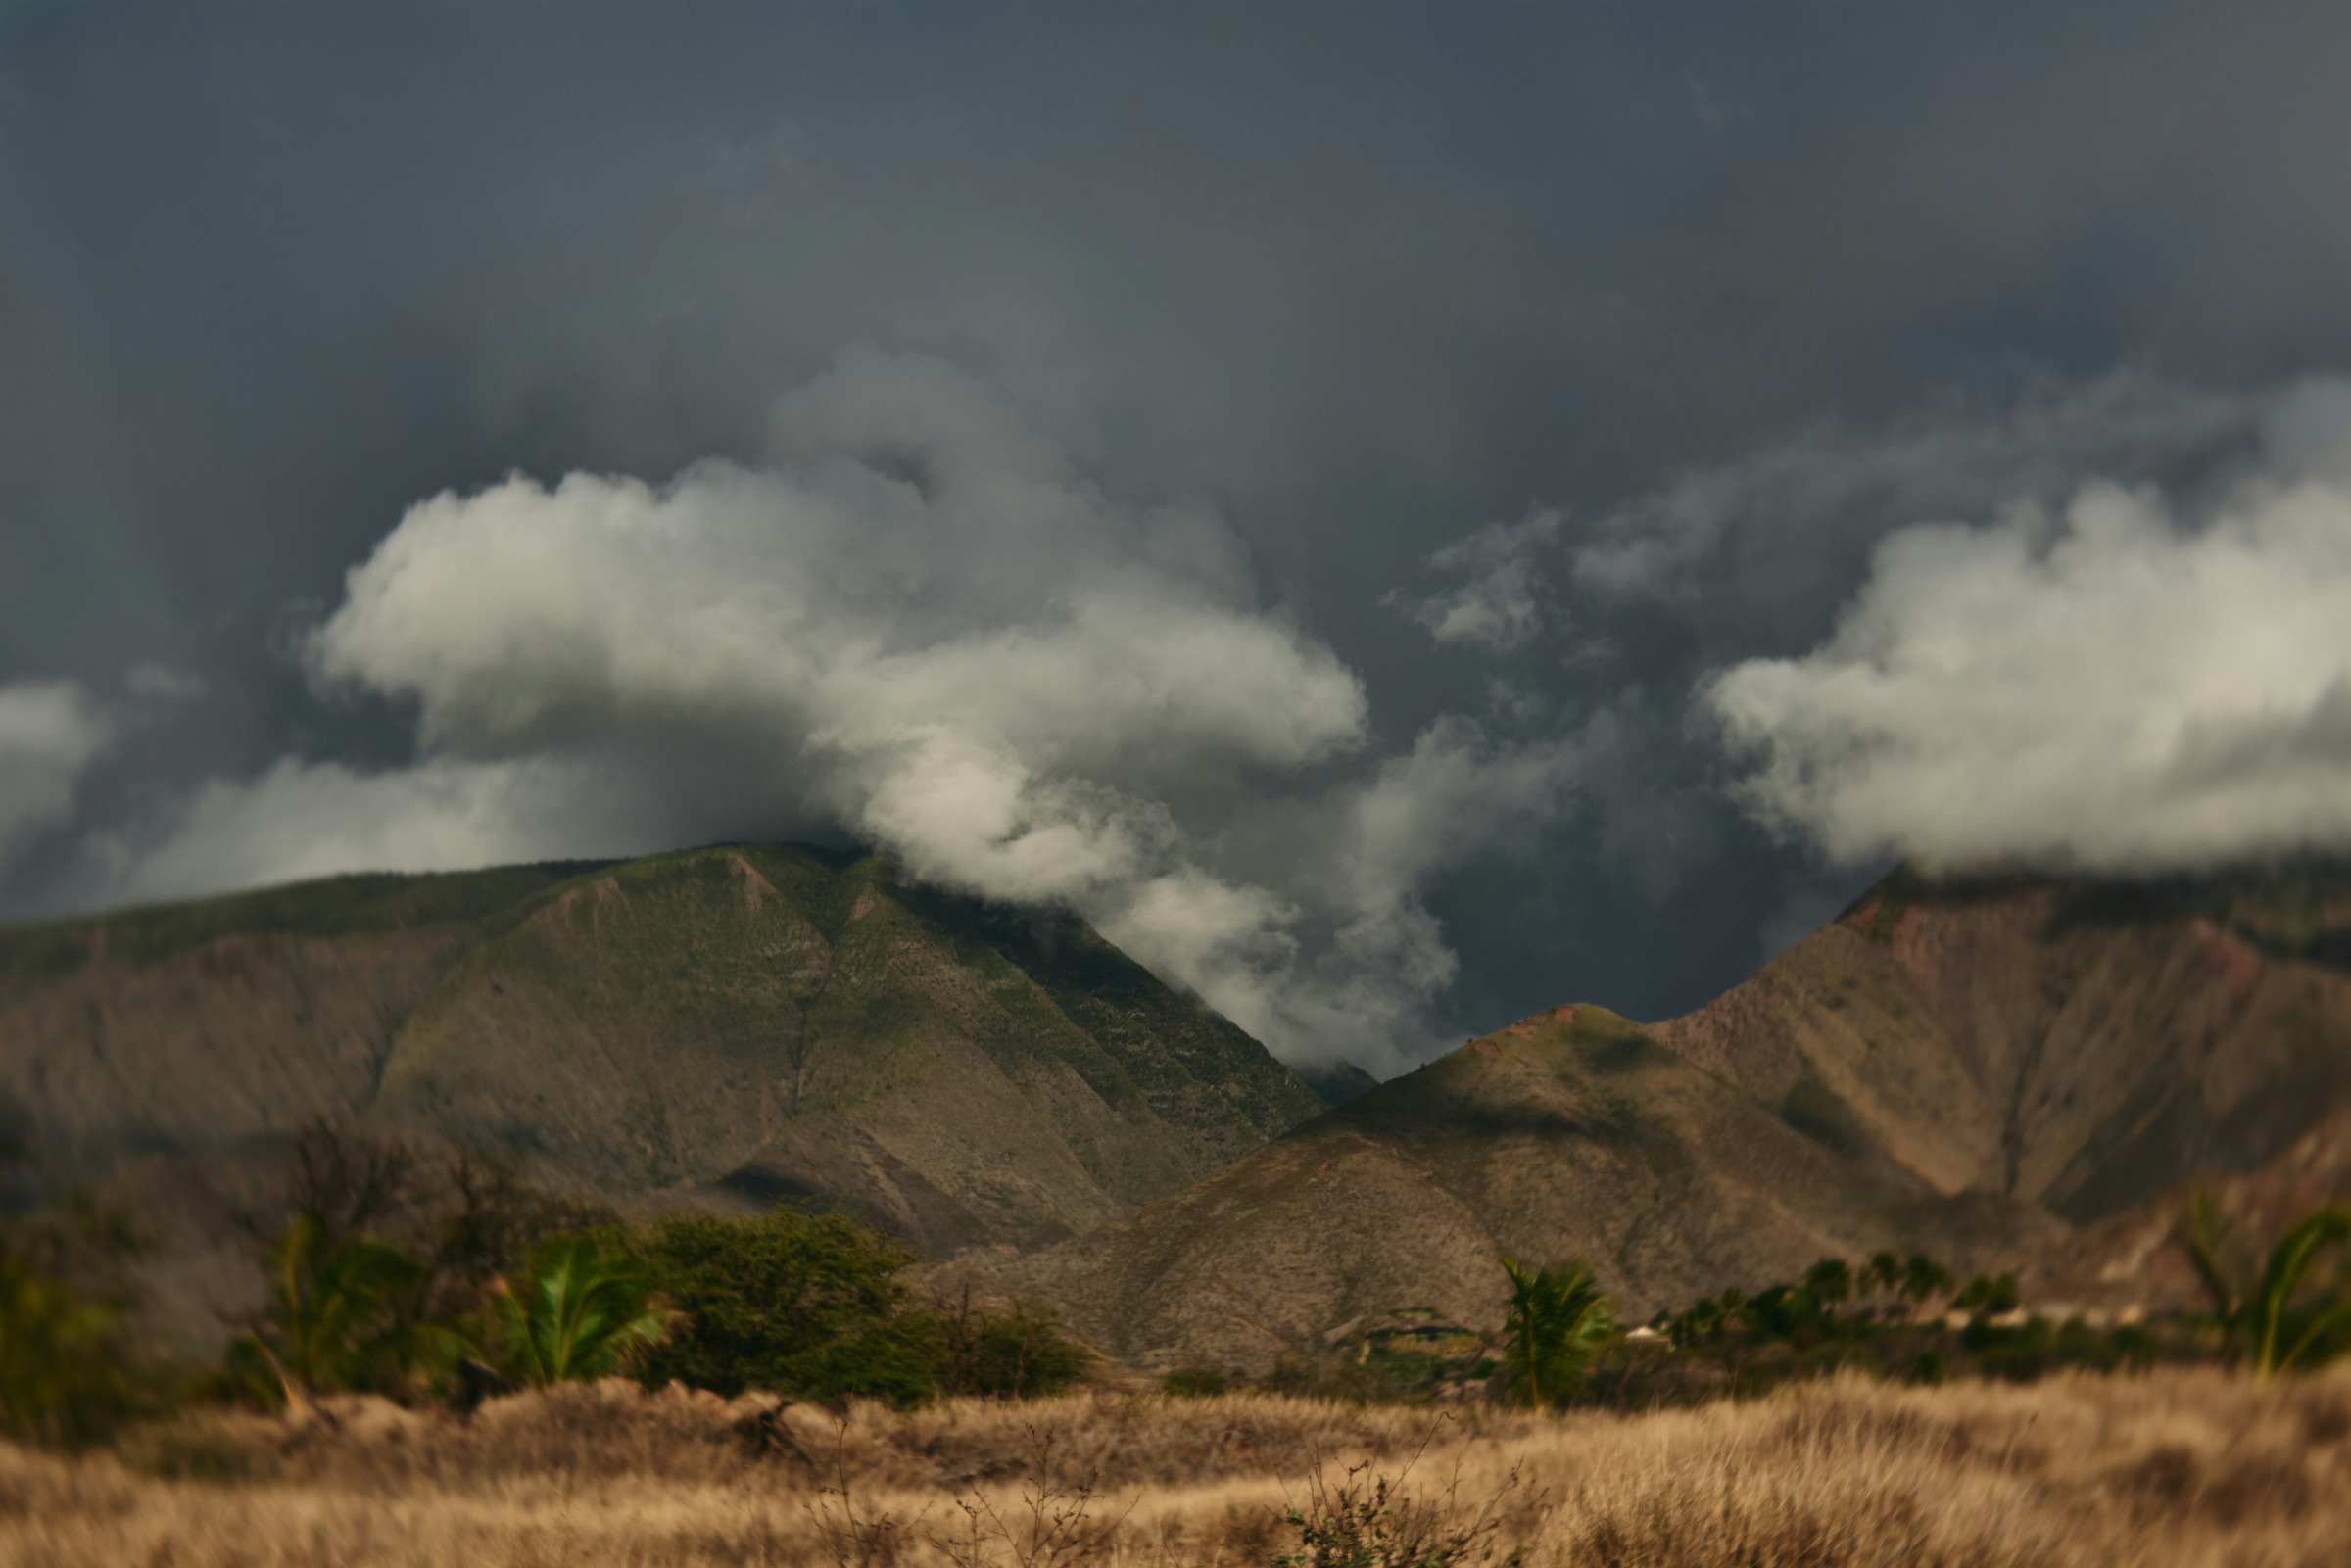
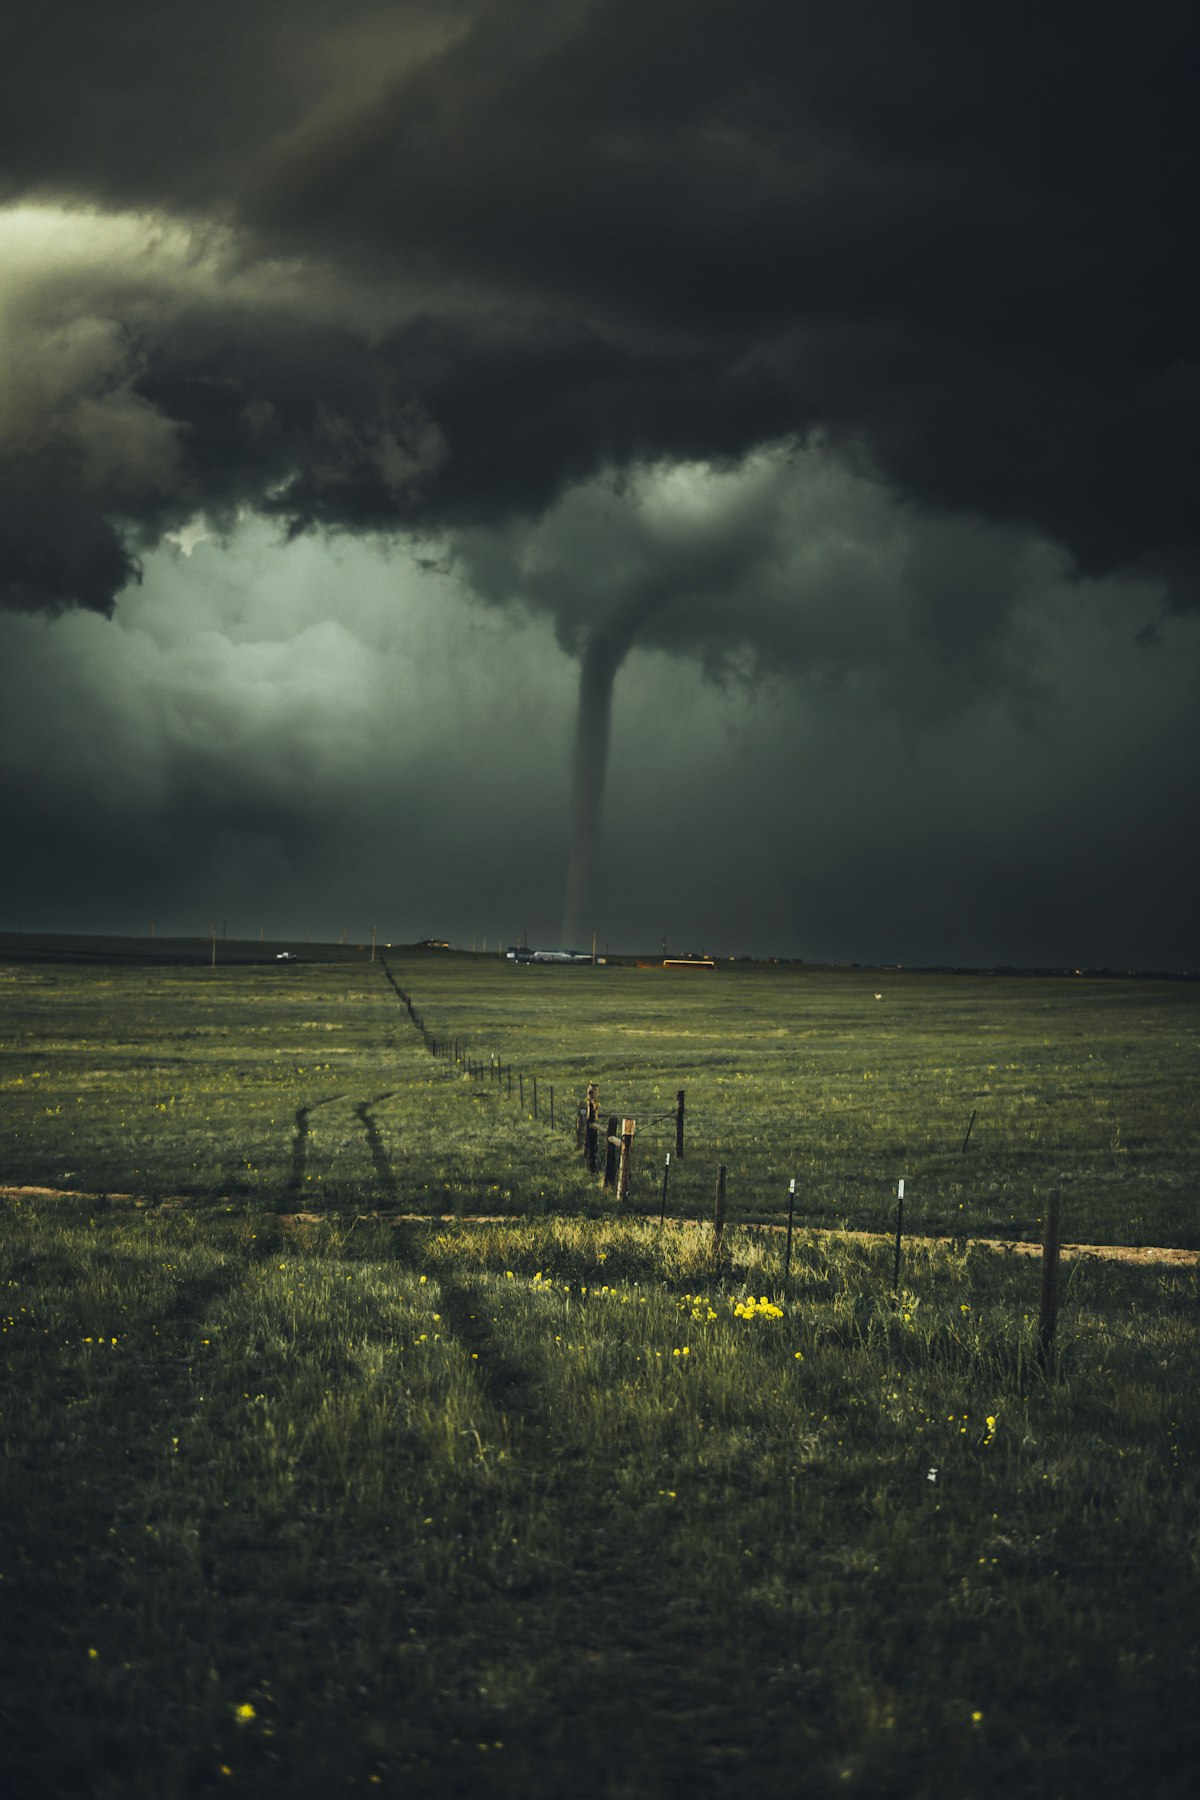
Severe thunderstorm warnings across Southern South Africa, Northern Italy, Vietnam, Peninsular and Eastern Malaysia, Sri Lanka, New Zealand's South Island, and an avalanche WARNING in Colorado. Storm warnings active in Argentina, Brazil, Suriname, and Costa Rica. Floods in Northwest Colombia.
Ten countries continue at famine-level food insecurity: Afghanistan, Haiti, Sudan, South Sudan, Somalia, Ethiopia, Yemen, DRC, Madagascar, Northern Nigeria.
This brief was produced from a single platform that fuses:
For organizations whose risk does not respect a single peril or a single hemisphere, this is the difference between watching the fire and seeing the operating picture.
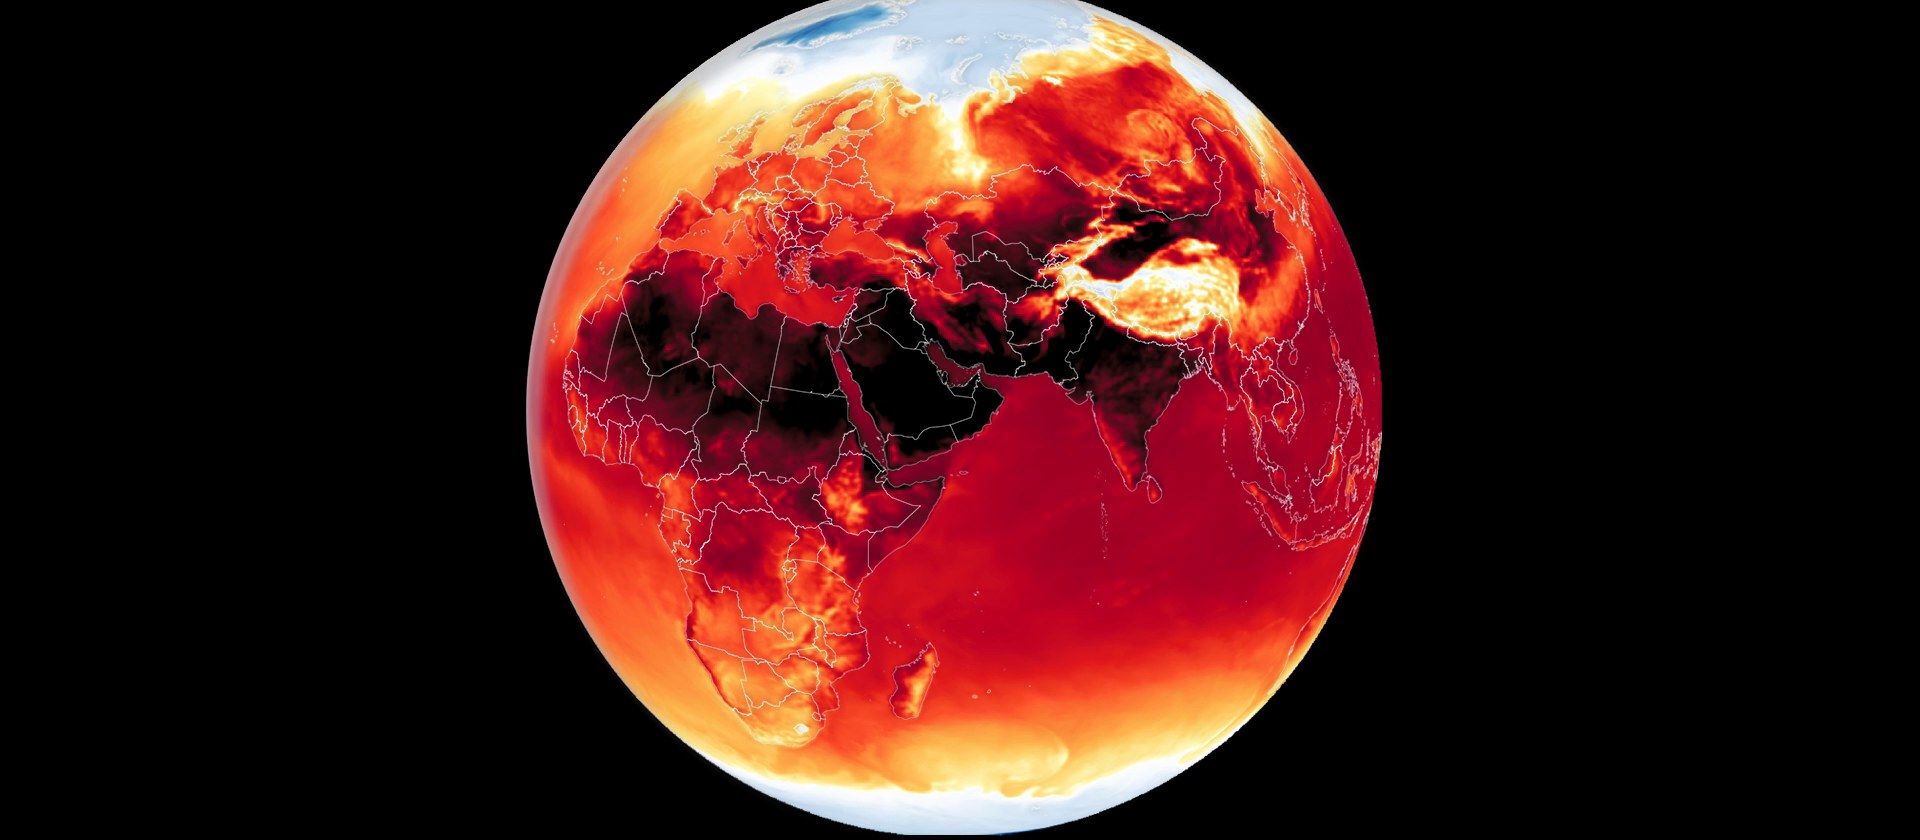
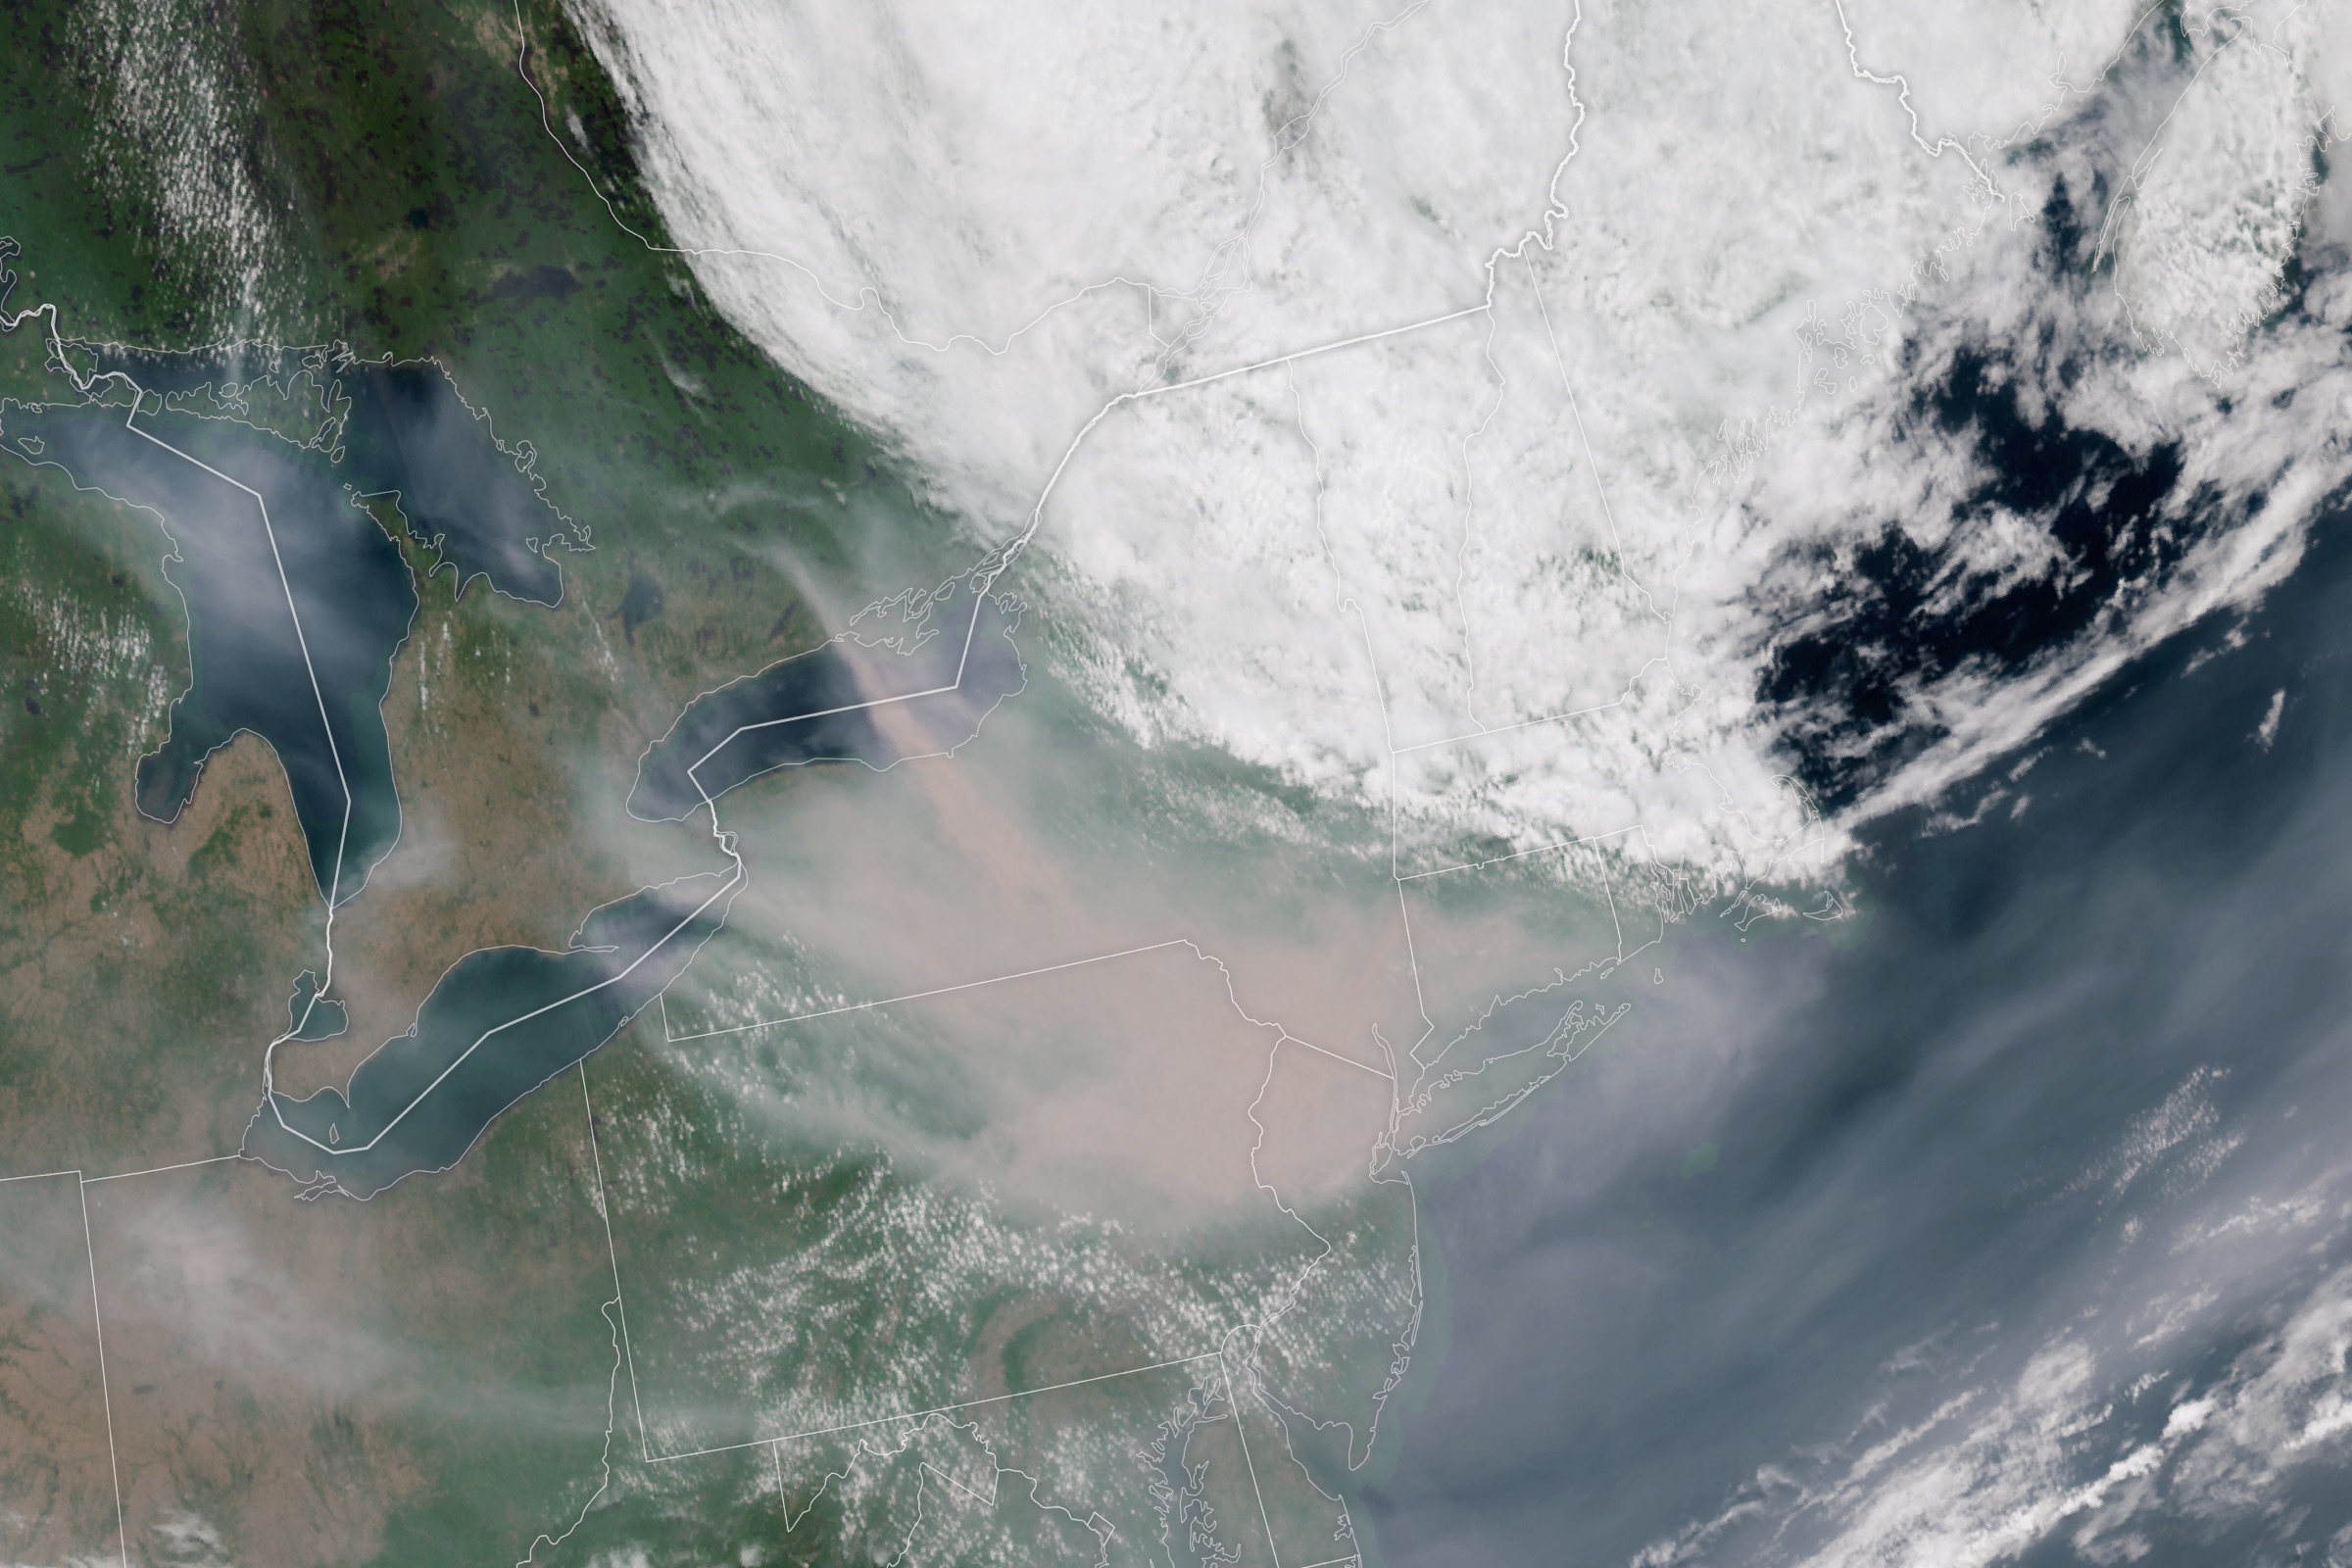
This brief covers verified hazard activity from April 27 to May 7, 2026. Wildfire perimeter and hotspot statistics reflect the 24-hour window ending 2026-05-07 18:09 UTC. Data sources: DisasterAWARE platform (NASA FIRMS-derived wildfire incidents, perimeters, hotspot grid), USGS, JTWC, NWS, VAAC network, ASEAN ADINet, WHO, UNICEF, UN-WFP, FEWS NET, IPC. Banner imagery: NASA Earth Observatory (MODIS Terra). Analysis powered by DisasterAWARE.


-min.png)


.png)


.png)