Tropical Cyclone Narelle traversed nearly the entire width of Australia over 11 days in March 2026 — forming east of Papua New Guinea, making landfall in Queensland as a Category 4 cyclone, crossing the Gulf of Carpentaria and Northern Territory, then re-intensifying to Category 4 again off Western Australia's Pilbara coast. Along the way, it forced the shutdown of two of Australia's largest LNG export facilities, caused catastrophic damage to the remote town of Exmouth, triggered record flooding along the Daly River, and affected three states across more than 4,500 km of Australian territory. DisasterAWARE issued 179 intelligence products over the storm's lifecycle — an average of more than 16 per day.
The map below shows Narelle's complete track across Australia, color-coded by Saffir-Simpson category. Toggle 34-knot, 50-knot, and 64-knot wind radii to see the storm's reach at each advisory. Click any track point for full advisory details including wind speed, movement, and forecast data.
Track data: Joint Typhoon Warning Center (JTWC) advisories #1–41. Wind radii from official JTWC forecast products. Visualization powered by DisasterAWARE.
Tropical Cyclone 27P formed on March 17 in the Coral Sea east of Papua New Guinea, initially as a disorganized tropical disturbance near 12.3°S, 156.6°E. The system was unnamed at its first advisory, carrying only the designation "Twentyseven."
What happened next was extraordinary. Moving west-southwest through the warm waters of the Coral Sea, the storm underwent rapid intensification — strengthening from 40 knots (tropical storm) to 125 knots (Category 4) in just 42 hours. By Advisory #6 on March 19, Narelle had sustained winds of 125 knots (232 km/h) with gusts to 150 knots, making it one of the most rapidly intensifying cyclones in the South Pacific this season.
Hurricane-force winds (64+ knots) extended 30–35 nautical miles from the center in all quadrants, while tropical storm-force winds reached out 100 nautical miles — a compact but extremely dangerous core.
Narelle made landfall on the Far North Queensland coast near 13.8°S, 144.0°E on the evening of March 19, carrying sustained winds of 120 knots (222 km/h) — a strong Category 4 at landfall.
The remote Cape York Peninsula bore the brunt of the impact. While population density in the direct path was low, hurricane-force winds of 120+ knots lashed the coast and extended inland. The storm maintained Category 3 intensity (105 knots) even after crossing the coastline, dropping to Category 2 (85 knots) only after moving well inland.
Torrential rainfall accompanied the cyclone, with flooding reported across multiple river systems in Far North Queensland. Emergency services responded to multiple calls for assistance in remote Indigenous communities along the Cape York corridor.
After crossing the Queensland coast, Narelle tracked west across the Gulf of Carpentaria — one of Australia's warmest bodies of water. Despite having weakened to Category 1 (65 knots), the storm briefly re-intensified to 80 knots over the warm Gulf waters before weakening again as it approached the Northern Territory coast.
The storm's wind field expanded significantly during this phase. By Advisory #13, tropical storm-force winds (34 knots) extended 190 nautical miles to the southeast and 200 nautical miles to the east — meaning communities across a swath wider than 700 km were experiencing damaging winds, heavy rain, and storm surge threats.
The heavy rainfall from Narelle's passage drove the Daly River to record-breaking levels, exceeding the previous record of 16.25 meters set in 1998 at Nauiyu. The community of Nauiyu Nambiyu, home to approximately 400 people, was evacuated as floodwaters inundated the settlement. Katherine also experienced significant flooding, with the Katherine River reaching major flood levels.
Narelle weakened to tropical storm intensity (35–45 knots) as it crossed the vast interior of the Northern Territory and the Kimberley region of Western Australia. Despite the lower wind speeds, the storm maintained a massive rain footprint, dumping heavy rainfall across remote pastoral communities and flooding unsealed roads and airstrips.
The storm reached its minimum intensity of 35 knots (65 km/h) during Advisories #19–21 on March 22–23 — a full 90 knots weaker than its peak just days earlier. Many forecasters expected Narelle to dissipate entirely over the arid interior.
It didn't.
As Narelle emerged over the warm waters of the Indian Ocean west of the Kimberley, something remarkable happened: the storm began to re-intensify. What had been a 35-knot tropical depression rapidly rebuilt into a major cyclone.
In 48 hours, Narelle strengthened from 45 knots back to 115 knots — a second rapid intensification that brought the storm back to Category 4 strength. By Advisory #35 on March 26, Narelle was centered at 20.4°S, 114.6°E with sustained winds of 115 knots (213 km/h), gusts to 140 knots, and hurricane-force winds extending 50–70 nautical miles from the center.
This second peak was particularly dangerous because of its proximity to Western Australia's coastal infrastructure.
Narelle's track along the Pilbara and Gascoyne coasts threatened two of Australia's most critical energy export facilities:
Australia is one of the world's top three LNG exporters, and the Pilbara region is the heartland of that industry. The temporary shutdowns rippled through global LNG spot markets, with Asian buyers scrambling for alternative supply.
For supply chain and energy teams tracking Narelle through DisasterAWARE, the ability to overlay the storm's forecast track and wind radii against critical infrastructure locations provided hours of additional lead time for operational decisions.
The remote tourist town of Exmouth (population ~2,800), gateway to the Ningaloo Reef and a popular destination for whale shark diving, sustained catastrophic damage as Narelle passed offshore. Reports described the town's airport as "obliterated," with significant damage to hangars, terminal buildings, and the runway.
With the airport destroyed and roads blocked by debris and flooding, Exmouth was effectively cut off — inaccessible by either air or land for a period after the storm's passage. Emergency supplies had to be staged and delivered as access routes were cleared.
The Gascoyne and Mid-West regions — already Australia's most important horticultural zones outside the southeast — were severely impacted:
Narelle weakened rapidly as it tracked south past the latitude of Perth, dropping from 100 knots to 35 knots in just 24 hours. By the final advisory (#41) on March 28, the storm was centered at 30.0°S, 117.2°E — well inland south of Perth — and had been reclassified as subtropical.
The storm's final movement was remarkably fast: 33 knots (61 km/h), more than twice its average speed during the earlier phases. This rapid forward motion carried residual rainfall bands across the wheat belt and southern Western Australia.
DisasterAWARE tracked Tropical Cyclone Narelle from genesis to dissipation, issuing 179 intelligence products across the storm's 11-day lifecycle — an average of more than 16 products per day. This continuous situational awareness stream included:
Each exposure report analyzed population, critical infrastructure, and economic assets within the storm's projected wind radii — giving insurance companies, supply chain operators, and emergency managers actionable intelligence as the threat evolved hour by hour.
The 41 JTWC advisories were augmented by DisasterAWARE's automated processing pipeline, which extracted wind radii, track forecasts, and intensity projections and overlaid them against asset databases within minutes of each advisory's release.
Narelle's 11-day track across three Australian states illustrates the challenge of monitoring a long-lived, continent-crossing cyclone. The storm required continuous attention across multiple time zones, shifting threat areas, and evolving impact scenarios — from coastal wind damage in Queensland, to river flooding in the Northern Territory, to energy infrastructure threats in Western Australia, to agricultural devastation in the Gascoyne.
Organizations relying on periodic manual monitoring would have struggled to maintain situational awareness across this scope. DisasterAWARE's automated intelligence pipeline delivered consistent, structured updates throughout — whether the storm was a Category 4 monster or a 35-knot tropical depression crossing the outback.
Dual rapid intensification. The storm reached Category 4 intensity twice — once in the Coral Sea (125 knots on March 19) and again in the Indian Ocean (115 knots on March 26) — separated by a period of overland weakening to just 35 knots. This "phoenix" behavior, where a cyclone weakens almost to nothing over land and then rebuilds to major cyclone strength, is rare and made Narelle particularly difficult to forecast during its middle phases.
Cross-basin track. Narelle crossed from the South Pacific basin into the South Indian Ocean basin — a relatively unusual trajectory that required coordination between multiple meteorological agencies (Australian Bureau of Meteorology, JTWC) and complicated official naming and tracking conventions.
4,500 km track length. The storm's total track from the Coral Sea to south of Perth — roughly the distance from New York to Los Angeles — made it one of the longest-tracked tropical cyclones in Australian history.
Three-state impact. It is exceedingly rare for a single cyclone to produce significant impacts in Queensland, the Northern Territory, and Western Australia during the same lifecycle. The logistical challenge of coordinating emergency response across these vast, sparsely populated territories — spanning four time zones — is immense.
Narelle is a case study in cascading risk. What began as a tropical cyclone threat to remote Queensland communities evolved over 11 days into a global energy supply disruption affecting LNG markets thousands of kilometers away.
For supply chain and risk teams, the key takeaways are:
DisasterAWARE monitors tropical cyclone activity across all ocean basins in real time, layering storm track forecasts against your organization's asset locations, supply chain nodes, and employee populations.
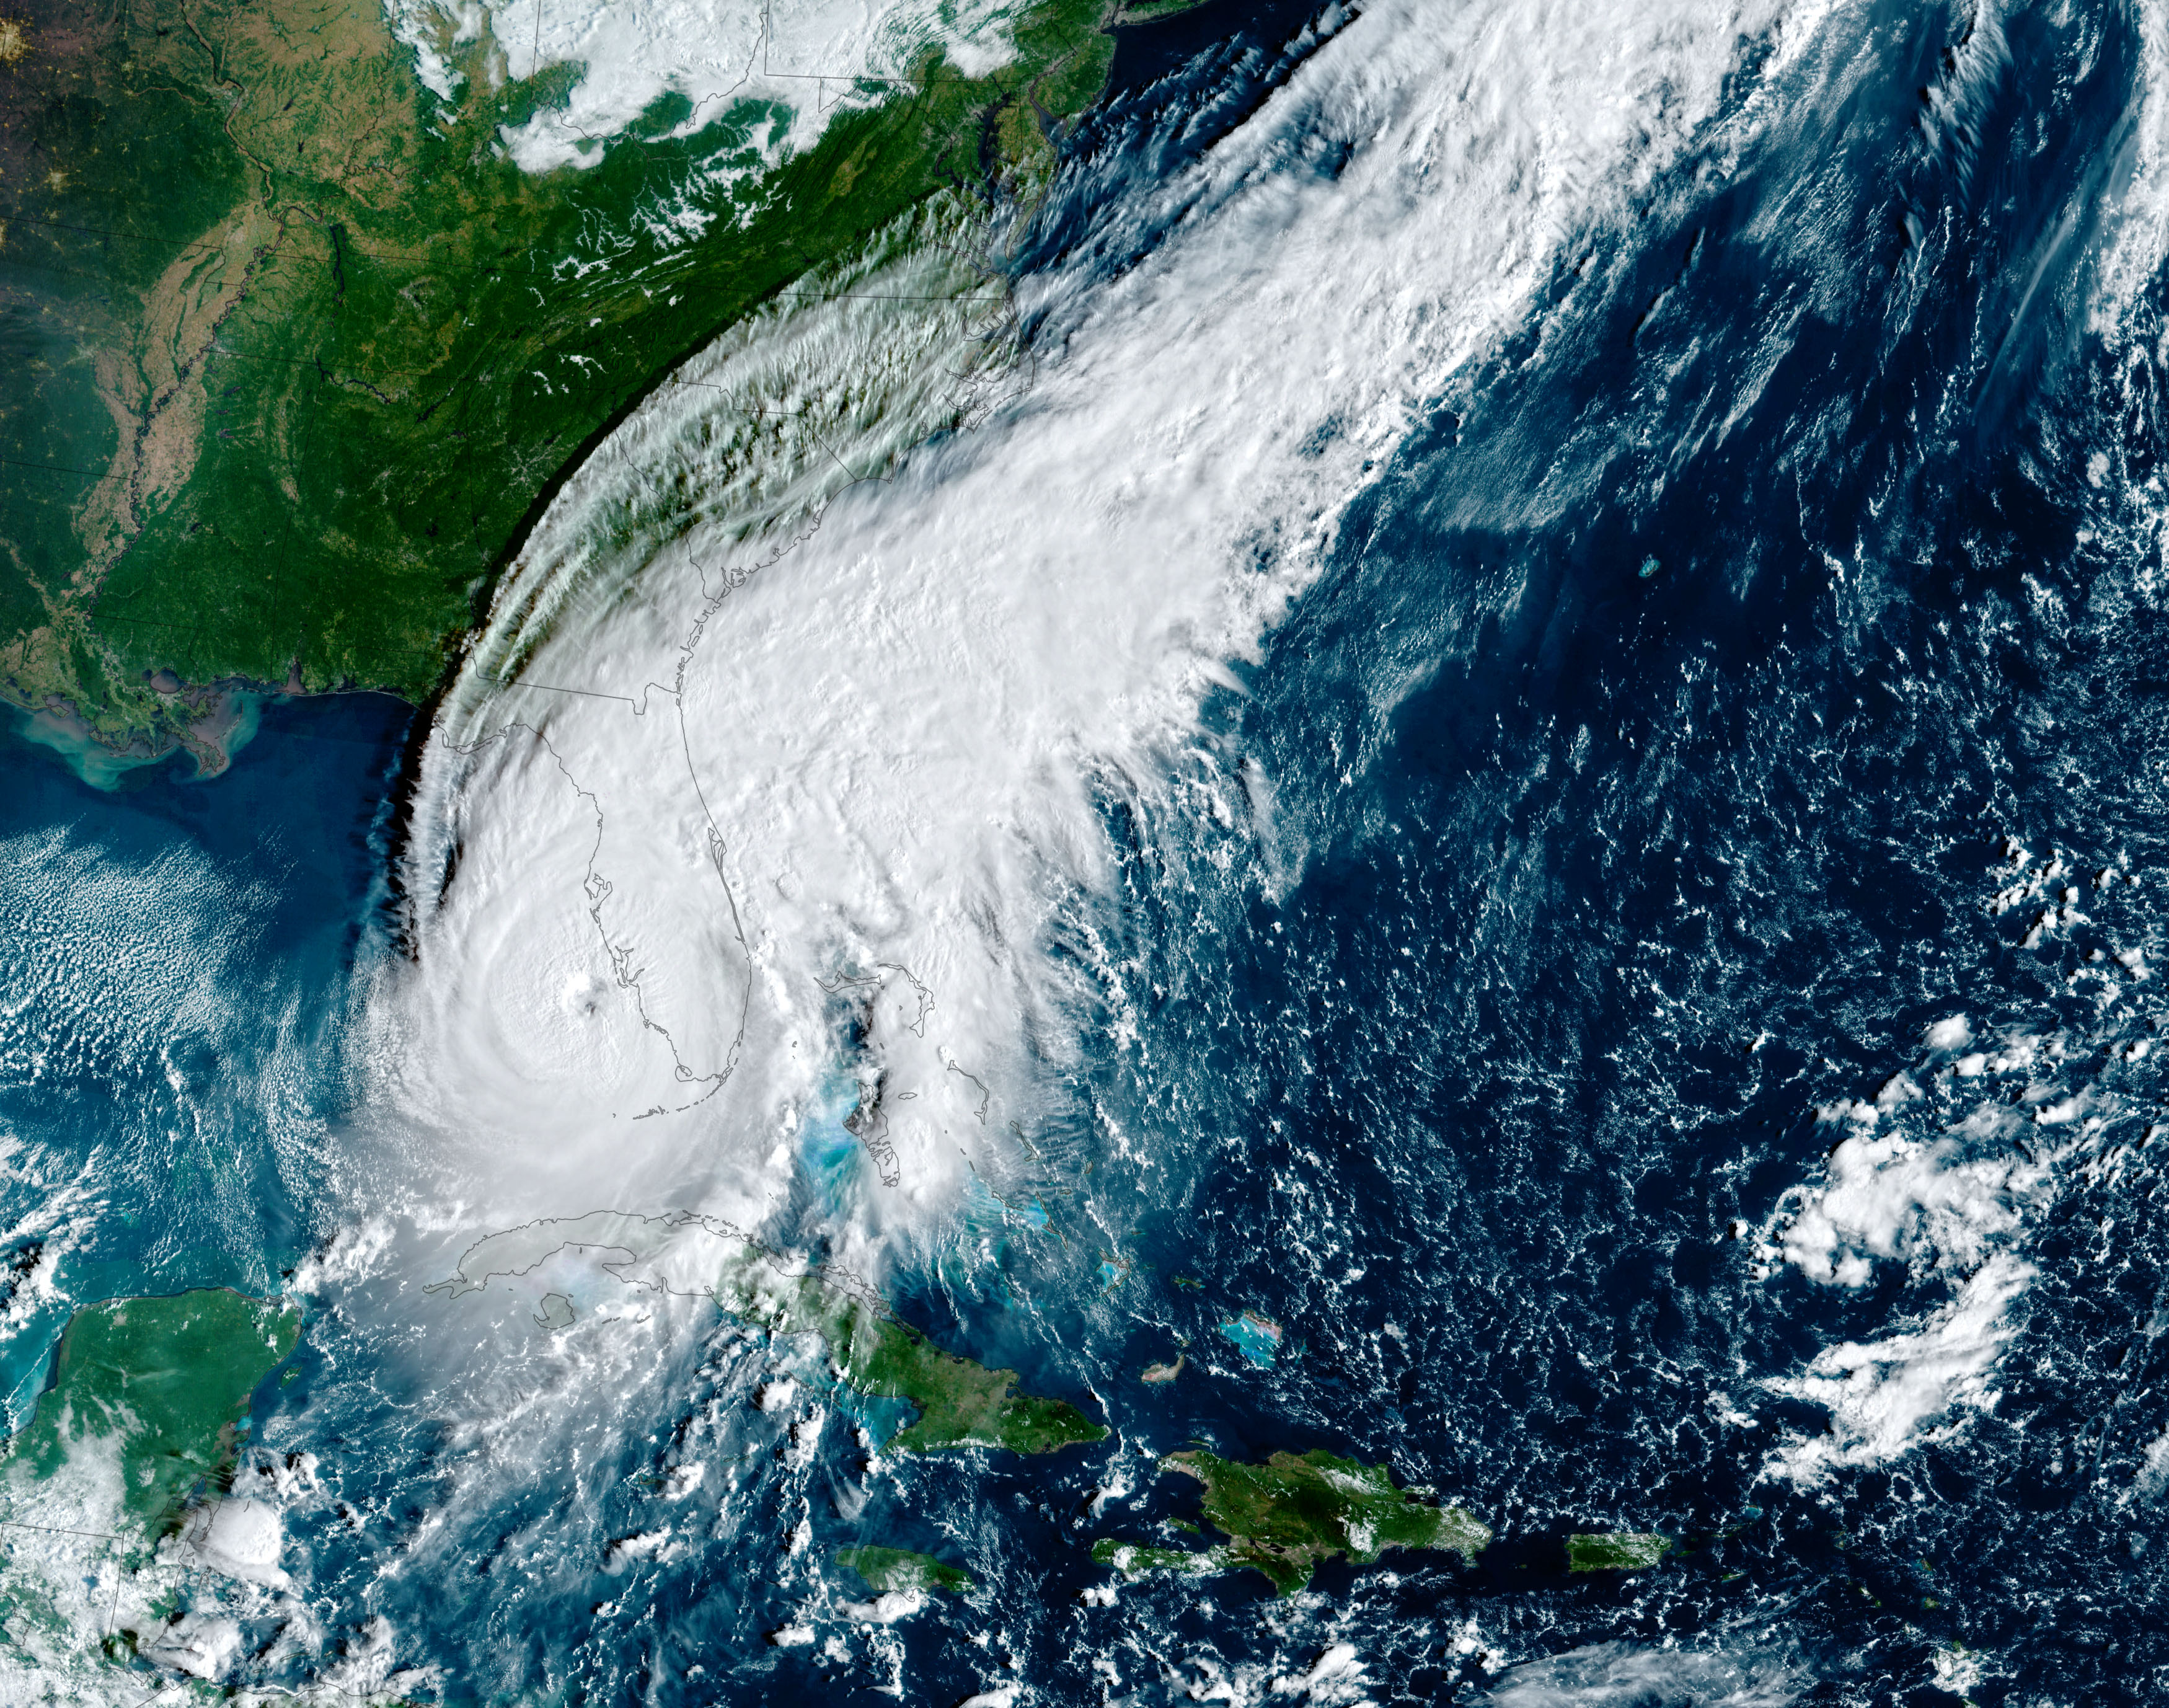
Data sources: Joint Typhoon Warning Center (JTWC) advisories #1–41, DisasterAWARE automated intelligence products, Australian Bureau of Meteorology. Track and wind radii data from official JTWC forecast products. Map visualization generated by DisasterAWARE. Banner image: NASA Earth Observatory / VIIRS on NOAA-21 satellite, March 19, 2026 (public domain).


-min.png)


.png)


.png)