


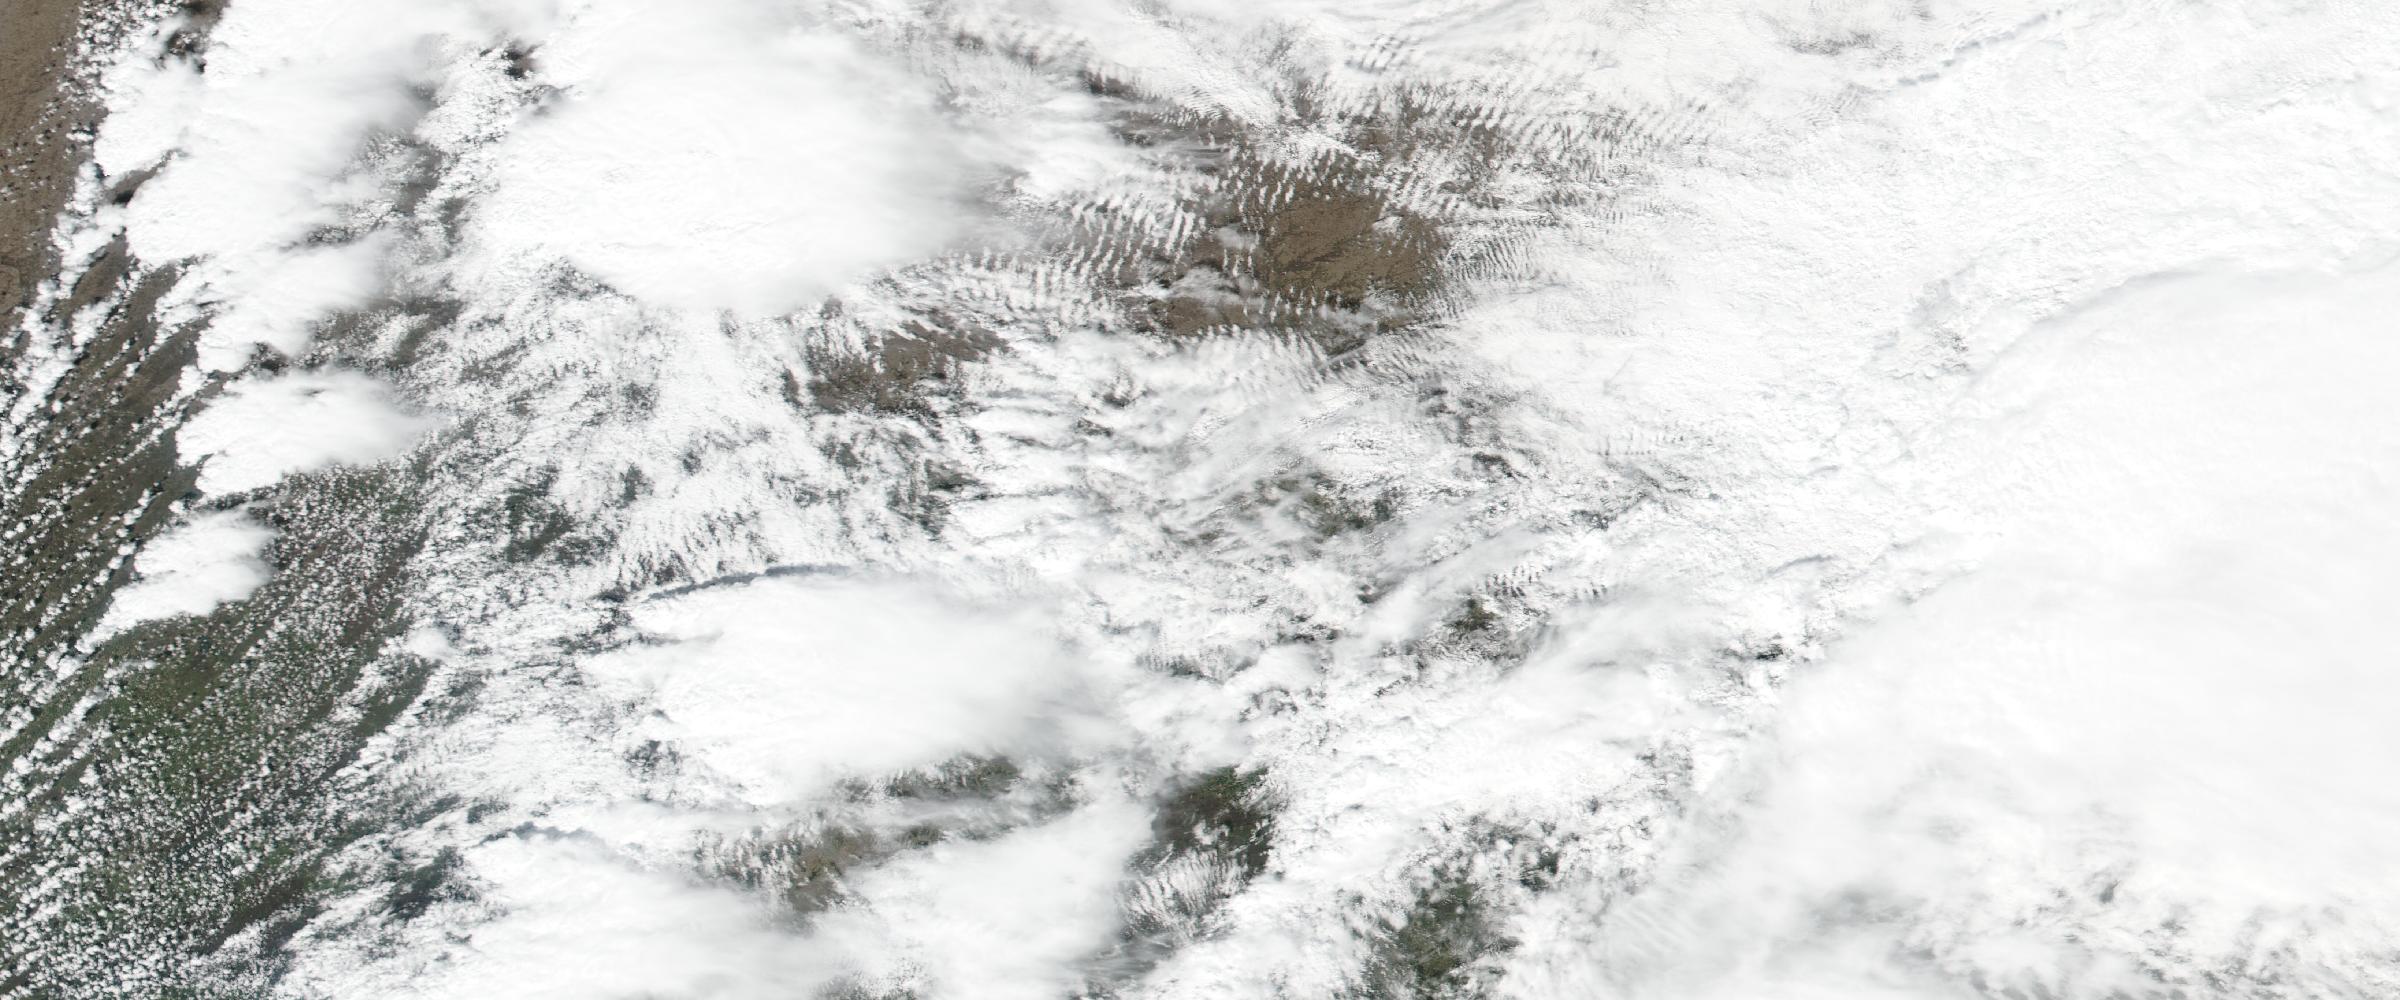
For insurers, understanding tornado risk is not only about responding to the next storm.
It is also about understanding what has happened before. Historical tornado data can provide valuable context for underwriting, portfolio management, catastrophe analysis, and exposure assessment. By examining where tornadoes have occurred—and how their tracks have intersected with insured locations—insurers can develop a more detailed view of the geographic distribution and frequency of tornado risk.
A list of tornado counts by county or state provides one perspective. Actual tornado tracks can provide another.
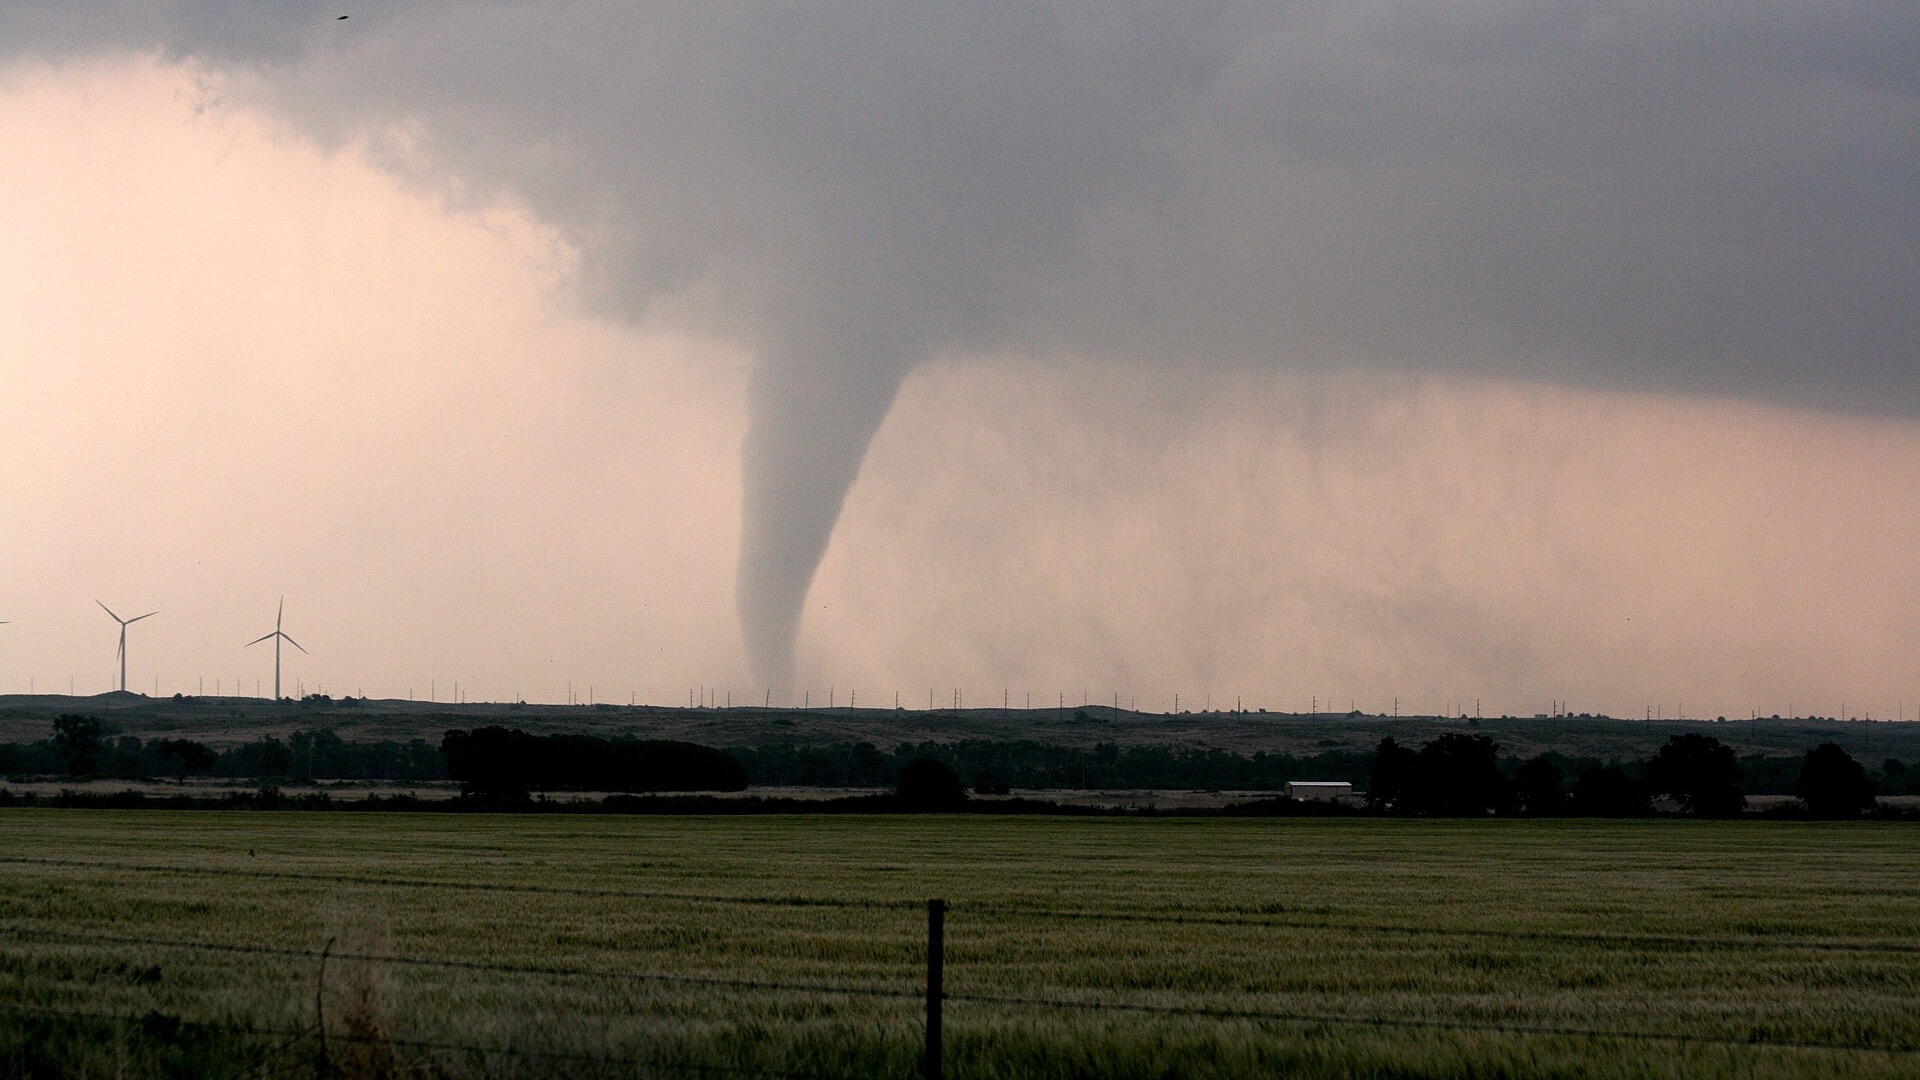
Tornadoes are highly localized events. Unlike hurricanes, which can affect large regions over an extended period, a tornado can produce a relatively narrow path of damage through a community. That makes geographic precision particularly important when analyzing insurance exposure.
A historical tornado track can help insurers understand:
This information can provide historical context that a simple tornado count cannot.
Suppose an insurer is evaluating a portfolio concentrated in a particular region. Historical statistics might show that the region has experienced hundreds of tornadoes over several decades. That is useful, but it doesn't necessarily answer the questions an insurer needs to ask about its own book of business.
Mapping historical tornado tracks against portfolio locations can help answer these questions. The result is a shift from regional hazard statistics to location-specific exposure analysis.
Historical tornado tracks can also help insurers examine event frequency across different parts of a portfolio. For example, an insurer could analyze historical events within a defined distance of its insured locations and examine:
This type of analysis can help identify whether tornado exposure is broadly distributed or concentrated in particular geographic areas. That distinction can matter when insurers evaluate accumulation and portfolio composition.
One of the most important uses of historical hazard data is understanding how a changing portfolio interacts with a relatively persistent hazard. A tornado-prone area may have experienced similar levels of tornado activity for decades. But the amount and type of property located there can change substantially.
New housing developments may expand into previously undeveloped areas. Commercial and industrial facilities may be built along transportation corridors. Distribution centers may become concentrated around major metropolitan areas. An insurer's own portfolio may also grow or change through new business, acquisitions, geographic expansion, or changes in underwriting strategy.
Historical tornado tracks provide a way to examine these changes in context. The historical hazard may be the same, but the exposure to that hazard may not be.
Put tornado tracks next to your insured locations
Historical Event Intelligence delivers tornado events as track geometry with dates, severity and source provenance — ready to intersect with your own portfolio data.
Historical tornado analysis should not be limited to the strongest events. A portfolio may be repeatedly exposed to lower-intensity tornadoes that never approach EF4 or EF5 levels. Those events can still be relevant when they occur frequently or intersect significant concentrations of insured property.
Historical track data can therefore be analyzed across the intensity spectrum. For example, insurers can examine:
This provides a broader view of historical tornado activity than focusing exclusively on extreme events.
One particularly useful application of historical tornado tracks is identifying locations that have experienced repeated proximity to tornado activity. A property does not need to be directly intersected by a tornado track to have a meaningful history of exposure. An insurer might analyze events within a defined radius around each insured location or across a portfolio.
This can reveal patterns that are difficult to see in tabular data. For example, an insurer might discover that a particular group of commercial properties has been located within several miles of multiple historical tornado tracks.
That doesn't mean those properties have been damaged—or that they necessarily will be damaged in the future. But it provides additional historical context that can be incorporated into broader portfolio analysis.
Historical tornado intelligence can also provide useful context during underwriting. An underwriter evaluating a property or account may want to understand the historical hazard environment around the location.
Questions could include:
Historical event data can complement property-specific information and other underwriting inputs. It should not be treated as a prediction of whether a future tornado will occur. Rather, it provides historical evidence about the hazard environment surrounding the risk.
For portfolio managers, the analysis can move from individual properties to concentrations. An insurer might map historical tornado tracks against its entire book of business and identify areas where significant insured value overlaps with historical tornado activity.
This can help teams investigate questions such as:
The answers can provide additional context for portfolio management and catastrophe risk discussions.
The usefulness of historical tornado analysis depends heavily on the underlying data. A simple database of event names and locations provides limited analytical flexibility.
More detailed historical event intelligence can include attributes such as:
Structuring historical events this way allows insurers and other organizations to query the data against their own geographic datasets.
For example, rather than simply asking:
“How many tornadoes occurred in Texas?”
an analyst could ask:
“How many historical tornado tracks passed within five miles of our insured commercial properties in Texas?”
That is a much more useful question for portfolio analysis.
Historical tornado data is valuable, but it is important to understand what it can and cannot tell an insurer. A historical track shows that a tornado occurred in a particular location at a particular time. It does not establish that another tornado will follow the same path in the future.
Likewise, historical proximity does not mean a property was damaged, and the absence of a historical track does not mean a location is free from future tornado risk. Historical event intelligence is therefore best used as context for risk analysis, alongside exposure data, property characteristics, catastrophe models, current observations, and other relevant information.
Historical and real-time tornado intelligence can become particularly powerful when they are part of the same analytical workflow.
Historical data provides context:
Where have tornadoes occurred before?
Real-time intelligence provides the current event:
Where is a tornado occurring now?
Together, they allow insurers to connect today's event with a longer history of hazard activity.
For example, when a tornado is detected, an insurer could identify potentially affected portfolio locations and then examine the historical tornado activity surrounding those same properties.
This creates a more complete picture of both current exposure and historical context.
Historical tornado tracks are more than lines on a map. When connected to an insurer's exposure data, they can become a valuable analytical dataset for understanding how a portfolio has interacted with tornado activity over time.
They can help insurers examine frequency, geographic concentration, repeated exposure, and the relationship between historical hazard activity and current portfolio composition.
The most useful question isn't simply:
“Where have tornadoes occurred?”
It is:
“Where have tornadoes occurred relative to what we insure?”
That shift—from historical hazard data to portfolio-specific intelligence—can help insurers better understand their exposure and make historical tornado information more actionable across underwriting, catastrophe response, and portfolio management.
Historical tracks tell the story of where tornadoes have been. Connecting those tracks to insured locations helps tell the story of where an insurer's portfolio has been exposed.
Explore the historical record
Decades of reconstructed, verified catastrophes — browse the Historical Event Intelligence overview, or request sample data for your own portfolio.
What can historical tornado tracks tell insurers that tornado counts cannot? Counts say how much activity a region has seen; tracks say where it went. That supports location-specific questions — how close past events came to insured properties, whether activity concentrated in particular corridors, whether historical tracks crossed commercial or high-value locations, and which areas were repeatedly exposed — none of which a regional total can answer.
Can historical tornado tracks predict where the next tornado will occur? No. A historical track establishes that a tornado occurred at a particular place and time. It does not establish that another will follow the same path. Equally, historical proximity does not mean a property was damaged, and the absence of a track does not mean a location is free from future risk. It is context for analysis, used alongside exposure data, property characteristics and catastrophe models.
What attributes make a historical tornado dataset useful for portfolio analysis? Event date and time, geographic coordinates, track geometry, track length, track width where available, EF rating or other severity information, event duration, damage indicators, geographic footprint, source and provenance, and related observations. Structured that way, the events can be queried directly against an insurer's own geographic data.









-min.png)
.png)

.png)



Decision-ready intelligence for understanding what's happening, what is impacted, and what to do next. Global hazard, severe weather, catastrophe, and physical risk intelligence trusted by governments, enterprises, insurers, humanitarian organizations, and technology platforms worldwide.
Request DemoContact Us

