


Event intelligence is the practice of detecting physical-world events — earthquakes, cyclones, floods, wildfires, and other hazards — as they happen, verifying them against authoritative sources, and enriching them with impact analysis: who and what is exposed, how severe it is, and what happens next. The output isn't a raw alert or a news headline. It's a decision-ready answer to the three questions every operations leader asks when the ground moves or the water rises: What just happened? Does it affect us? What should we do about it?
If you've ever forwarded a breaking-news tweet to a colleague with the message "is this real, and do we care?" — event intelligence is the discipline that answers that question in minutes, automatically, at global scale.
Every event intelligence system, whatever the vendor, runs some version of a five-stage loop:
The contrast worth drawing is with the two things event intelligence is often confused for. Raw data feeds (USGS, NOAA, GDACS and their peers) are indispensable — they're the ground truth the loop starts from — but each covers one hazard type, one region, or one format, and none of them answers "does this affect my assets?" News monitoring tells you what journalists have confirmed, which for fast-moving hazards means it tells you what was true an hour ago. Event intelligence sits between the sensor and the story: faster than news, and unlike a single feed, global, multi-hazard, and impact-aware.
Three overlapping terms, three different jobs:
| Event intelligence | Risk intelligence | Threat intelligence | |
|---|---|---|---|
| Core question | What is happening right now, and what does it affect? | What could plausibly happen, and how exposed are we? | Who intends to do us harm, and how? |
| Time horizon | Real time to days | Months to decades | Ongoing / adversarial |
| Typical inputs | Sensor networks, official bulletins, satellite detections | Historical event data, hazard models, exposure databases | Human sources, signals, dark-web and OSINT monitoring |
| Typical output | Verified event with impact assessment and alerts | Risk scores, rankings, scenario analyses | Actor profiles, indicators, warnings |
| Example | "M7.1 earthquake, 40 km from your Kyushu supplier; tsunami advisory issued" | "Your Kyushu supplier sits in a top-decile seismic zone" | "A ransomware group is targeting logistics firms" |
The three compose rather than compete. Risk intelligence tells you where to worry; event intelligence tells you when the worry has arrived. (Threat intelligence, being adversarial and mostly cyber/security-focused, is usually a different team's budget entirely.) The strongest programs connect the first two: the same historical event data that powers a risk ranking is what lets a real-time alert say "this is the worst flood at this location in 40 years" instead of just "flood."
Critical event management (CEM) platforms are built around three pillars: intelligence (know something happened), communication (mass-notify your people), and response orchestration (run the playbook — task assignments, check-ins, escalation flows).
DisasterAWARE is not a CEM platform, and it's worth being plain about that, because buyers waste weeks discovering it the slow way with vendors who blur the line:
That last clause is the practical point. A CEM platform is only as good as the events it knows about; false alarms burn credibility and missed events burn everything else. Organizations that already run a CEM or notification stack use event intelligence as the upstream feed that decides when the machine spins up. Organizations that don't need mass notification — data teams, analysts, insurers, platform builders — often discover the intelligence layer alone was what they were shopping for.
Definitions are cheap; the loop is easier to see running. Two recent events, both covered in our weekly hazard briefs, show the stages in the wild.
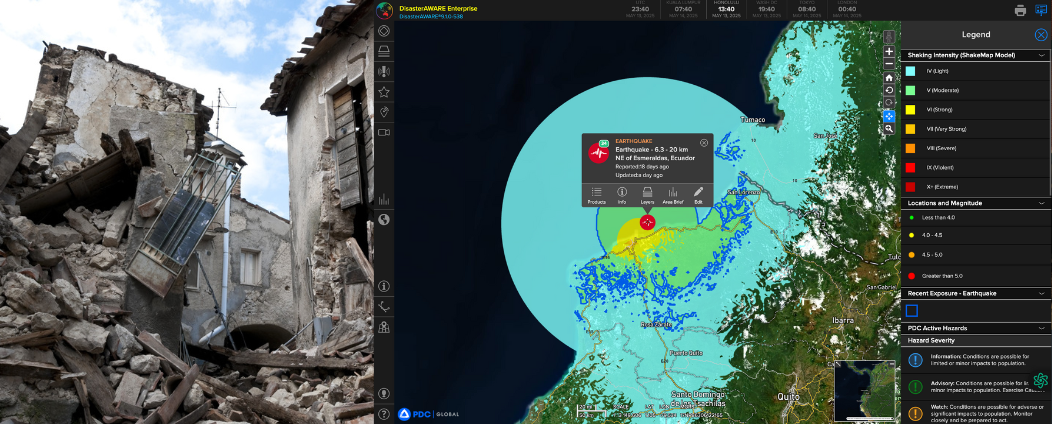
A cascade, watched in real time. At 07:27 UTC on July 28, 2026, a magnitude 7.1 earthquake struck Kyushu, Japan, near Uto in Kumamoto Prefecture. Within minutes the event existed in DisasterAWARE with a verified magnitude, depth, and location — stages one and two of the loop. Then the cascade began, and each branch of it was detected, linked to the parent event, and impact-assessed as it unfolded: tsunami bulletins active for the Hawaiian Islands by 07:40, for Alaska, British Columbia, and the US West Coast by 07:46, and a one-meter warning for the local Pacific coastline by 08:38; aftershocks; and, in Kumamoto City, a partial building collapse tracked as its own exposure-scored accident event. The mainshock's impact assessment quantified 3.41 million people, 1.54 million households, and $1.21 trillion of infrastructure in the affected area — numbers that existed while responders were still en route, not in a report weeks later. The full timeline is reconstructed in Anatomy of a Cascade: Kyushu's M7.1 — read it as a worked example of enrichment and impact assessment happening while the event is still live.
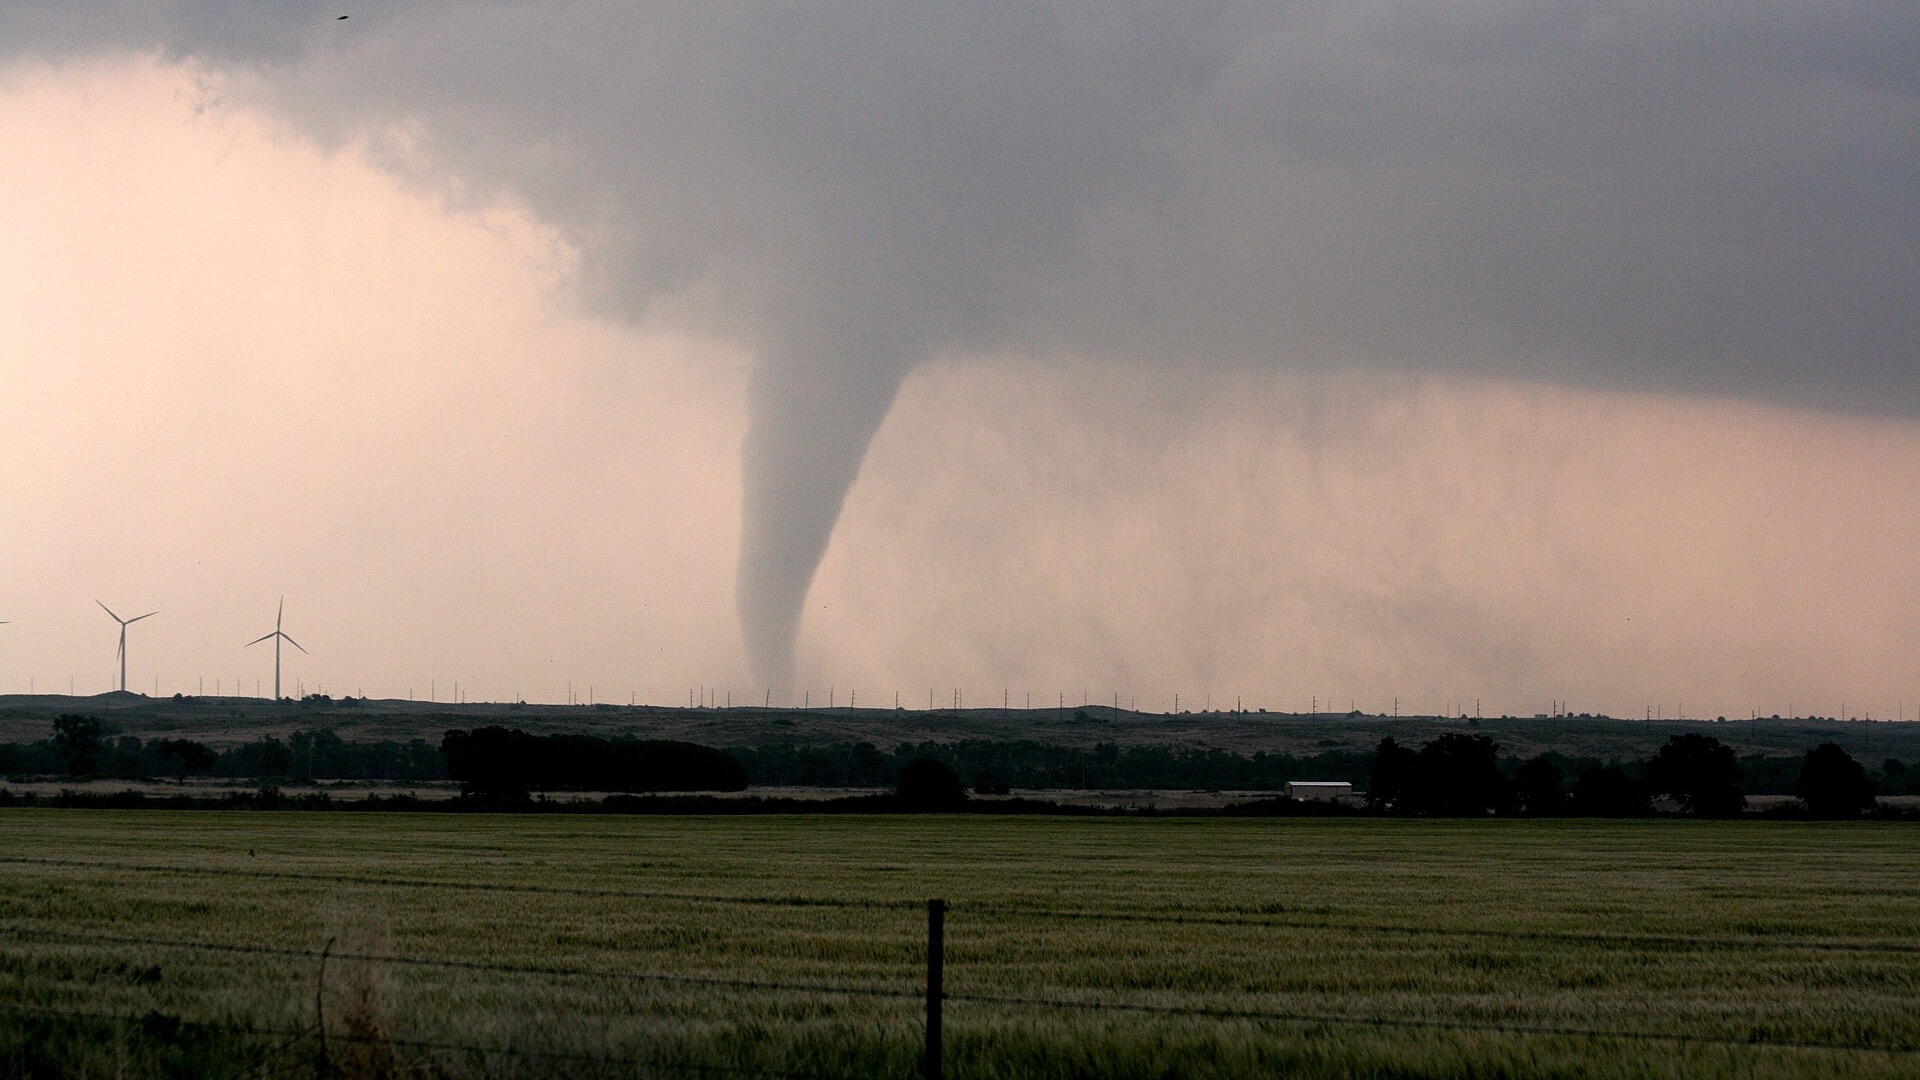
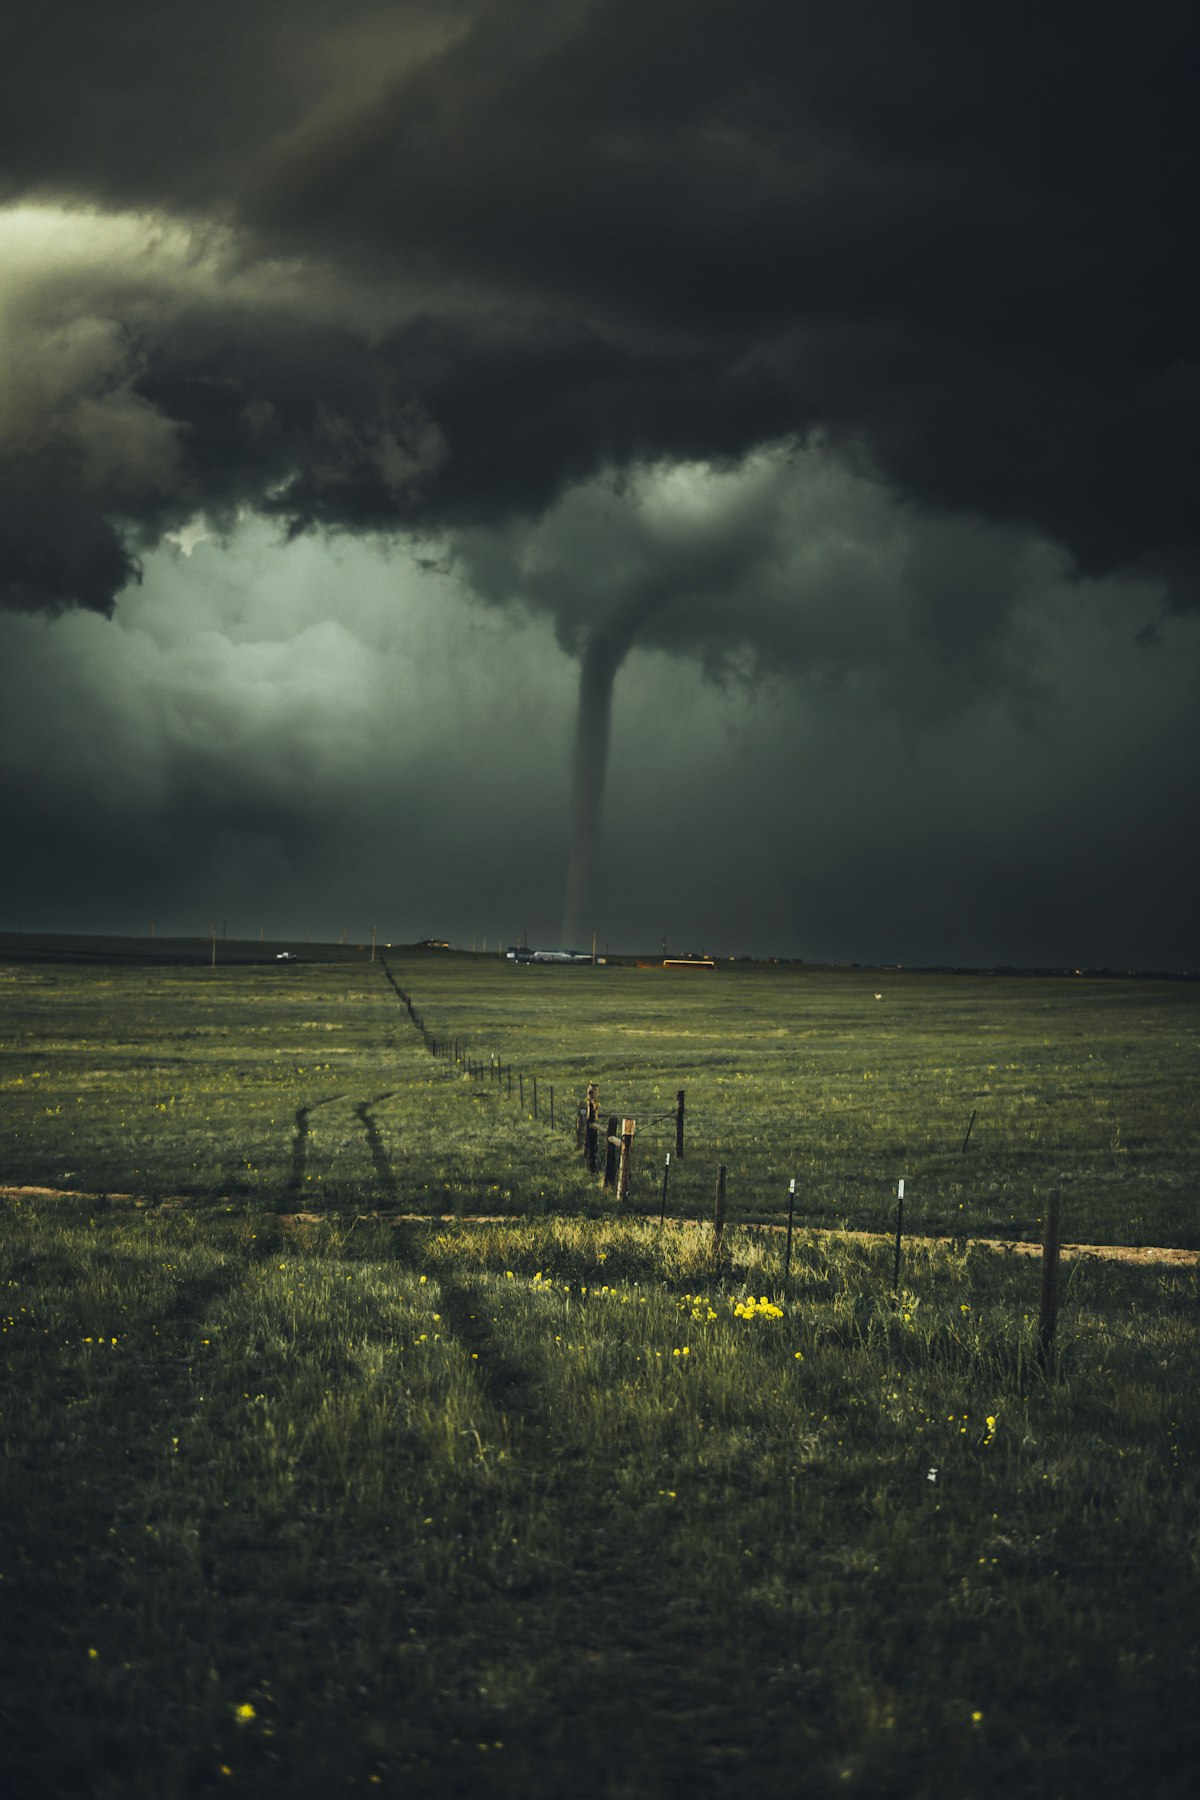
A record verified, not rumored. Tornado ratings are not measured in the moment; they are established afterward, by teams walking the damage path — and they can change. The Enderlin, North Dakota tornado of June 20, 2025 was initially rated EF3. Months later the National Weather Service upgraded it to EF5, the first in the United States since 2013, after surveyors weighed damage to a derailed freight train that revealed winds far beyond what the surrounding structures could demonstrate. Nothing about the storm changed; the evidence did. An event intelligence system has to carry an event from first detection through that entire process — attaching the verified rating when it lands, and revising it when the record moves. The gap between what is claimed early and what is established later is exactly where operational decisions go wrong, and exactly what verification is for.
See event intelligence running live
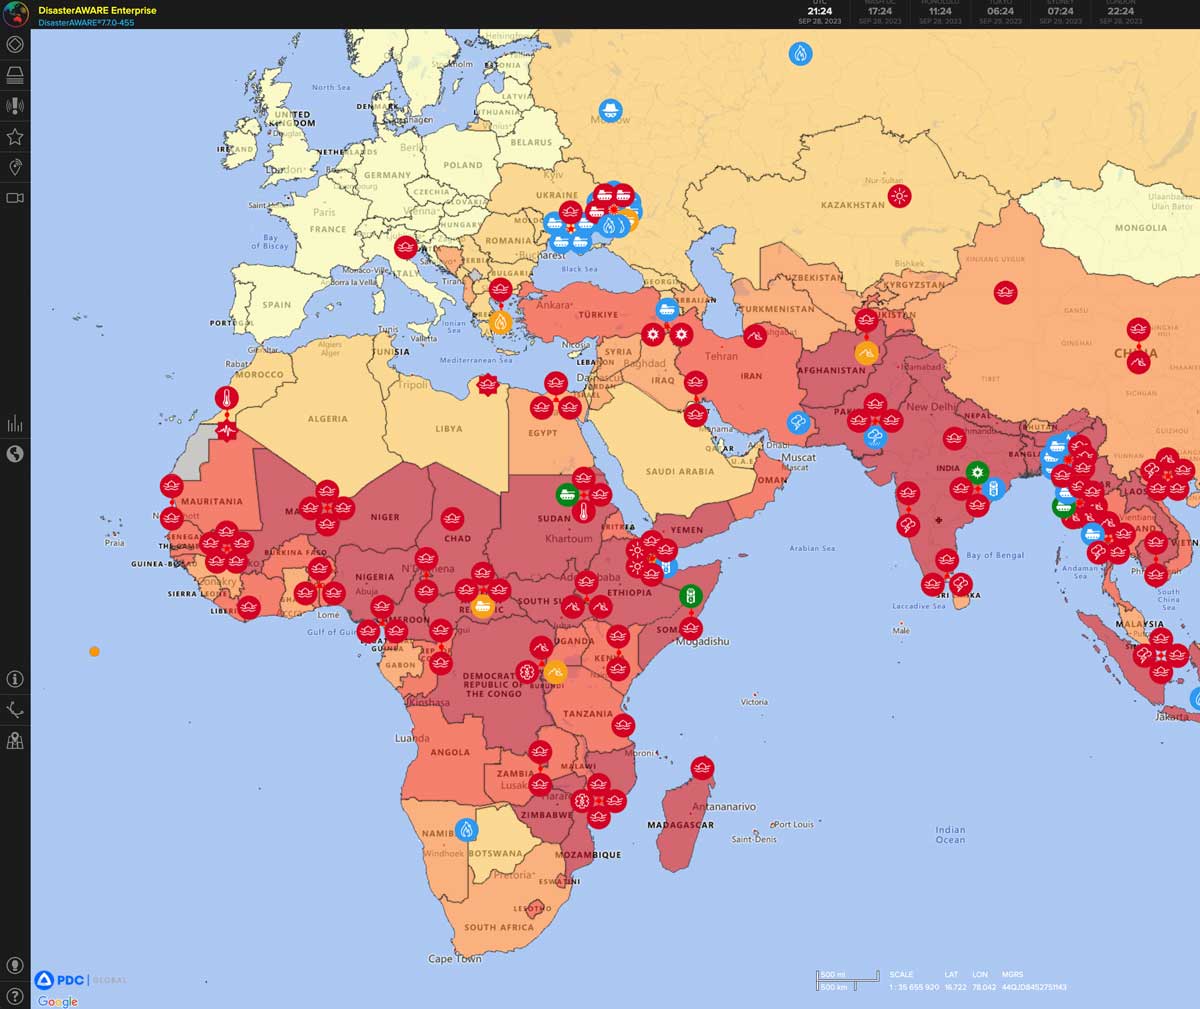
DisasterAWARE monitors 30+ hazard types worldwide in real time — with the population, infrastructure, and assets exposed under each one.
The five-stage loop above is easy to state and hard to build, and the difficulty is concentrated in two unglamorous places: source reconciliation and impact scoring.
Sources disagree, constantly — and that's normal science, not broken data. The Kyushu mainshock is a clean example: the Japan Meteorological Agency published it at magnitude 7.1 while the USGS National Earthquake Information Center logged M6.8. Neither is wrong — different networks, different methods, different distances from the source. A raw-feed consumer sees two conflicting events, or worse, double-counts them as two earthquakes. An event intelligence pipeline recognizes them as one event, reconciles the solutions, records the provenance of each, and presents a single verified record with the disagreement preserved rather than papered over. Multiply that by every hazard type — flood extents from different satellite passes, fire perimeters from different detection systems, storm intensities from different agencies — and reconciliation is most of the engineering.
Impact scoring is what converts a detection into a priority. Hundreds of events are active worldwide on any given day; almost none of them matter to any particular organization. The scoring step intersects each verified event with population, infrastructure, and — for organizations that supply their own locations — facilities and assets, producing the exposure numbers that let a human (or an automated workflow) rank the day's events in seconds. It's the difference between an inbox of 900 alerts and a short list of three that warrant action. When people say a feed has "too much noise," this is almost always the missing piece: not fewer events, but exposure-ranked ones.
The practical test of any pipeline is whether both halves run without a human in the loop, at global scale, around the clock — because the events that matter most have a habit of arriving at 3 a.m. local time.
In DisasterAWARE's architecture — and, we'd argue, in any complete implementation — event intelligence decomposes into four capabilities:
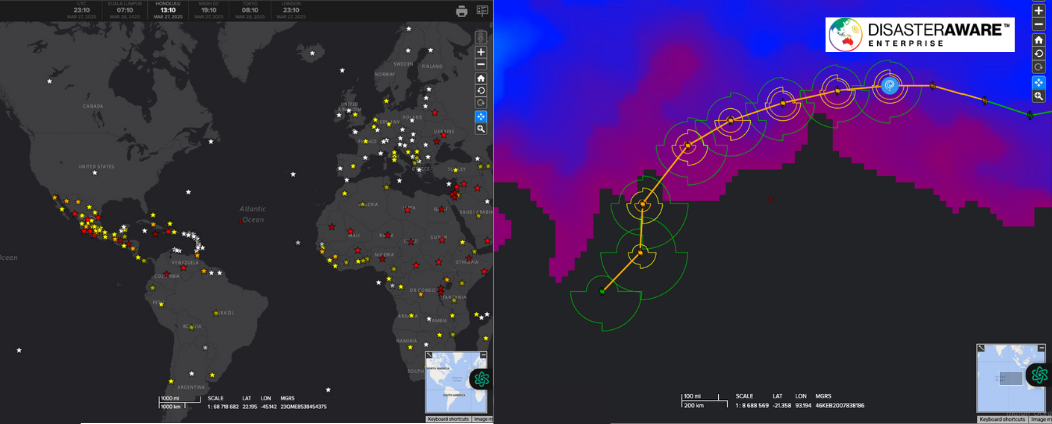
1. Real-time event detection and delivery. The live loop itself: multi-hazard, global, verified, and consumable both by humans (map, dashboard, alerts) and machines. In our stack this is the Event Intelligence API, the same feed that powers the live global hazard map and the hourly-refreshed alert strips on our city risk pages.
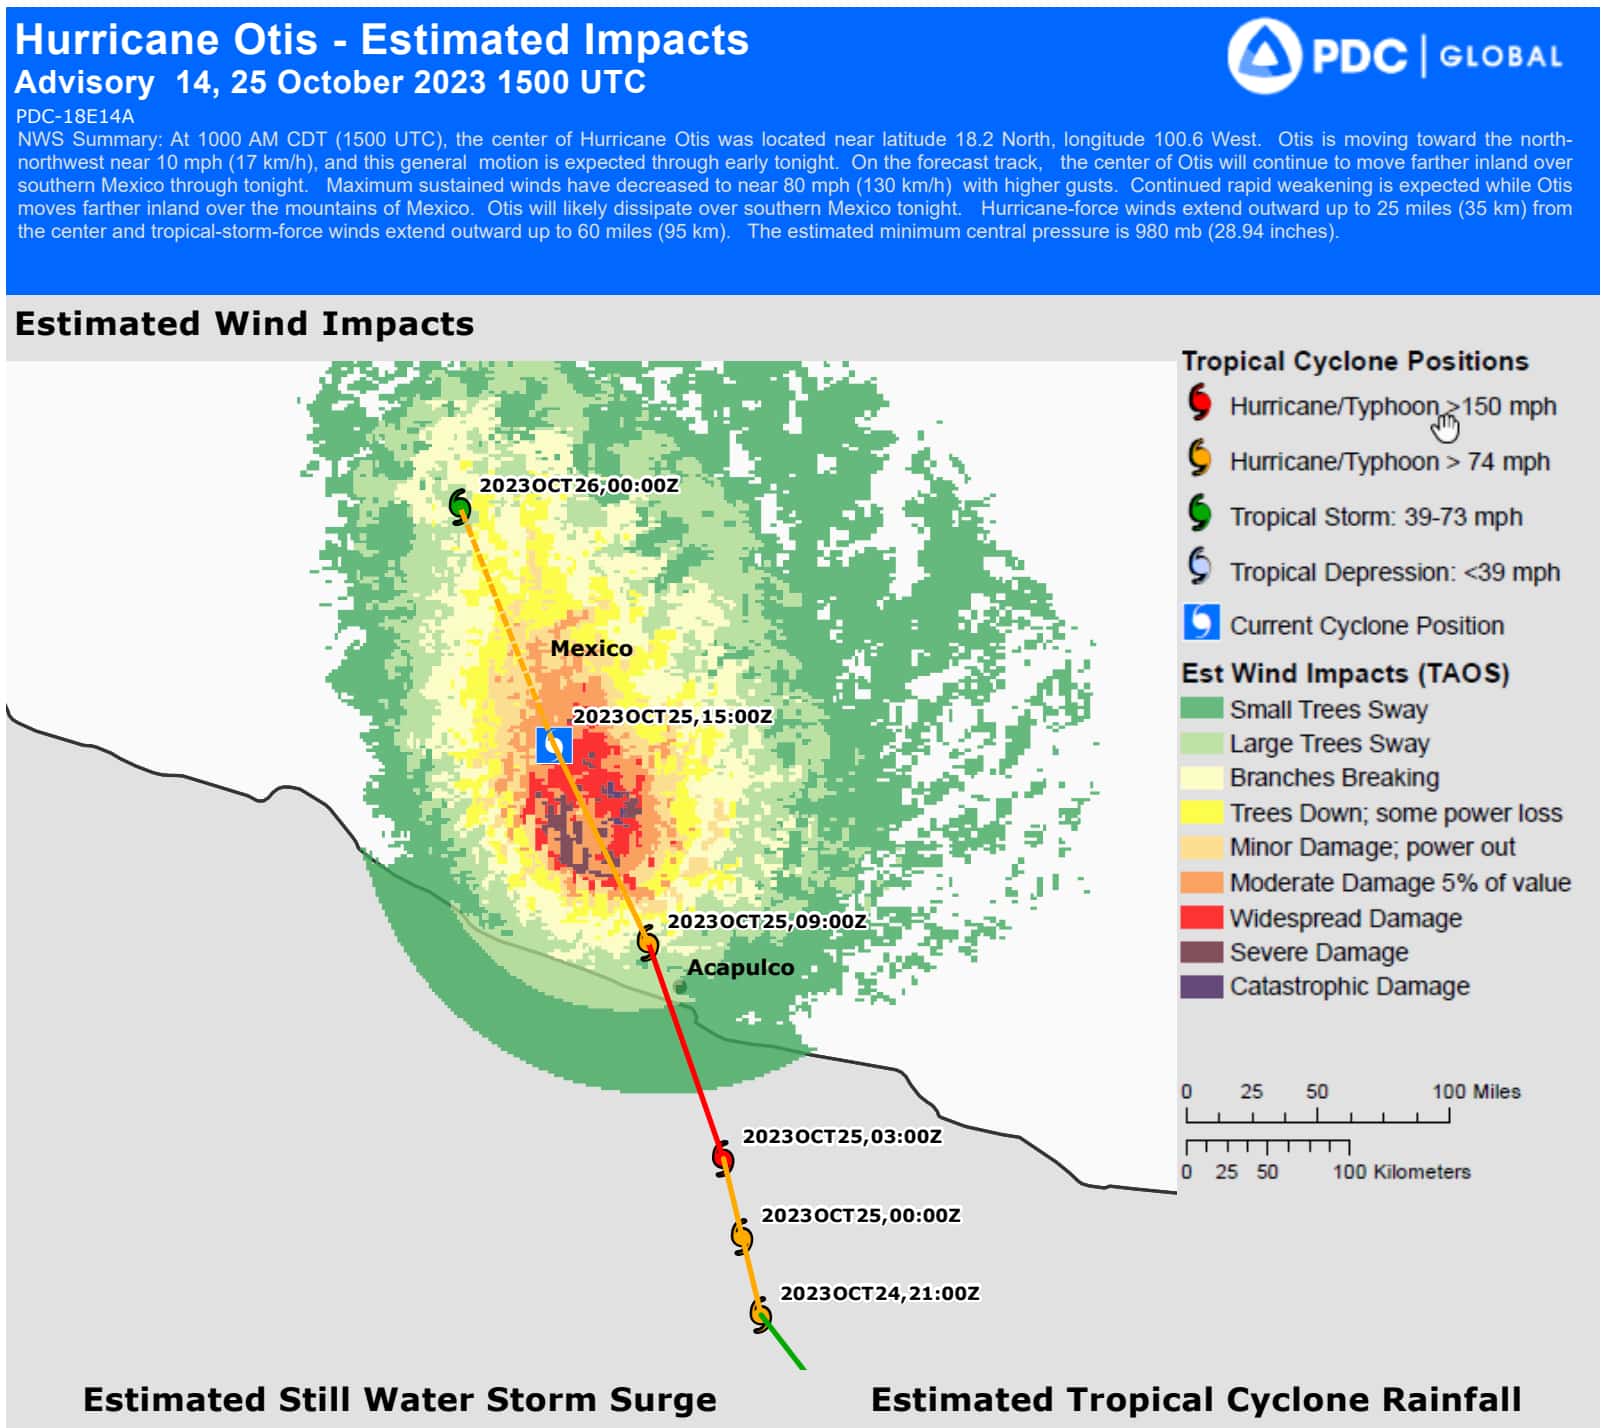
2. Geospatial impact context. An event only matters where it intersects the world. Geospatial Intelligence Layers supply that world: population, infrastructure, critical facilities, and hazard-specific model layers that turn "M7.1 at these coordinates" into "these communities, this exposure."
3. Historical baseline. "Is this normal?" is an intelligence question, and it's unanswerable without depth. Historical Event Intelligence provides the decades-deep event record that lets a live alert carry percentile context — and that powers the risk rankings on our city and hazard risk pages.
4. Analytics and early warning. The forward-looking layer: severity estimation, exposure modeling, and predictive analytics via AI & Analytics Intelligence, so that intelligence arrives before the impact does, not after.
The DisasterAWARE Platform is these four composed into one operational picture; the APIs expose each as a building block for teams assembling their own.
Six criteria separate the platforms from the feeds. If you're evaluating vendors — including us — put these in the RFP:
So, can software monitor global disaster risks? Yes — that's precisely what this category does — but the honest version of the answer is that software monitors global events well and risks only as well as its historical and exposure data allow. Evaluate both halves.
What is the difference between event intelligence and critical event management? Event intelligence is the knowing layer: detecting, verifying, and assessing physical-world events. Critical event management is the acting stack built on top of it: mass notification, employee safety check-ins, and response orchestration. DisasterAWARE provides the intelligence layer and integrates with CEM and notification tools; it does not replace them.
Is there an API for natural disaster data? Yes. The Event Intelligence API delivers verified, global, multi-hazard events — earthquakes, tropical cyclones, floods, wildfires, tsunamis, volcanoes, and more — with severity and impact attributes, in developer-standard formats. Historical bulk data is available alongside the live feed.
What data sources feed event intelligence? Authoritative scientific and governmental sources: seismic networks, national meteorological and hydrological services, satellite-based fire and flood detection, tsunami warning centers, and official civil-protection bulletins — hundreds of feeds, cross-verified into a single event record.
How fast is "real time"? It varies by hazard physics: seismic events are typically detectable in minutes; cyclones are tracked continuously against forecast updates; floods and wildfires develop over hours and are updated as detections land. The honest benchmark is time-to-verified-event, and it's a number a vendor should be willing to state per hazard.
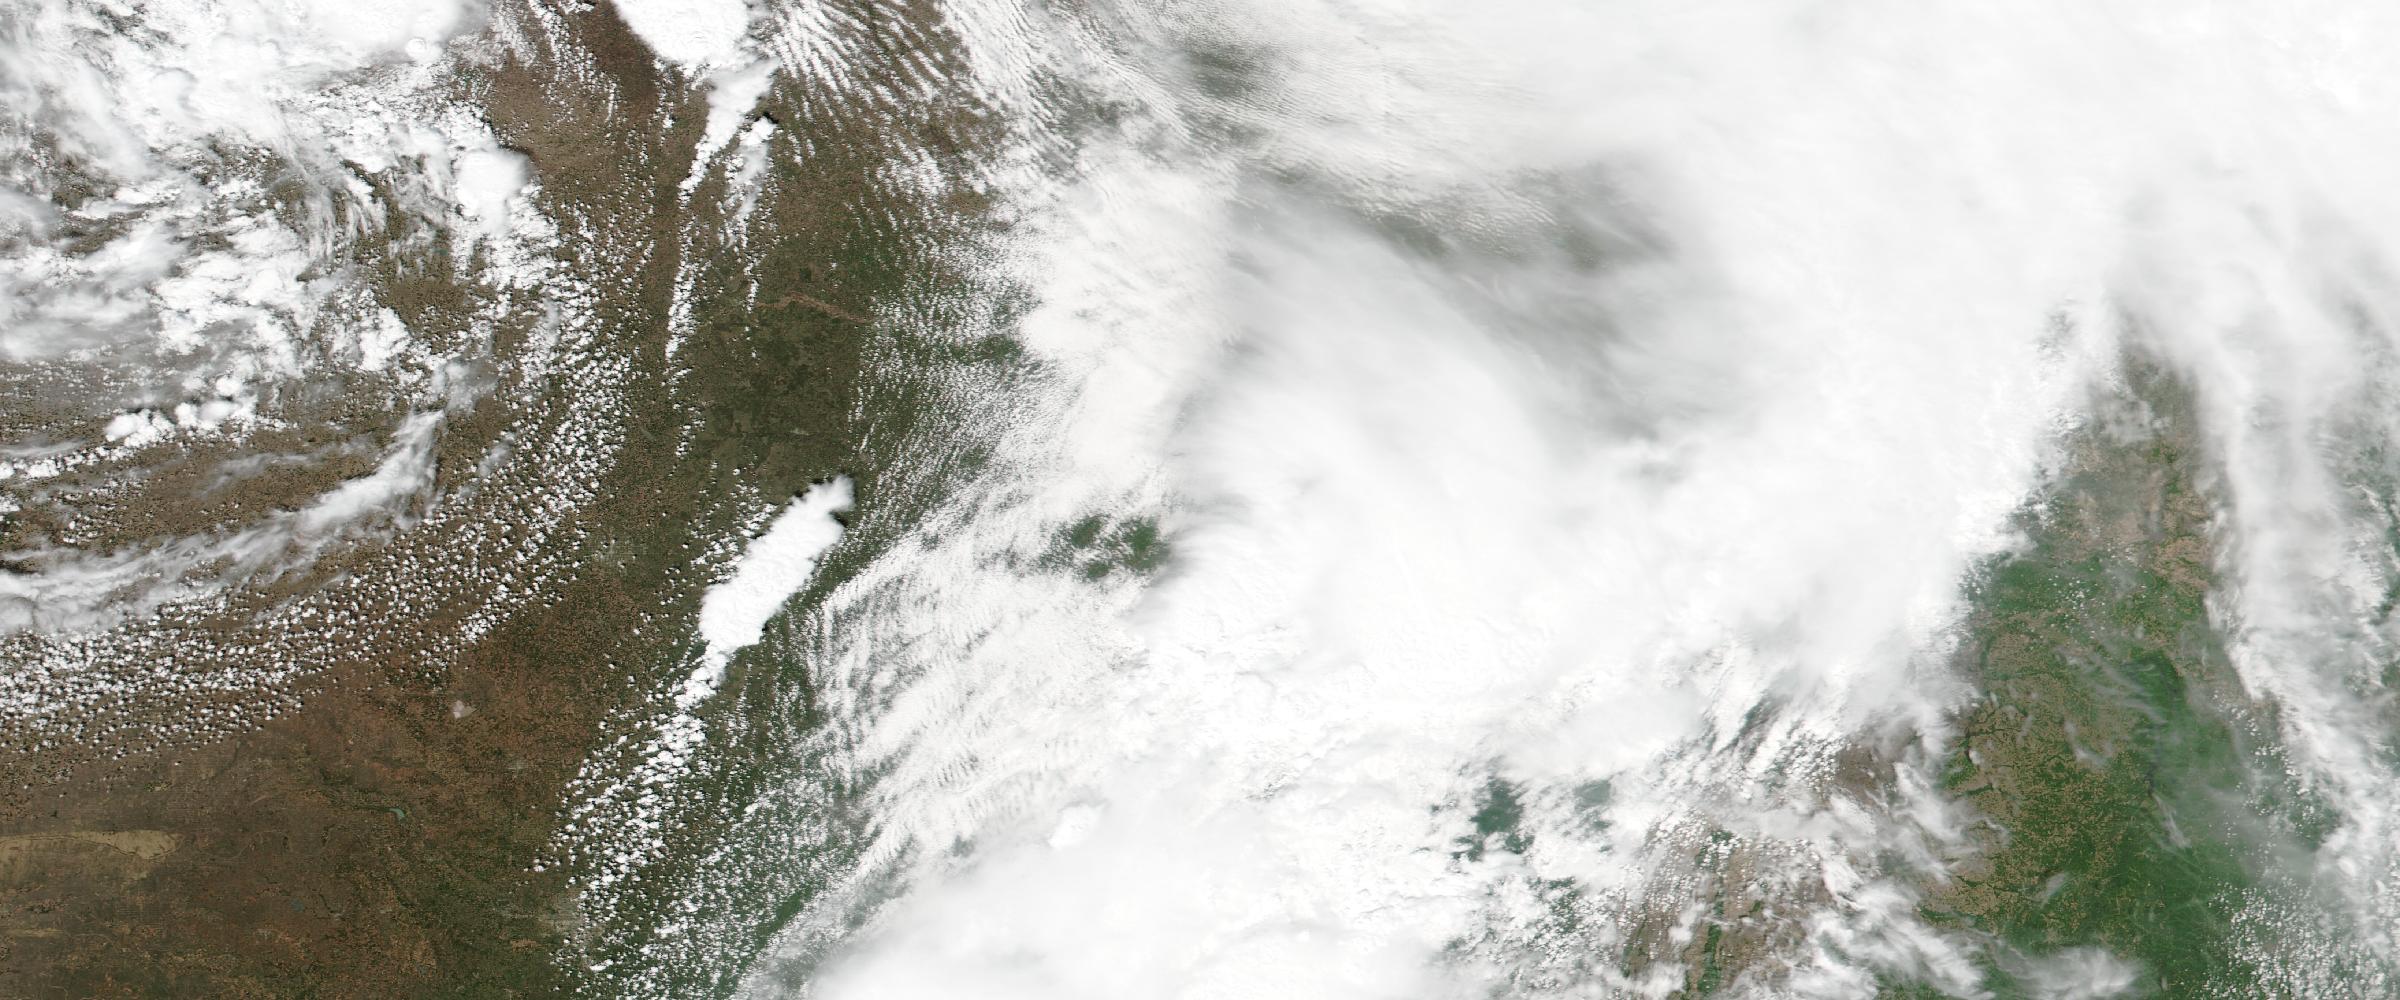
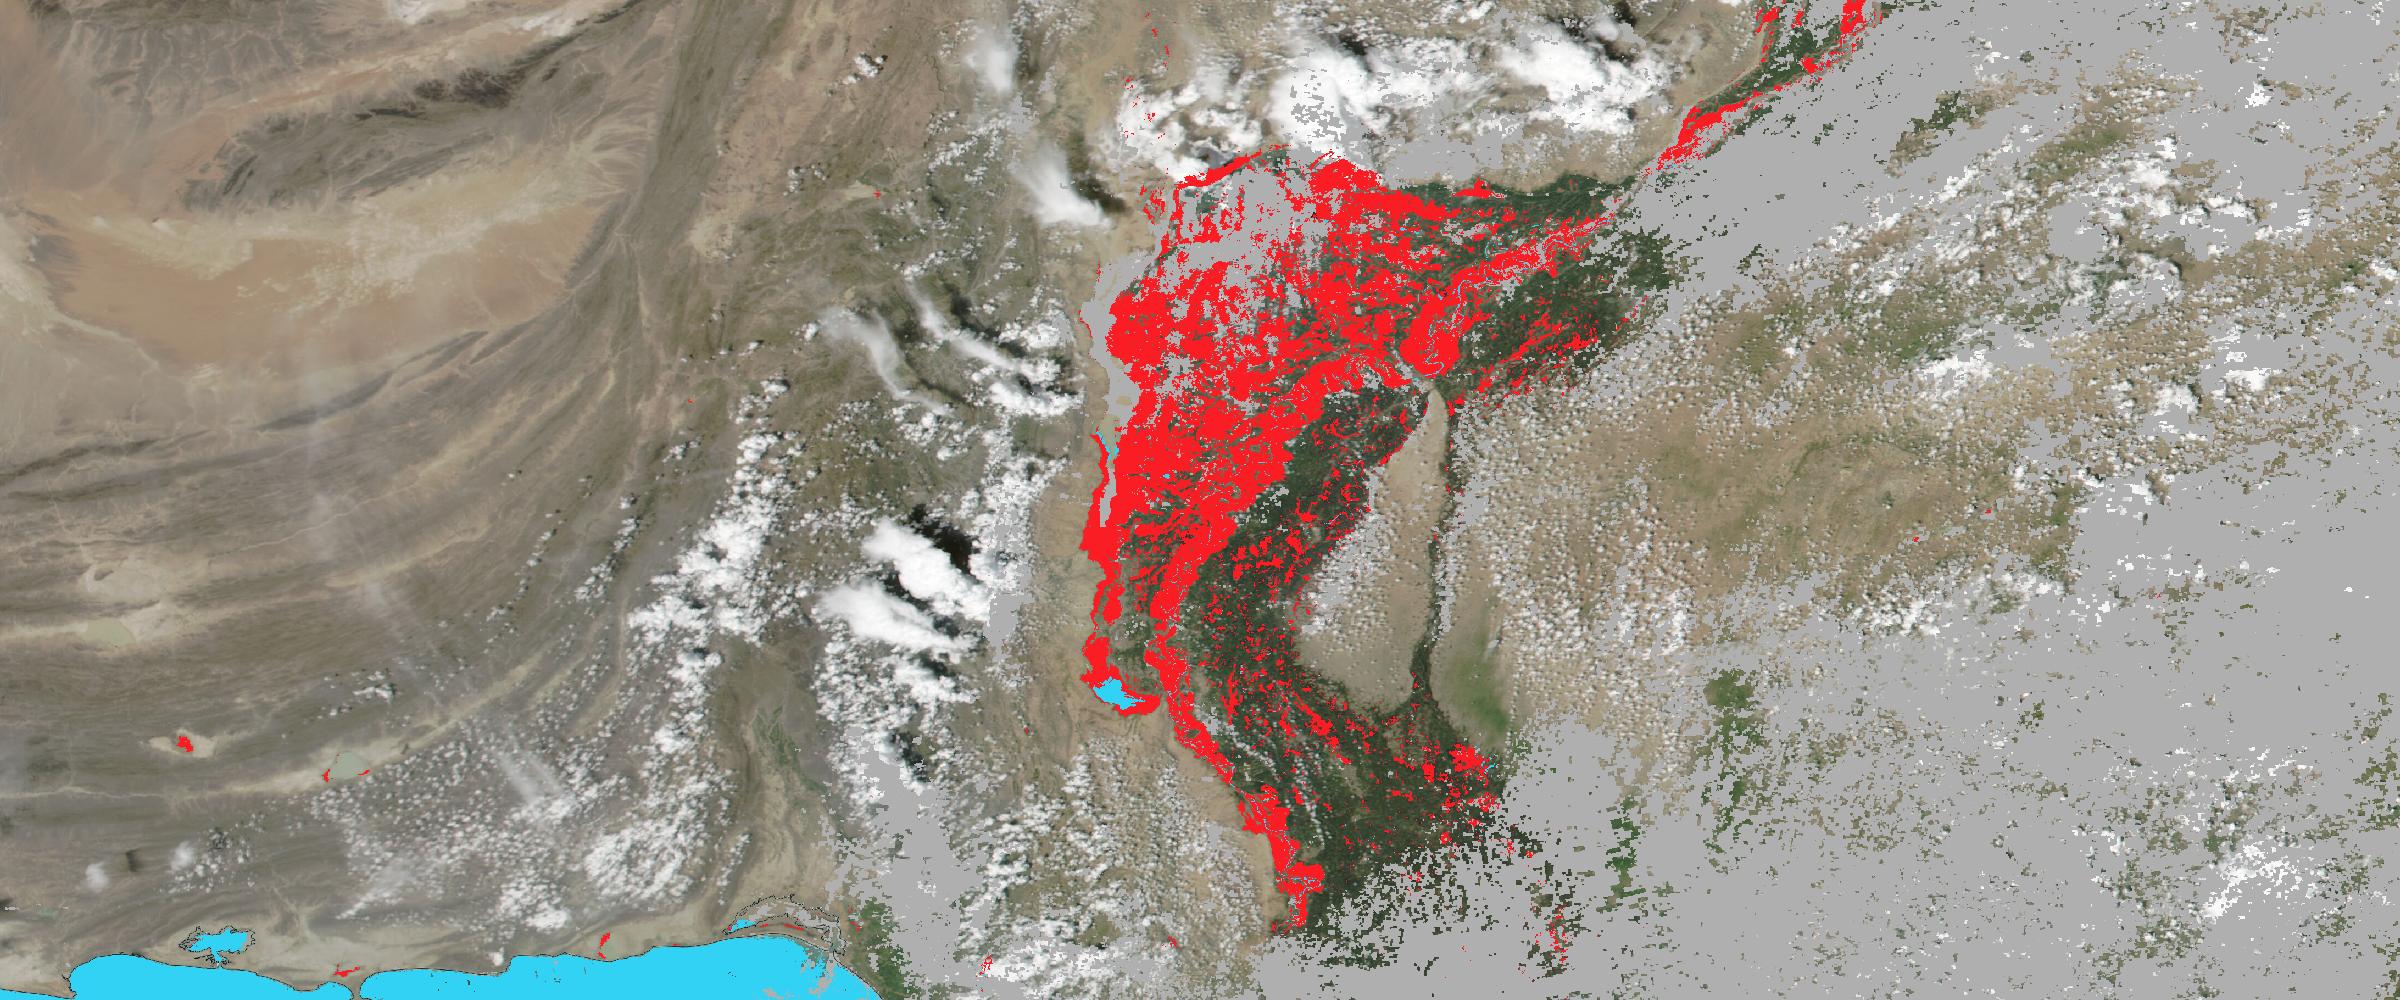
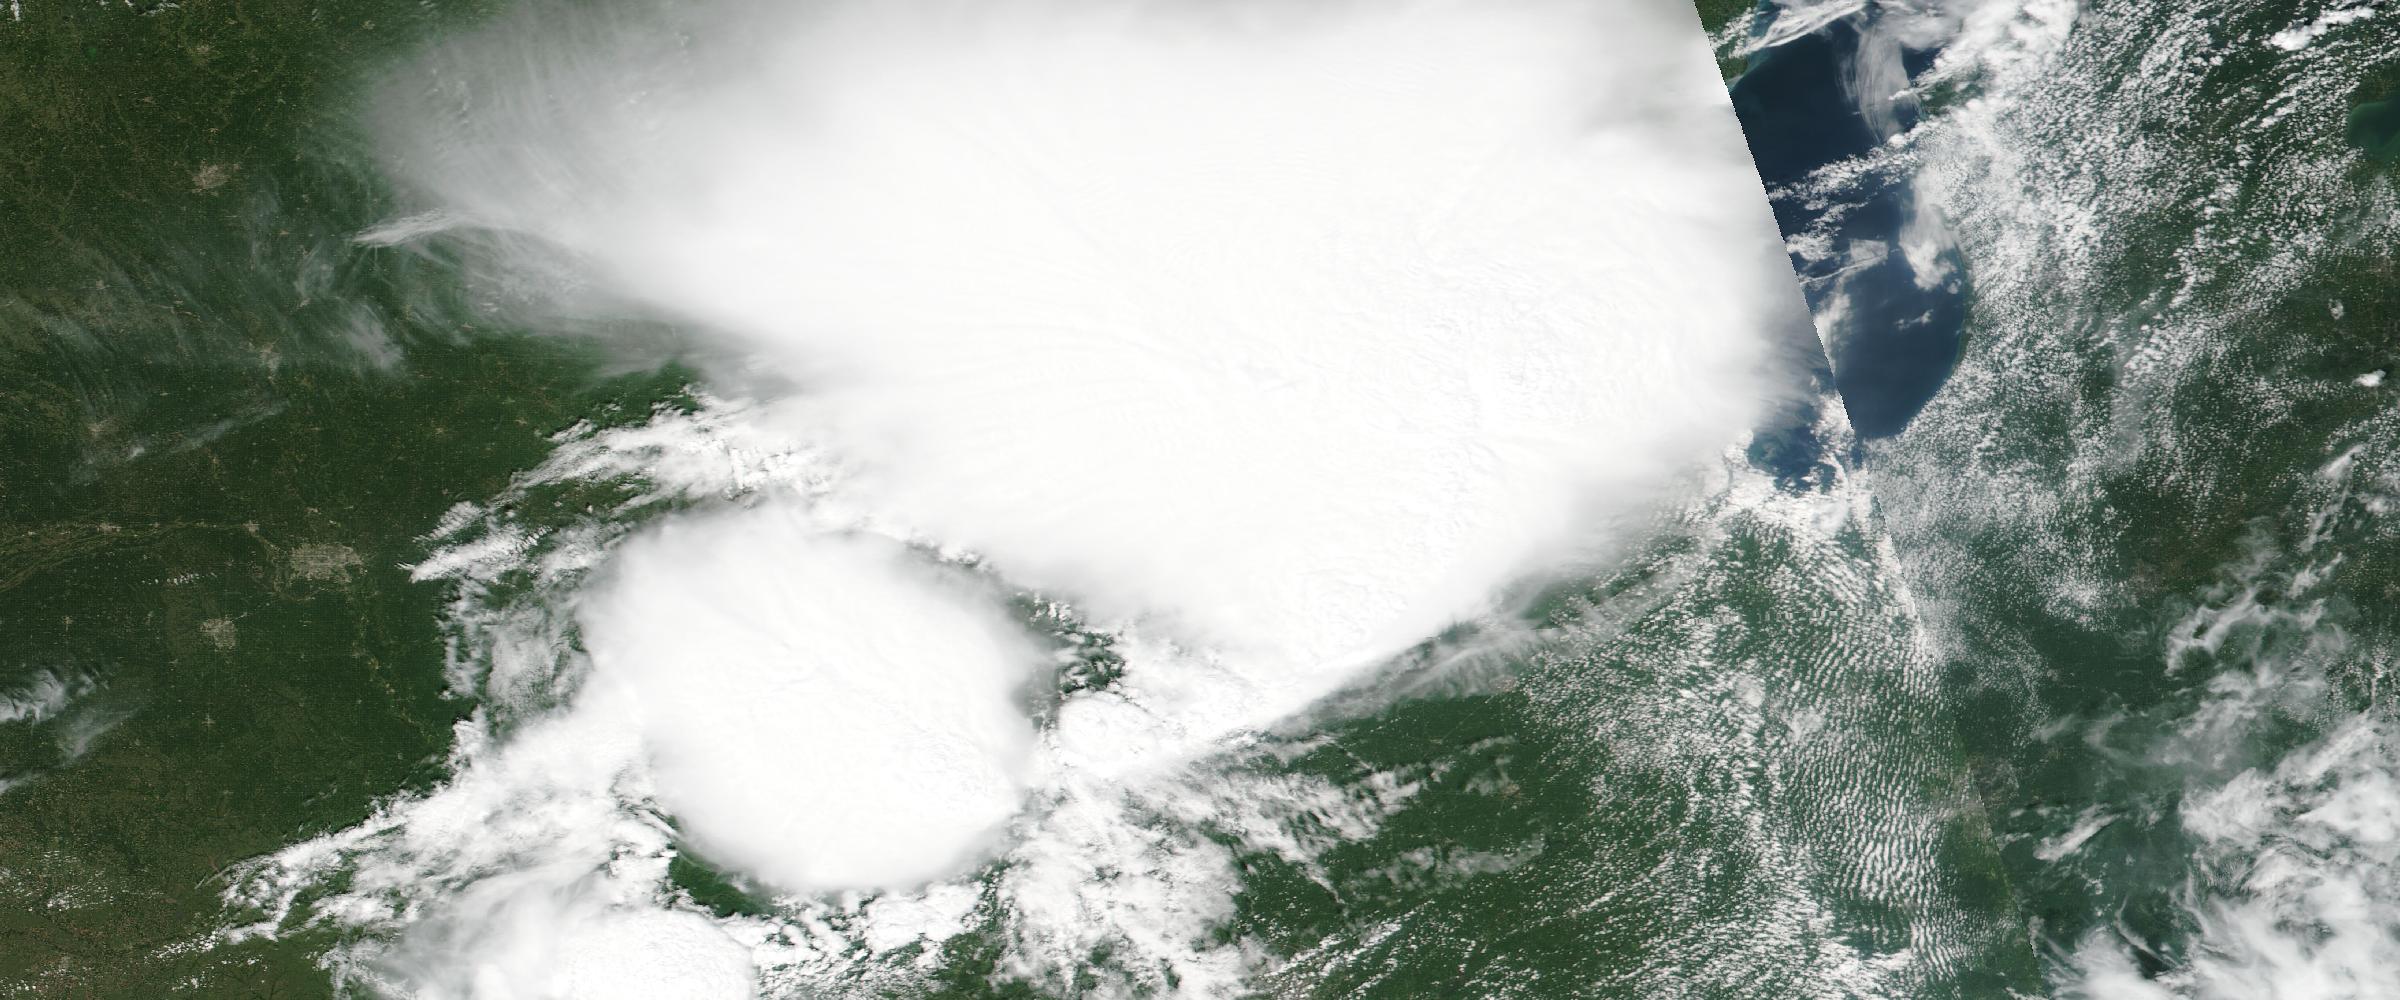
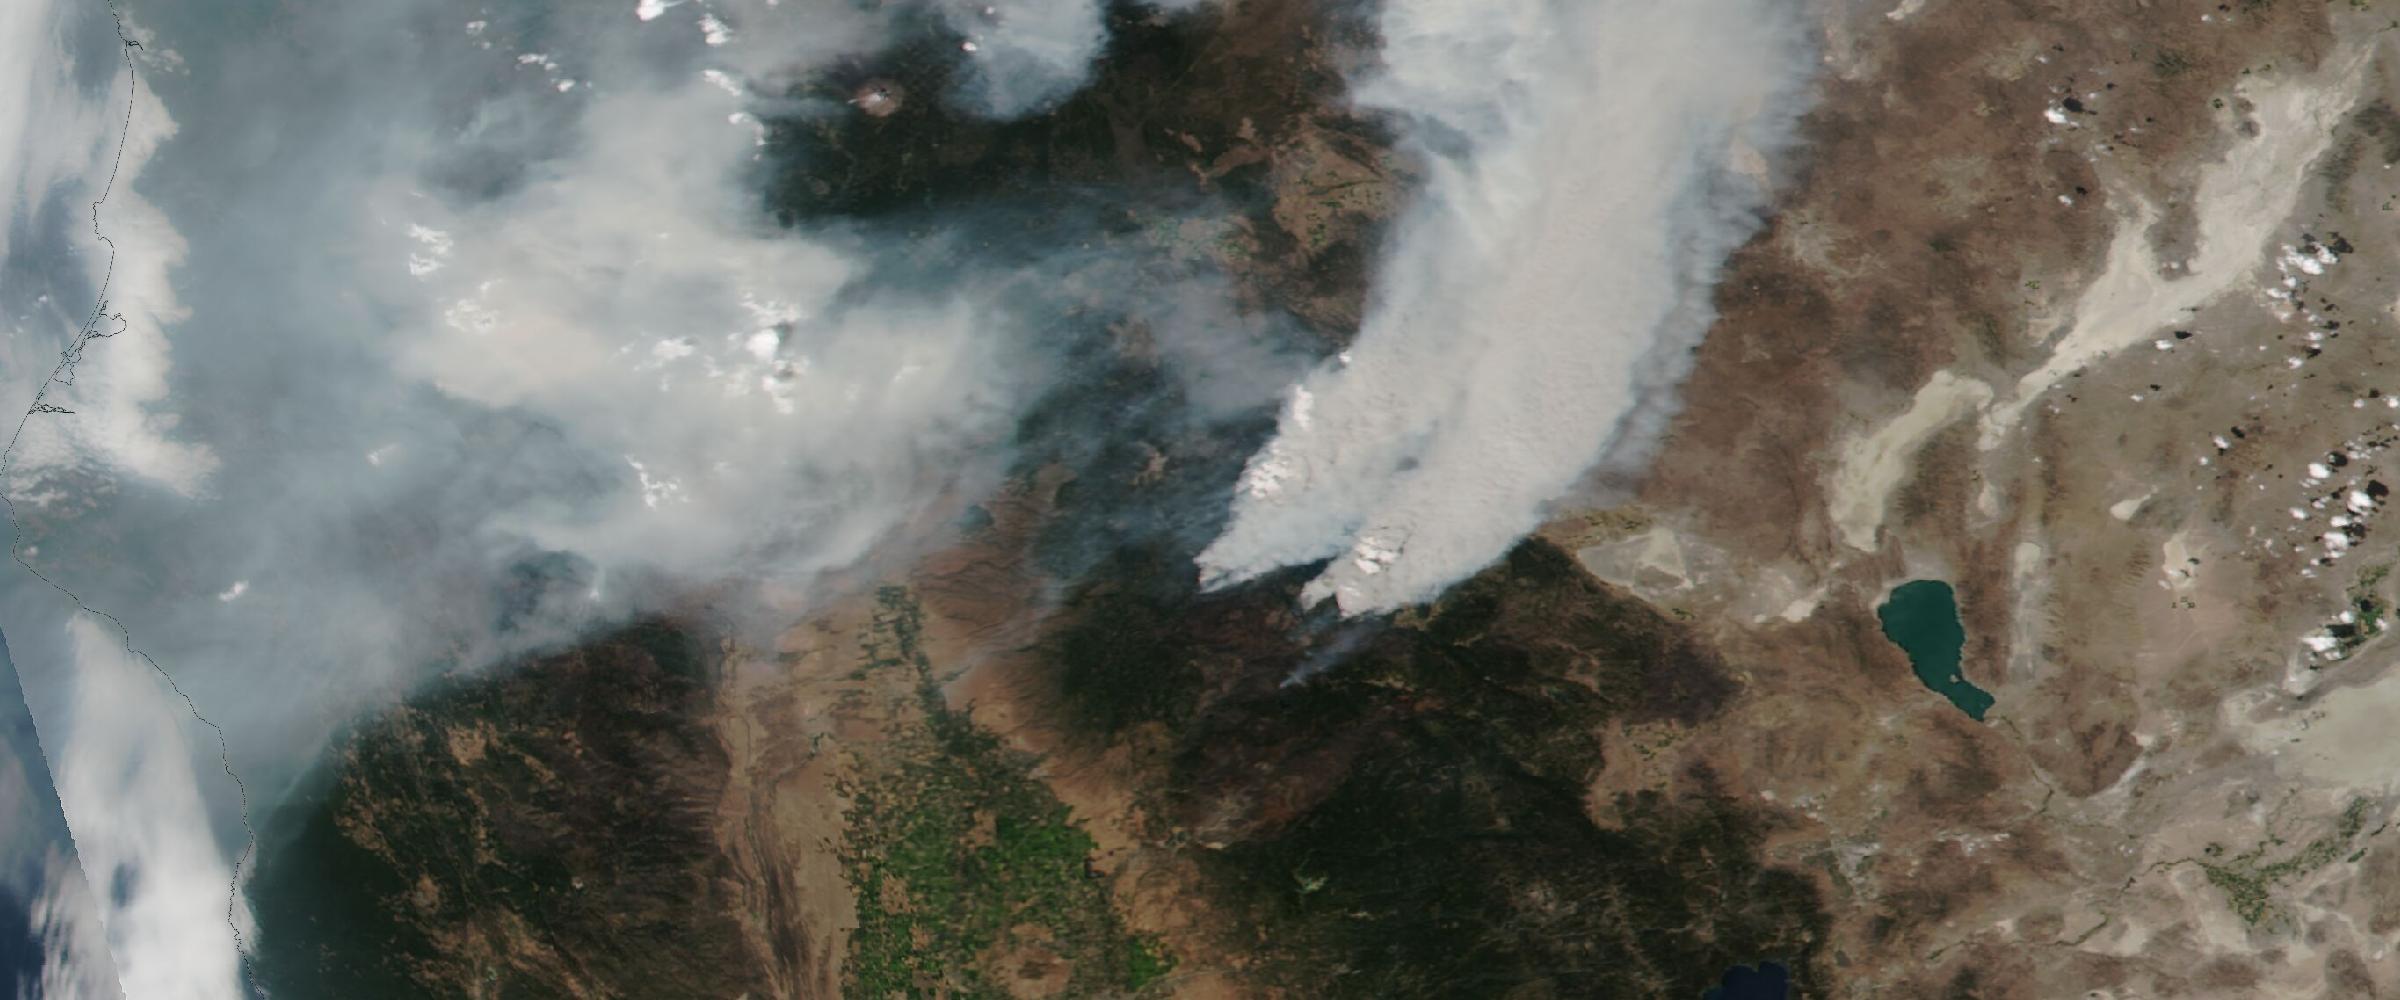
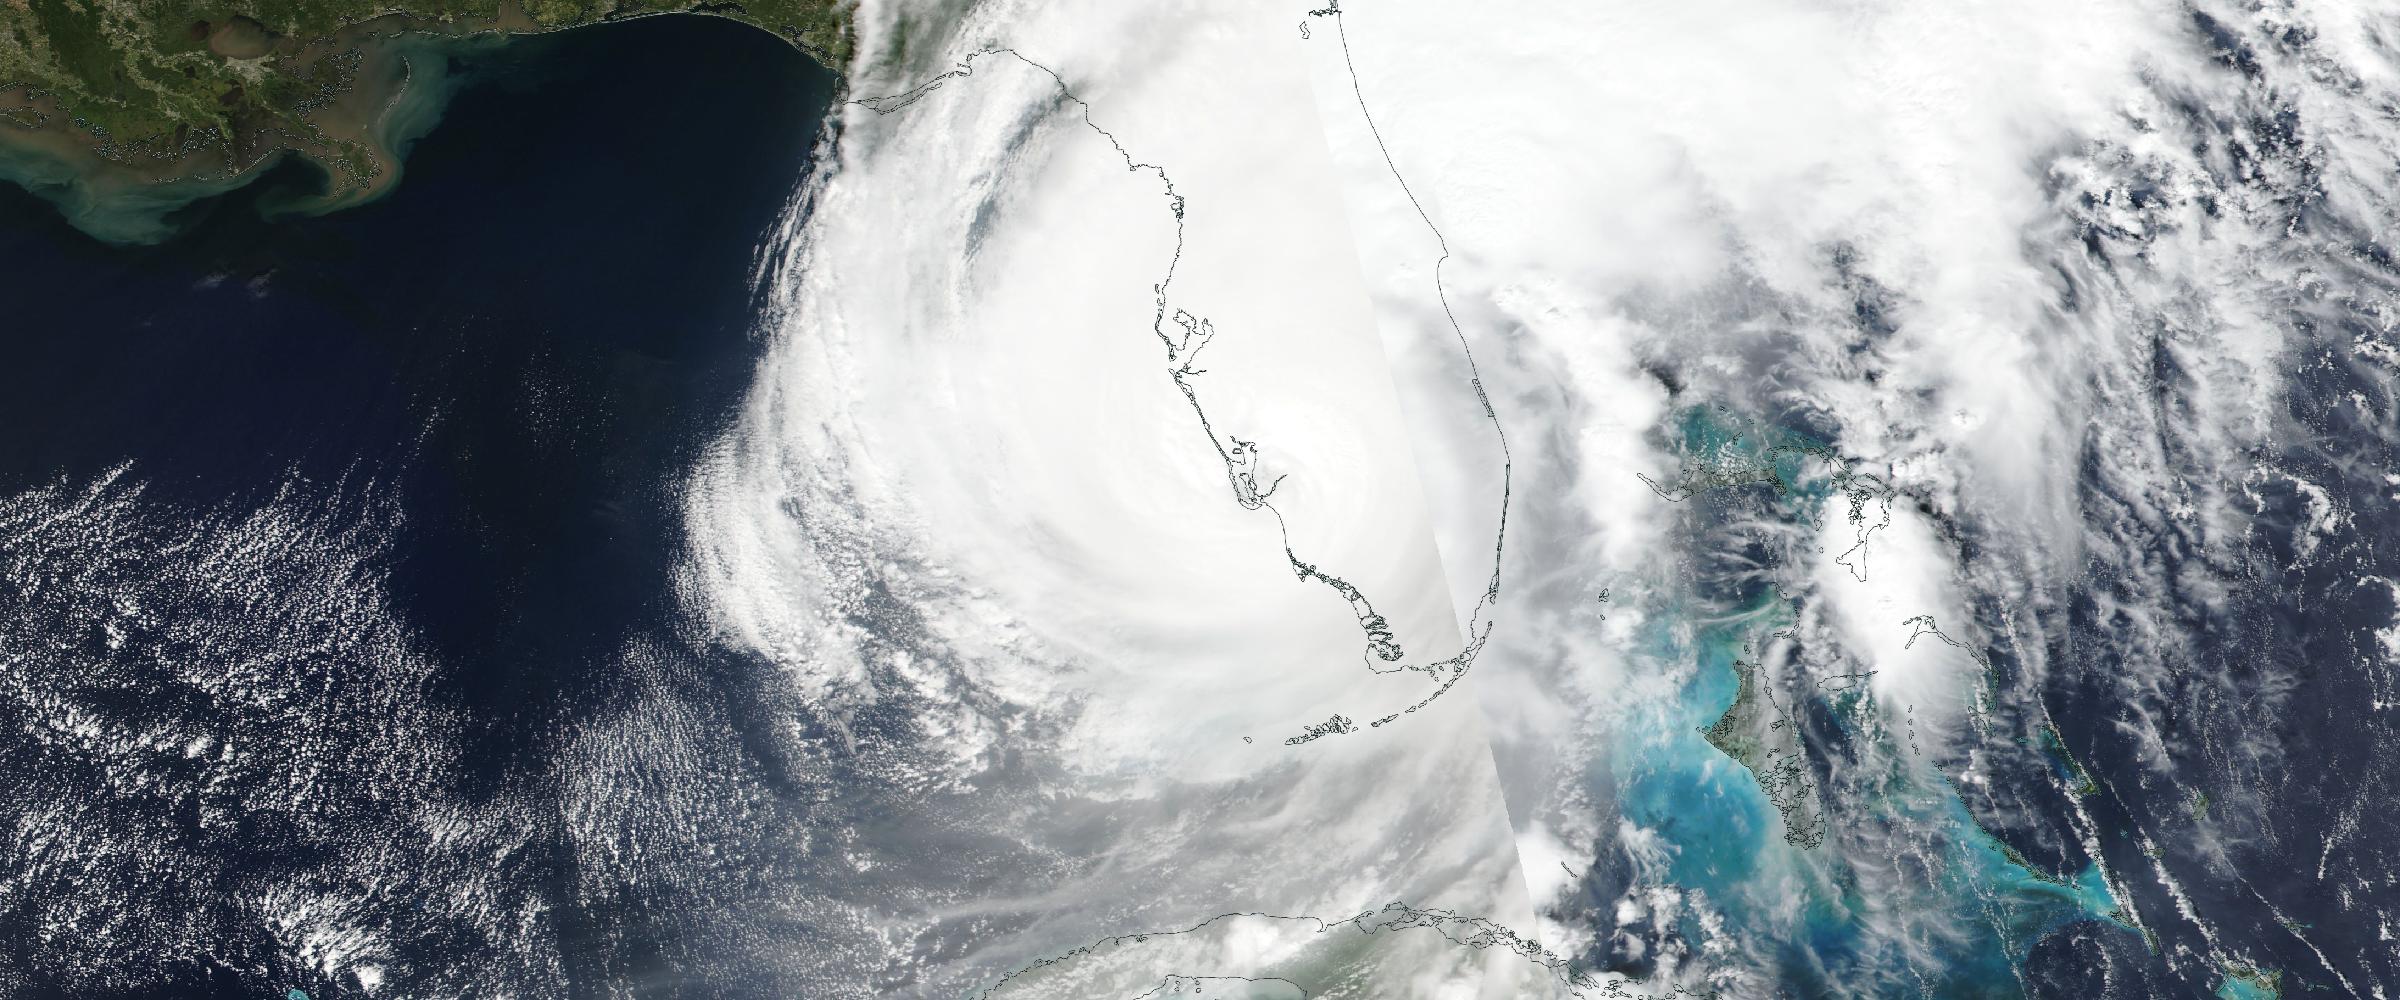
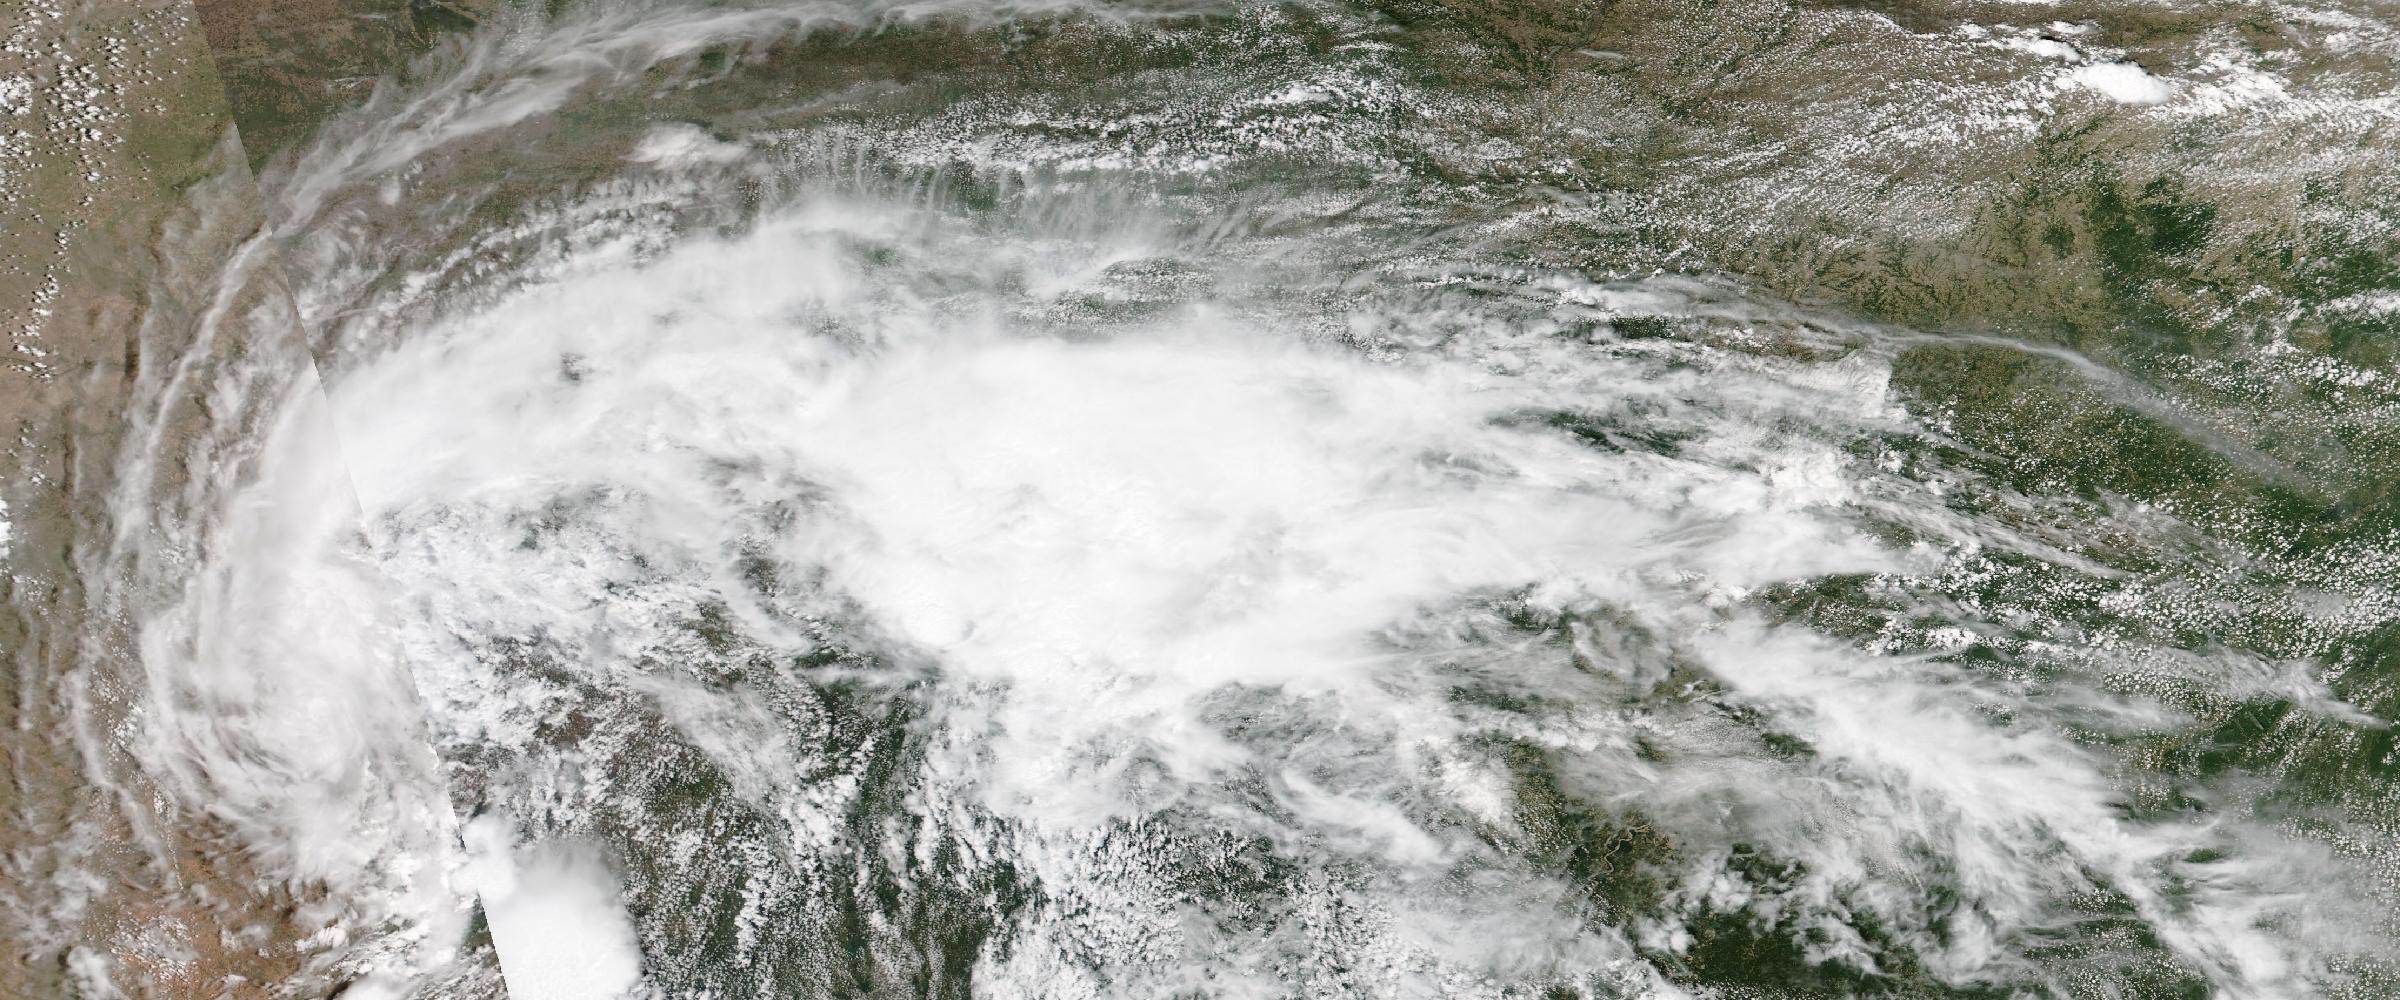
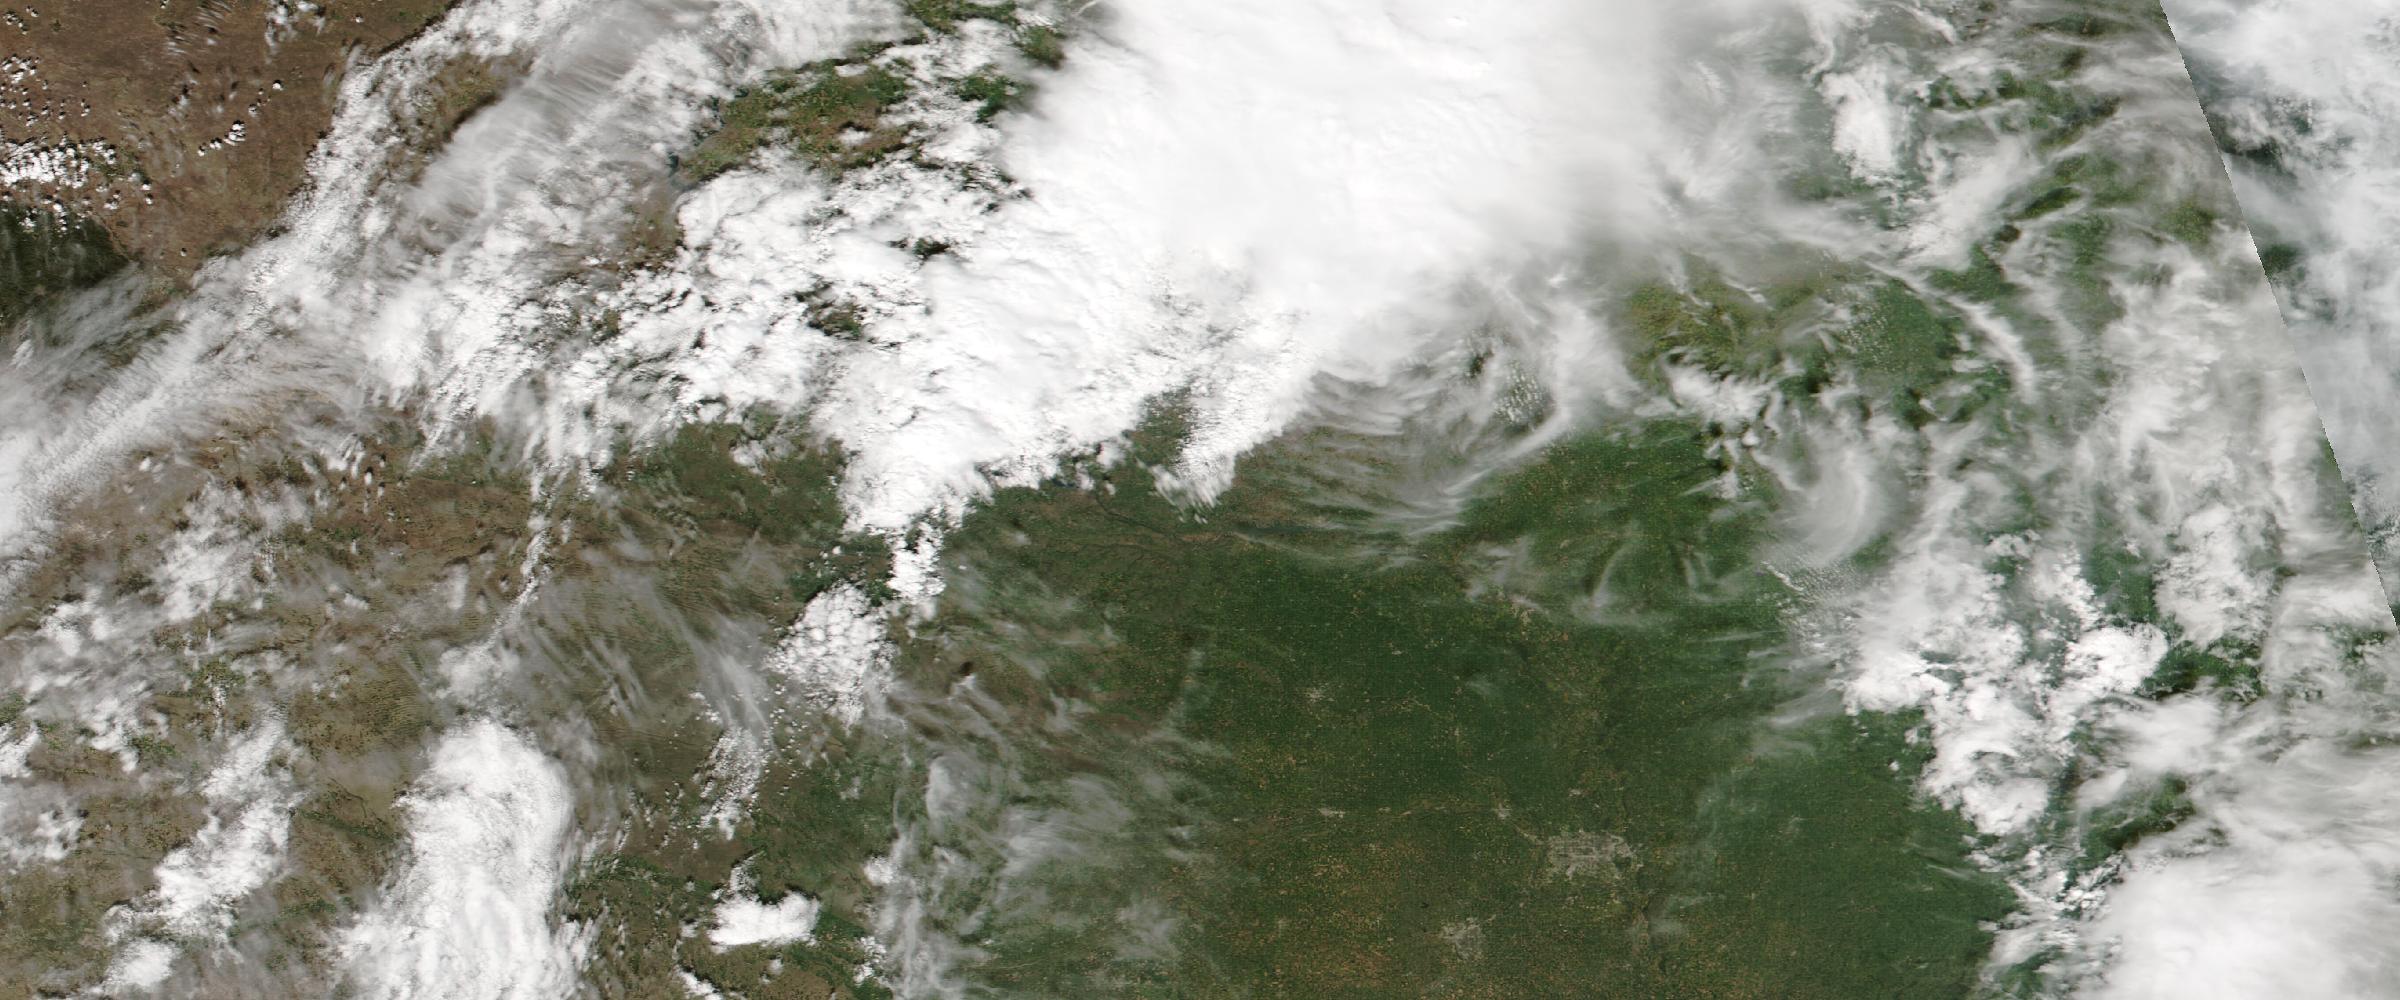
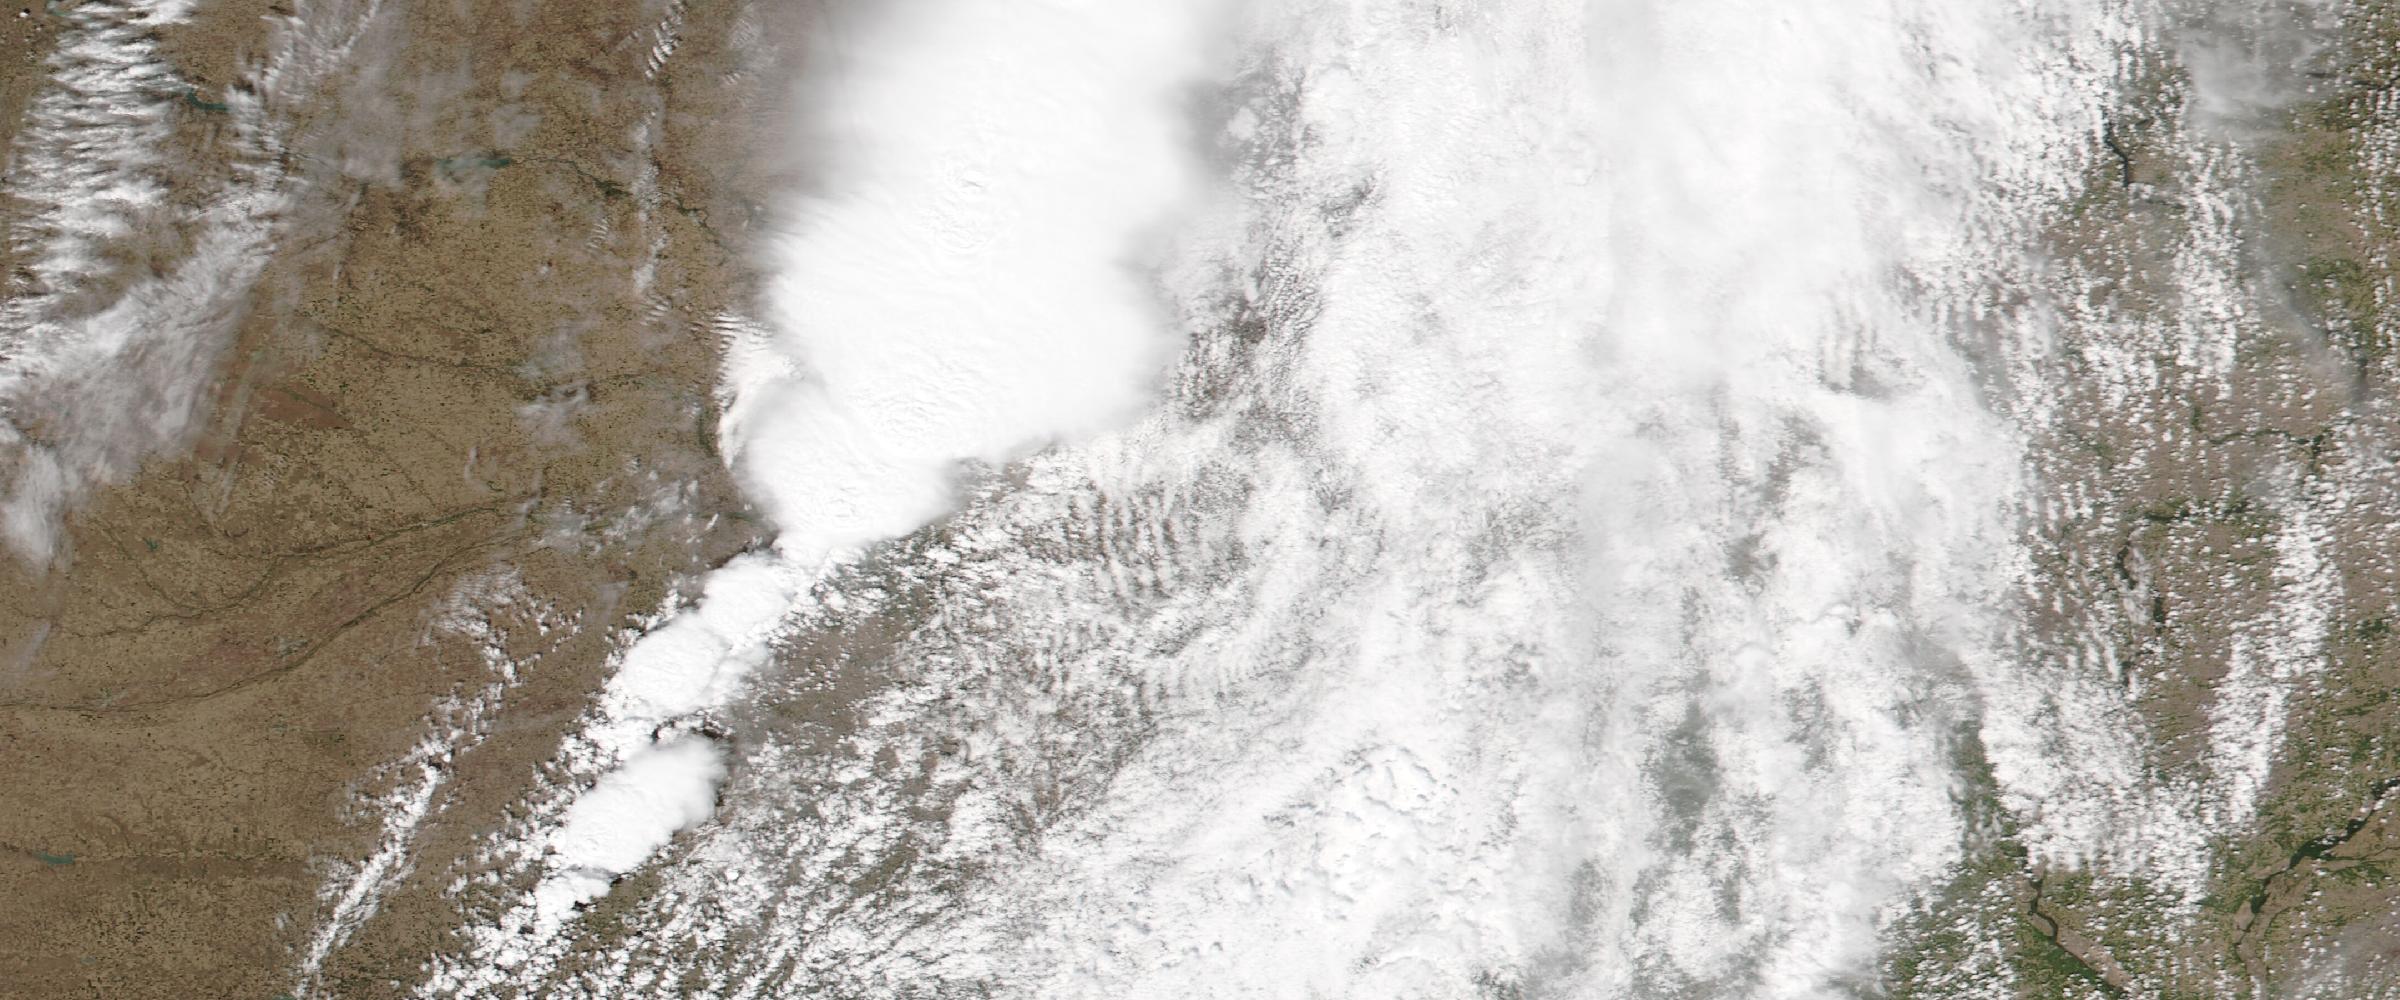
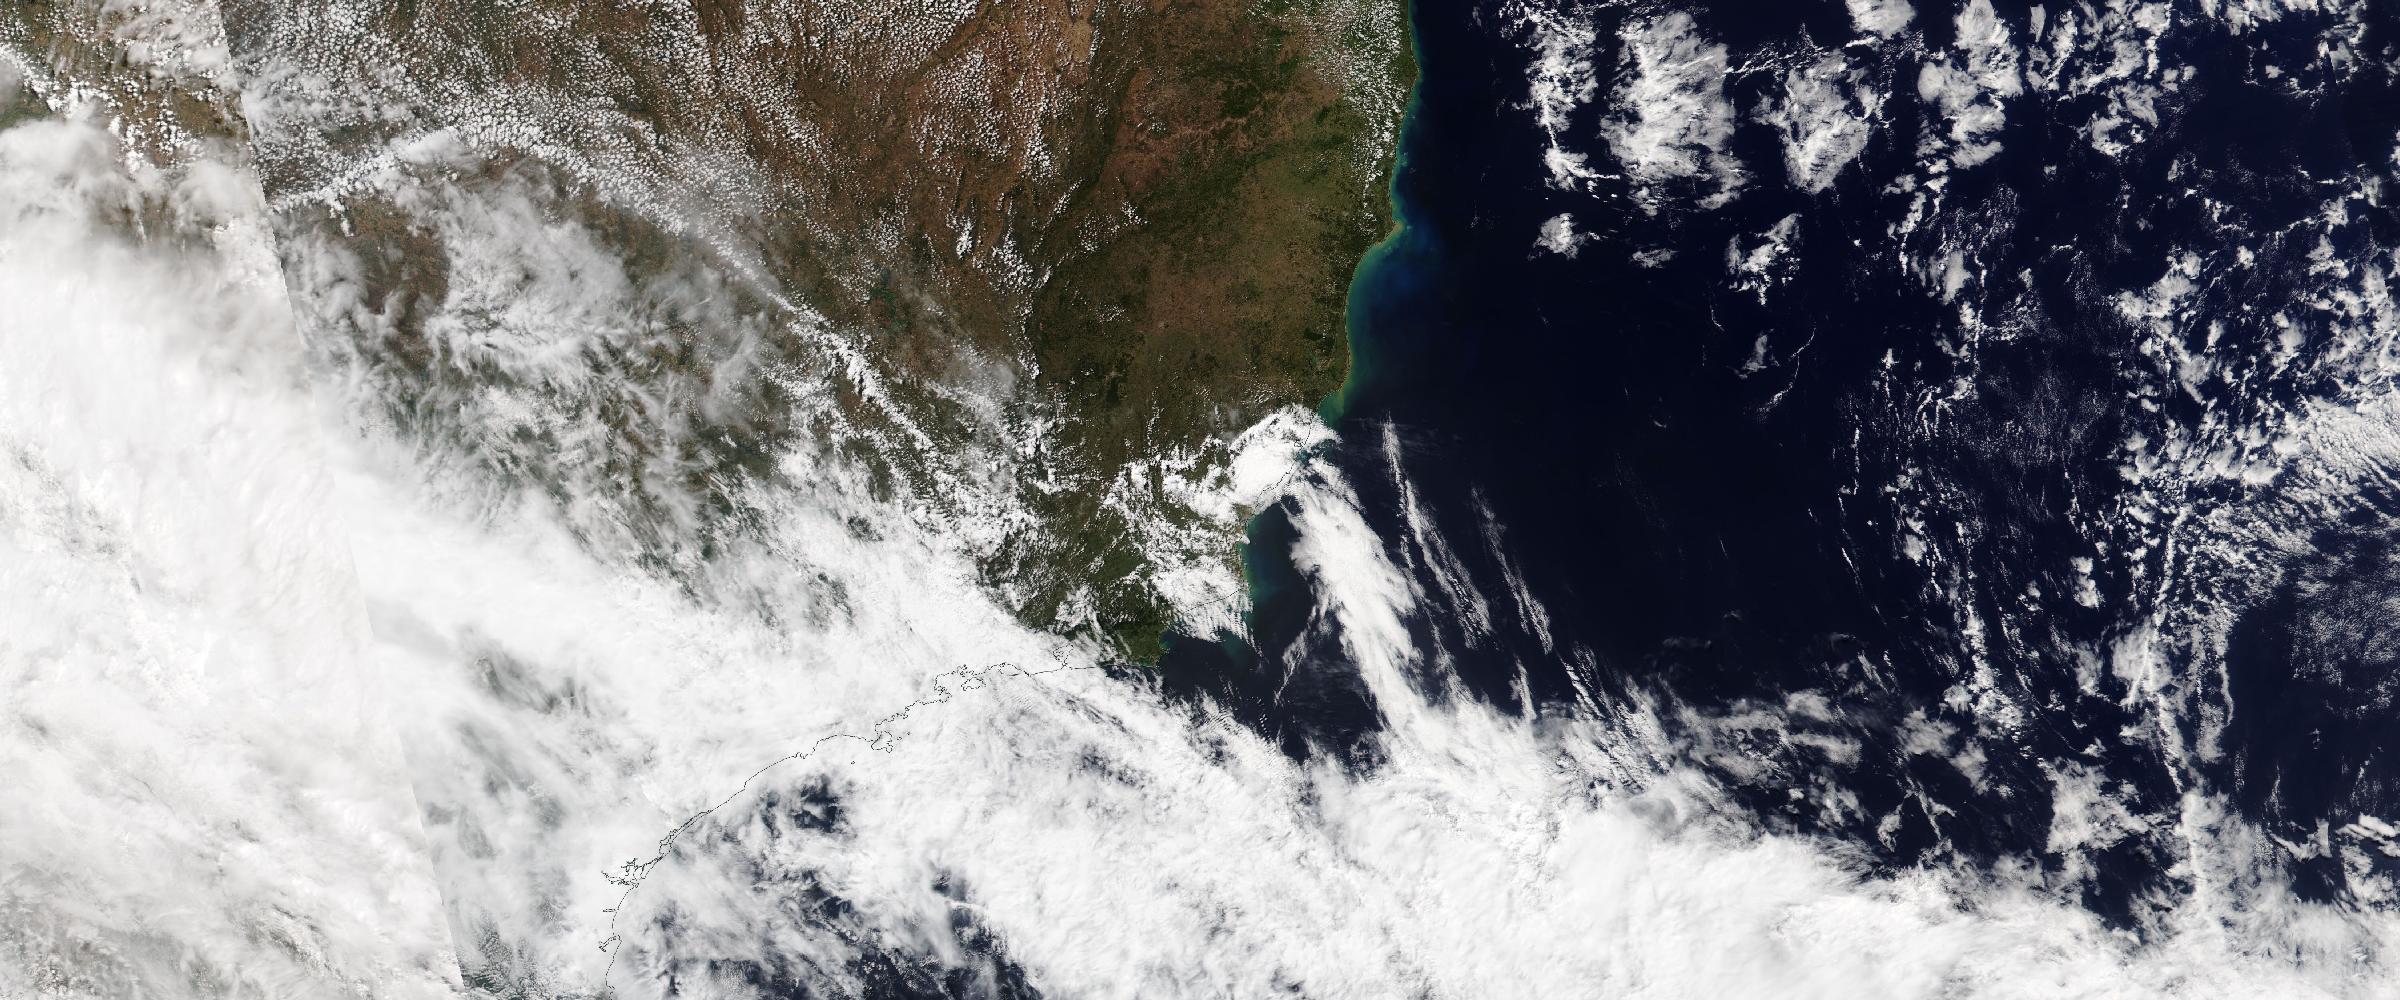
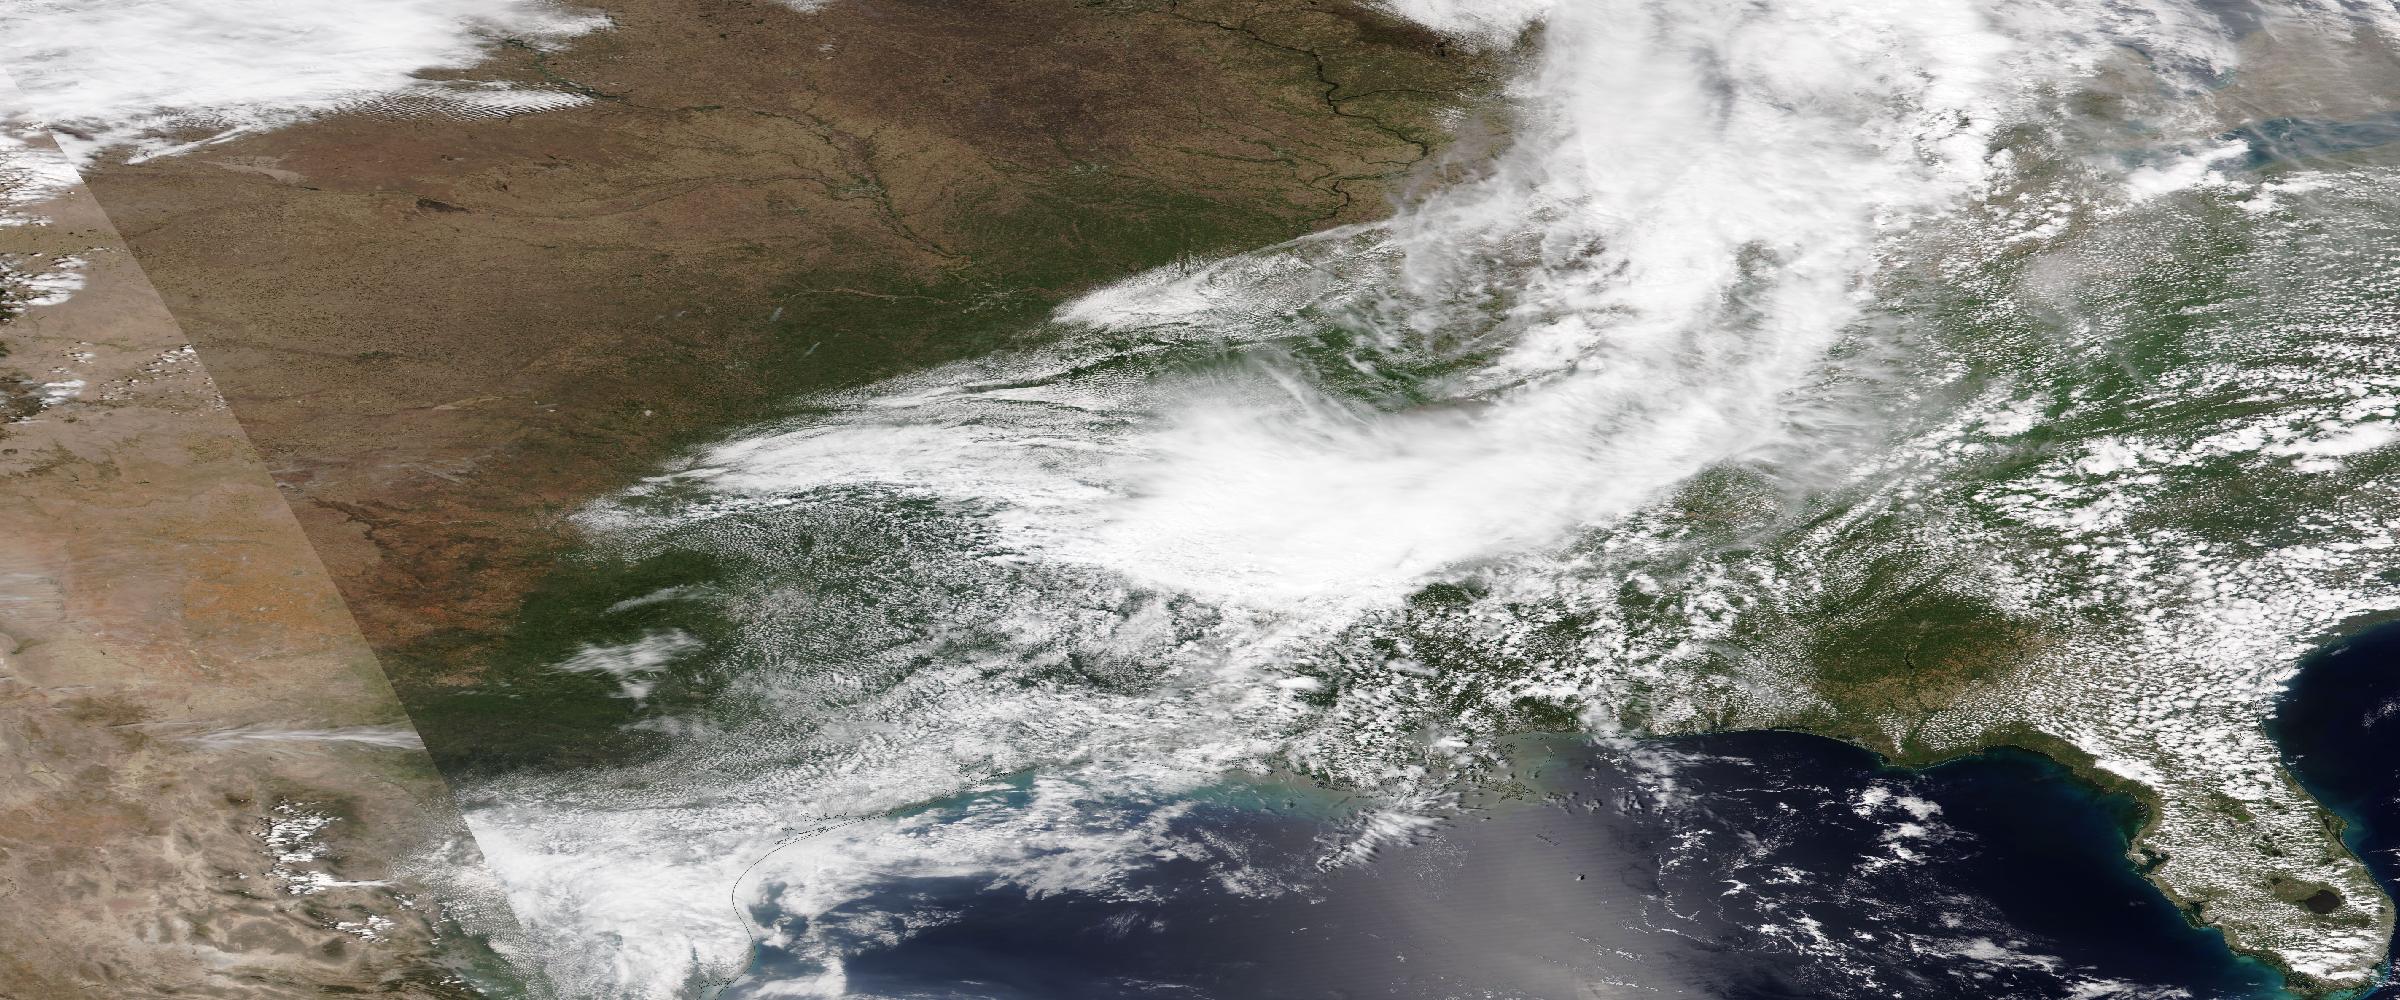
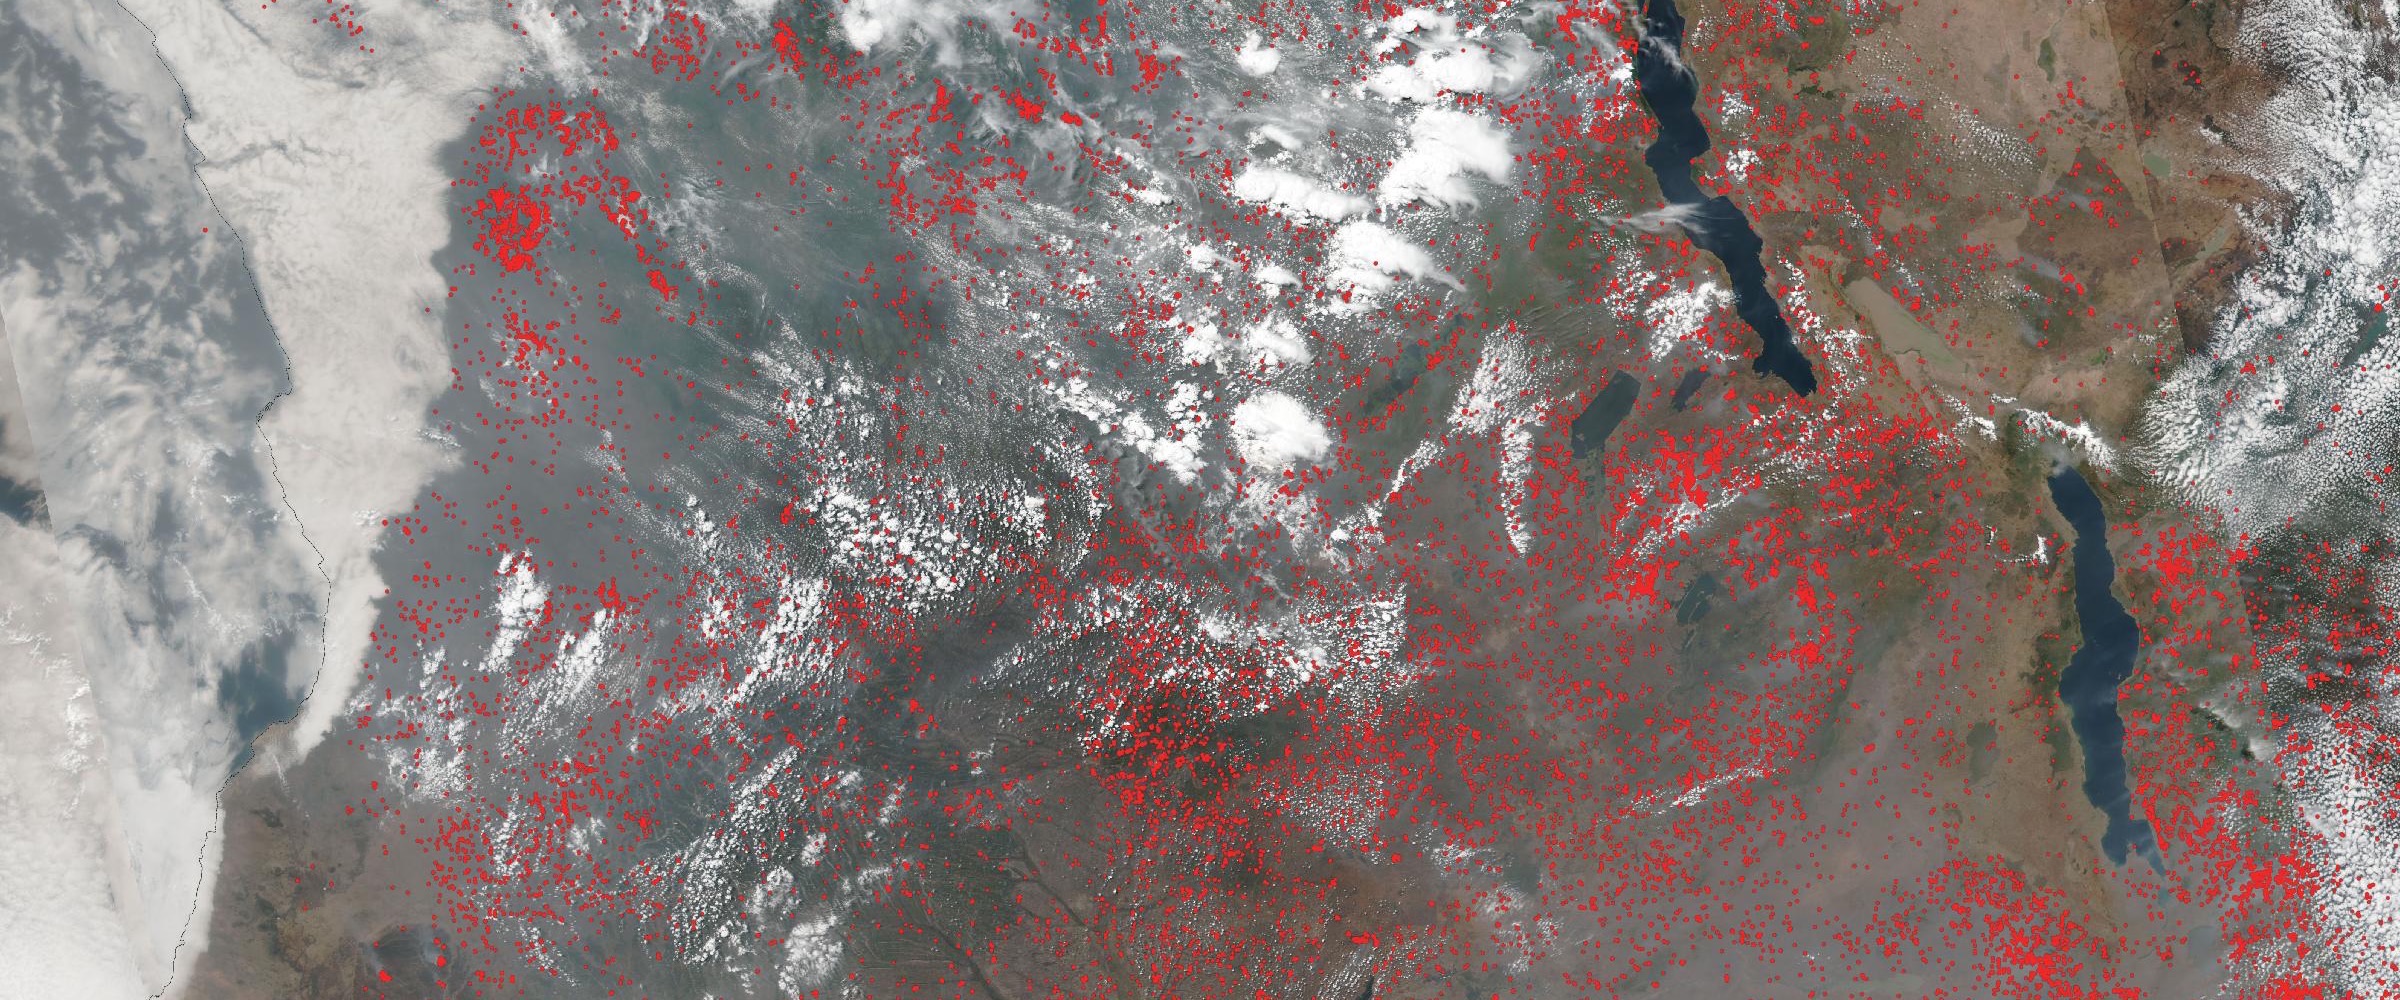
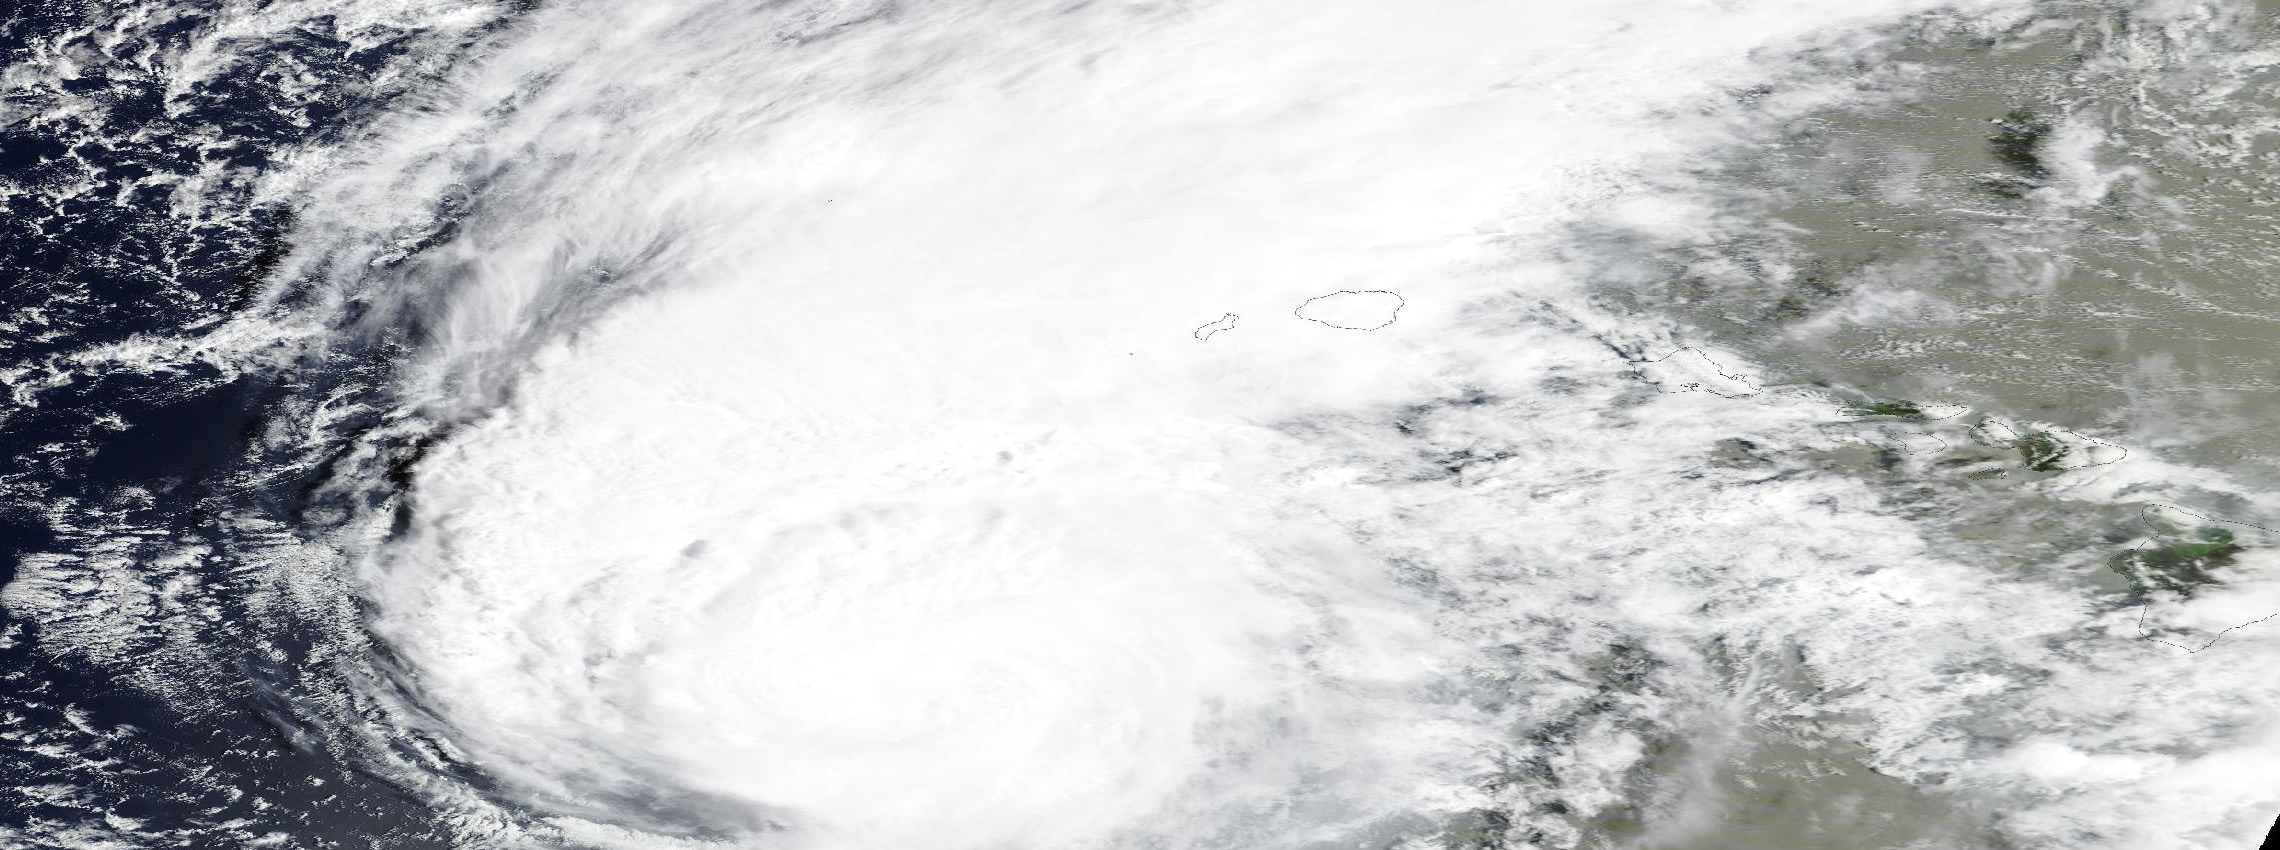
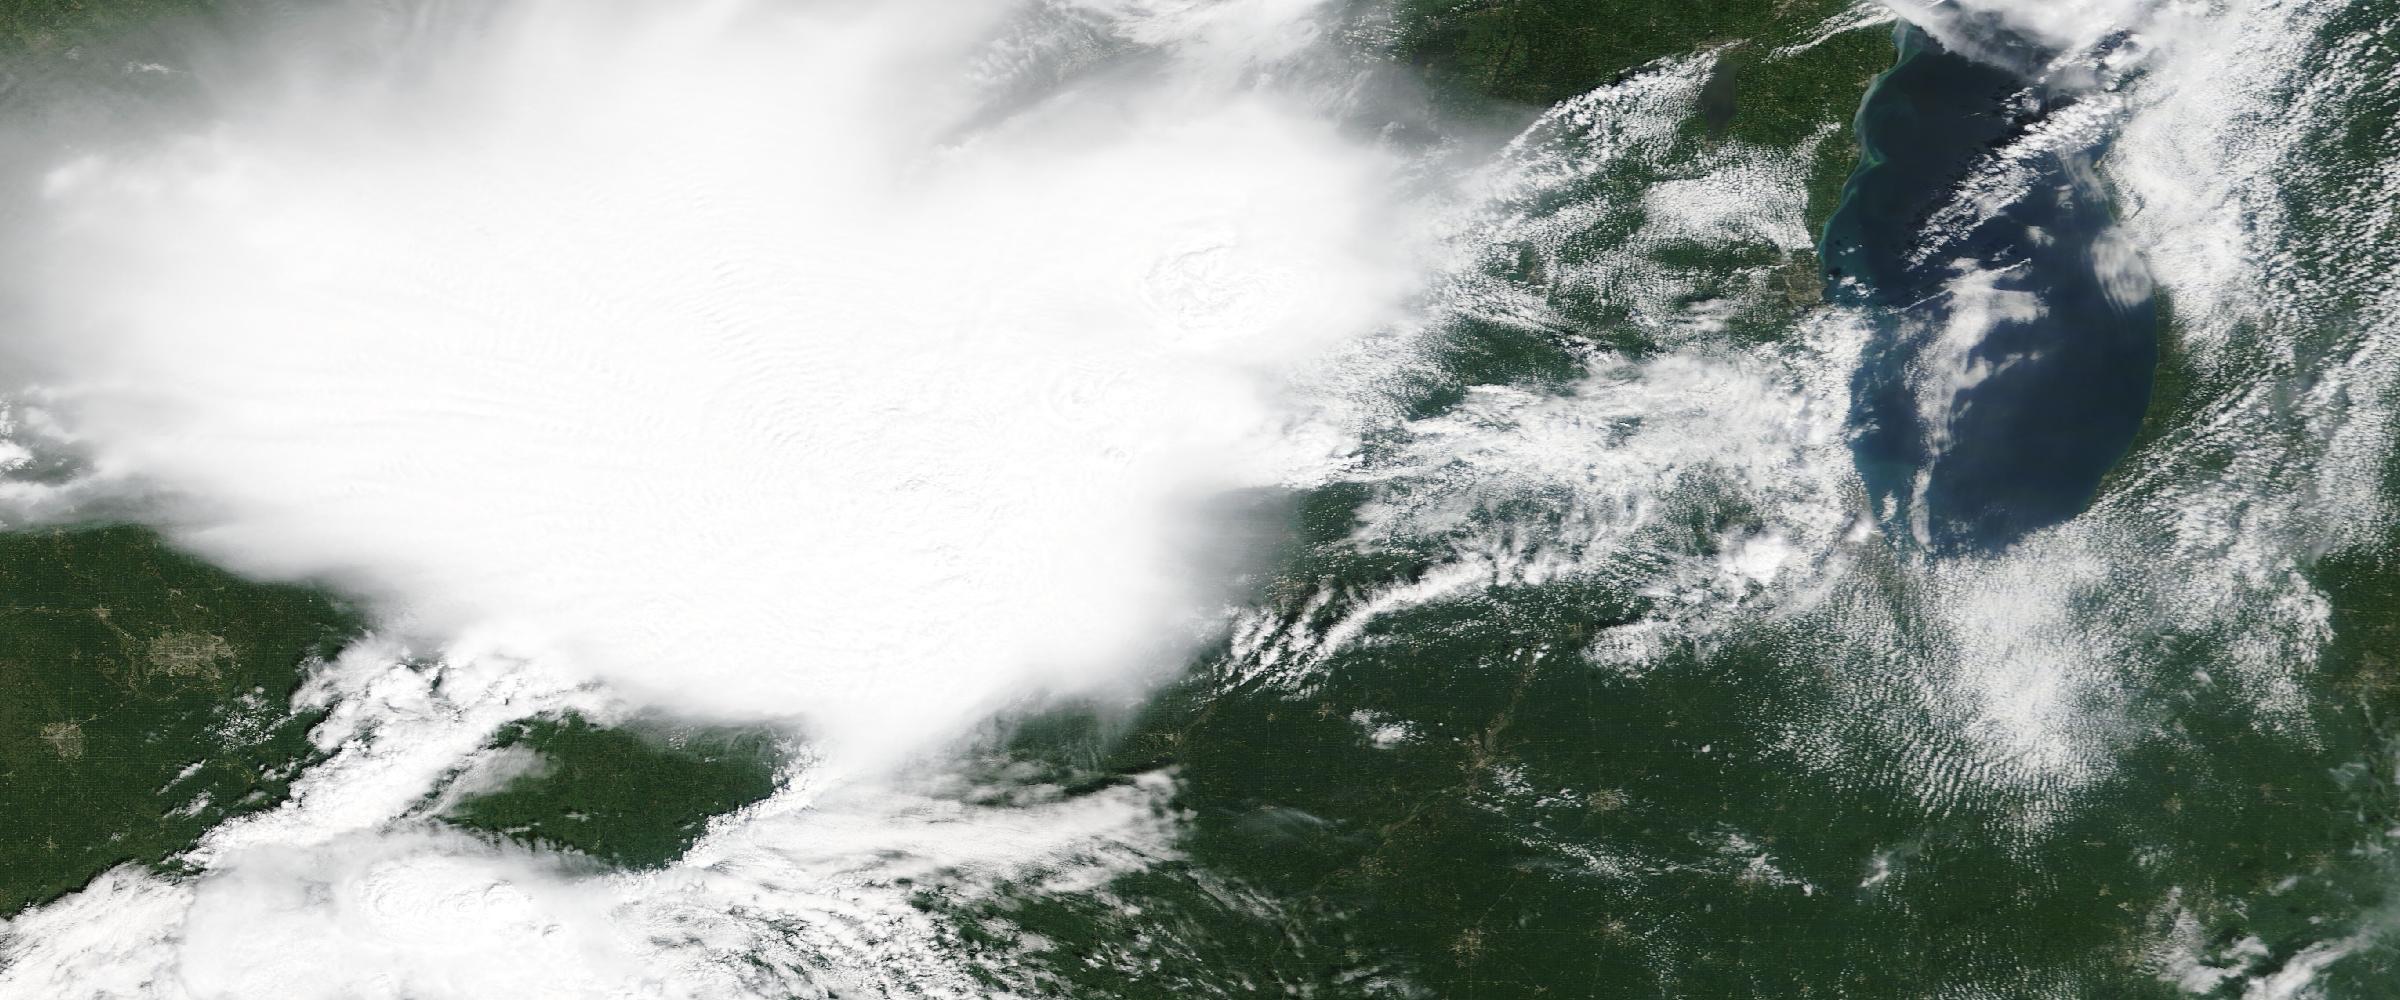
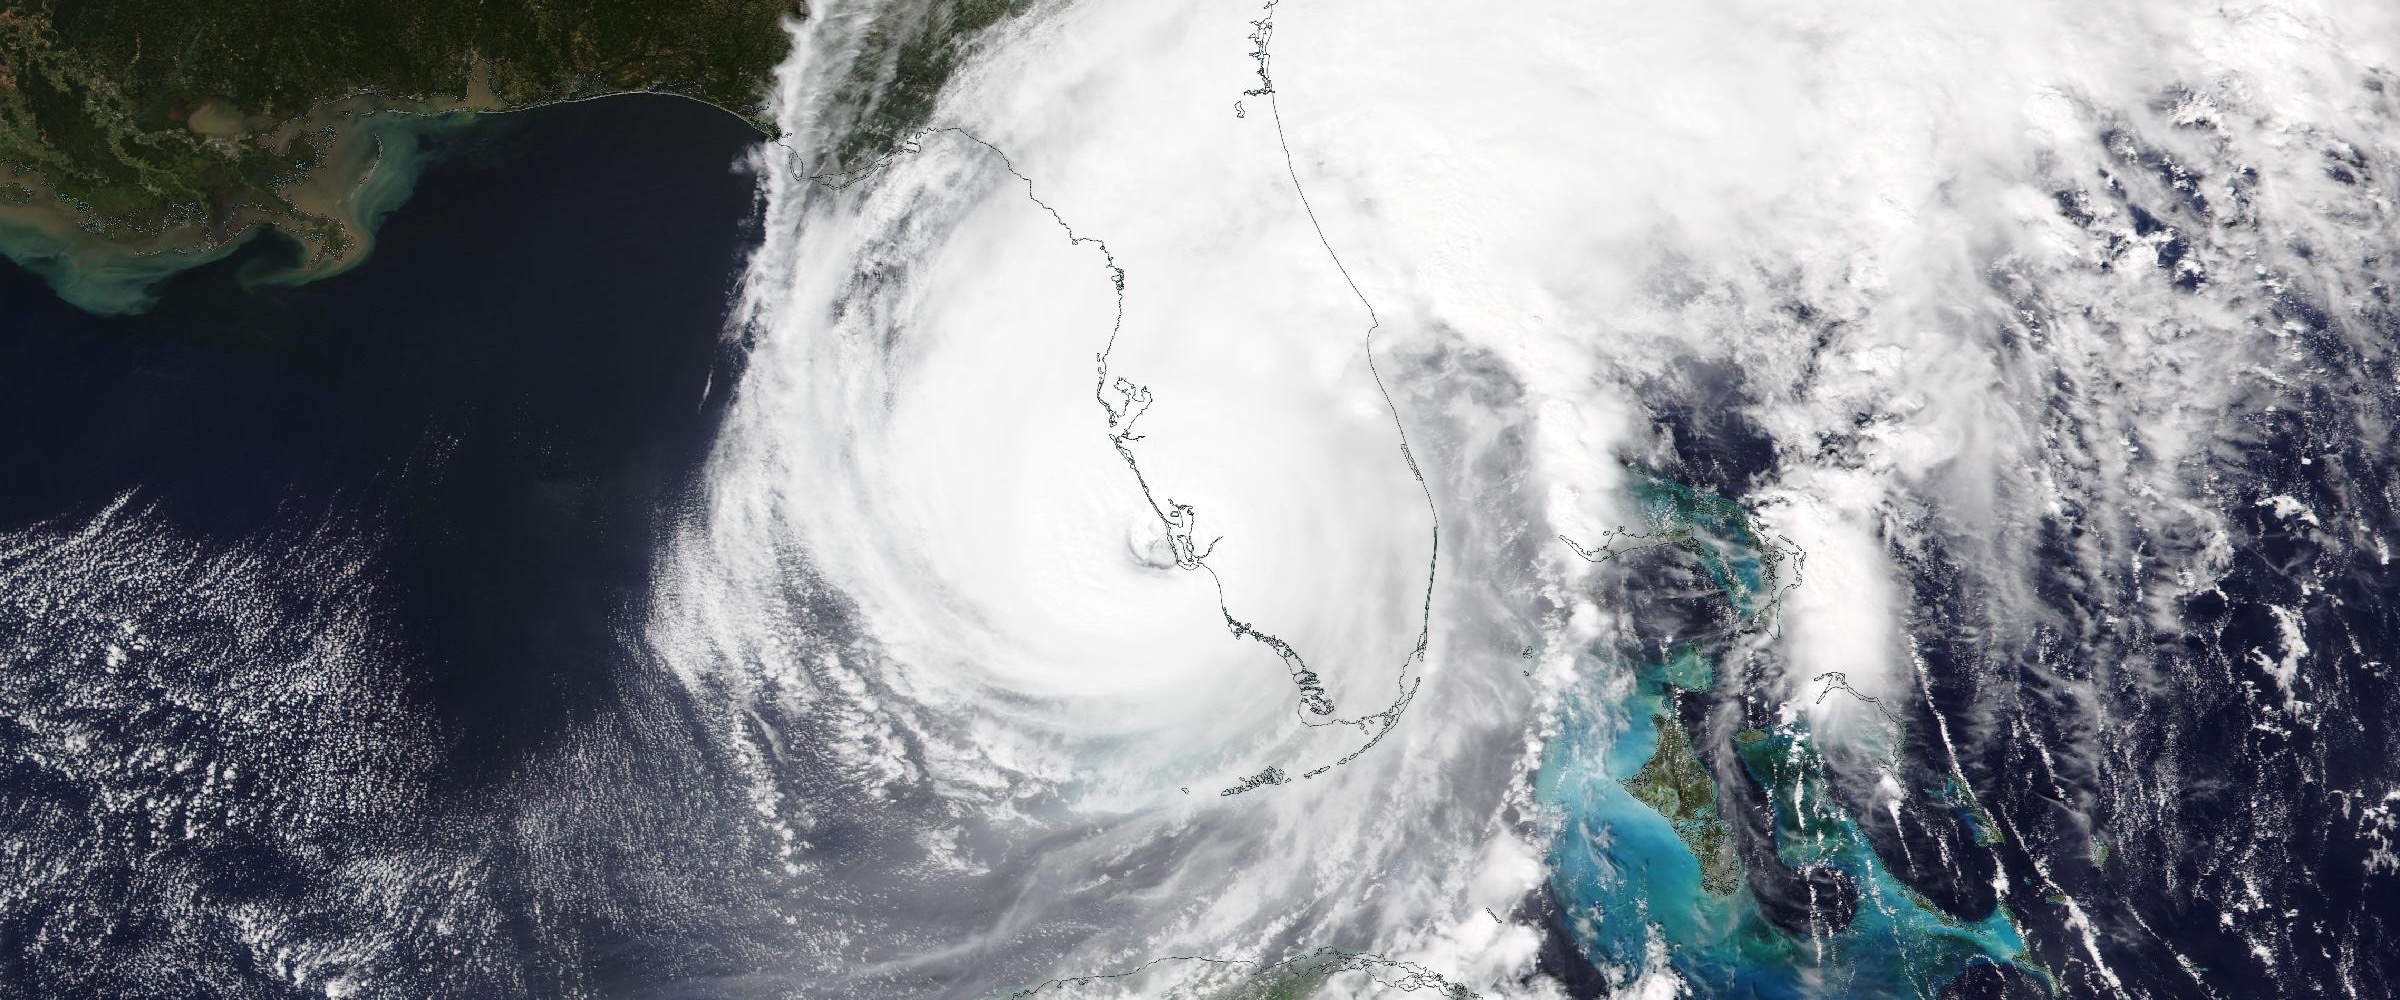
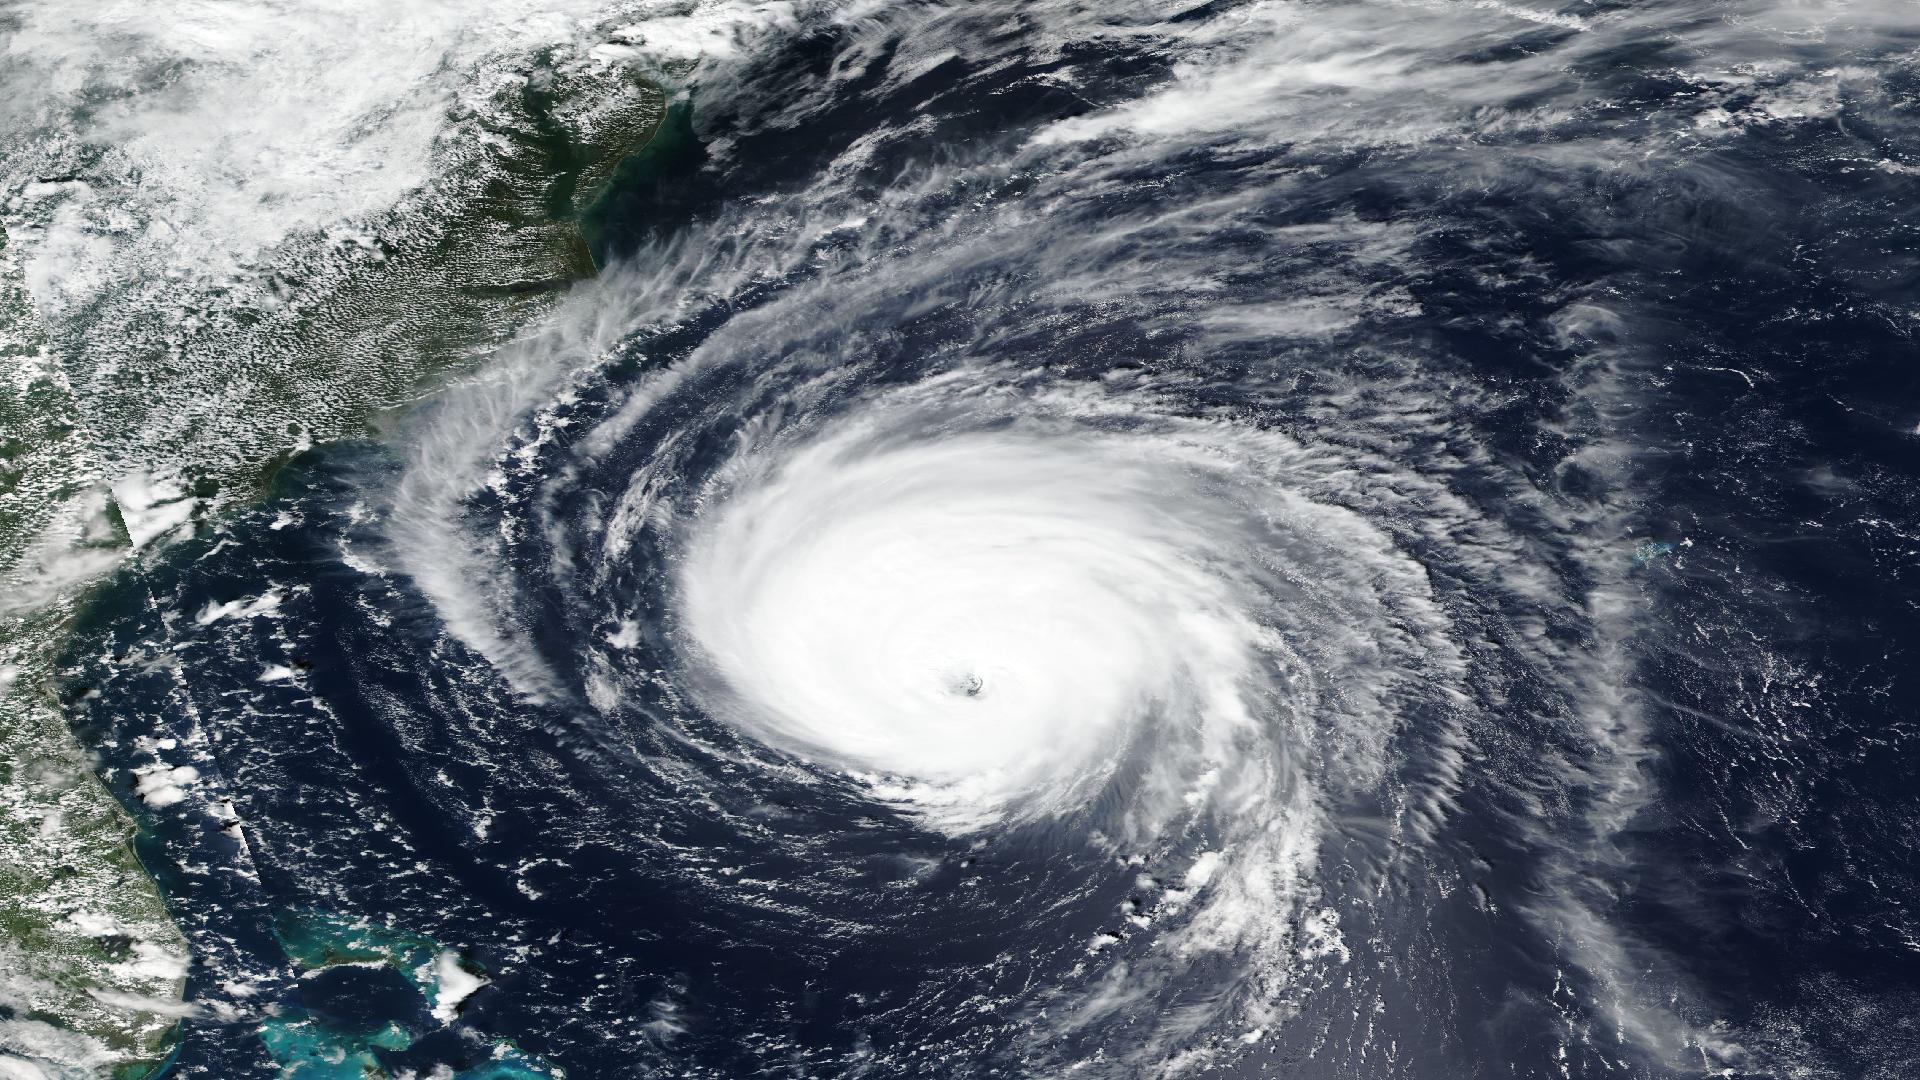
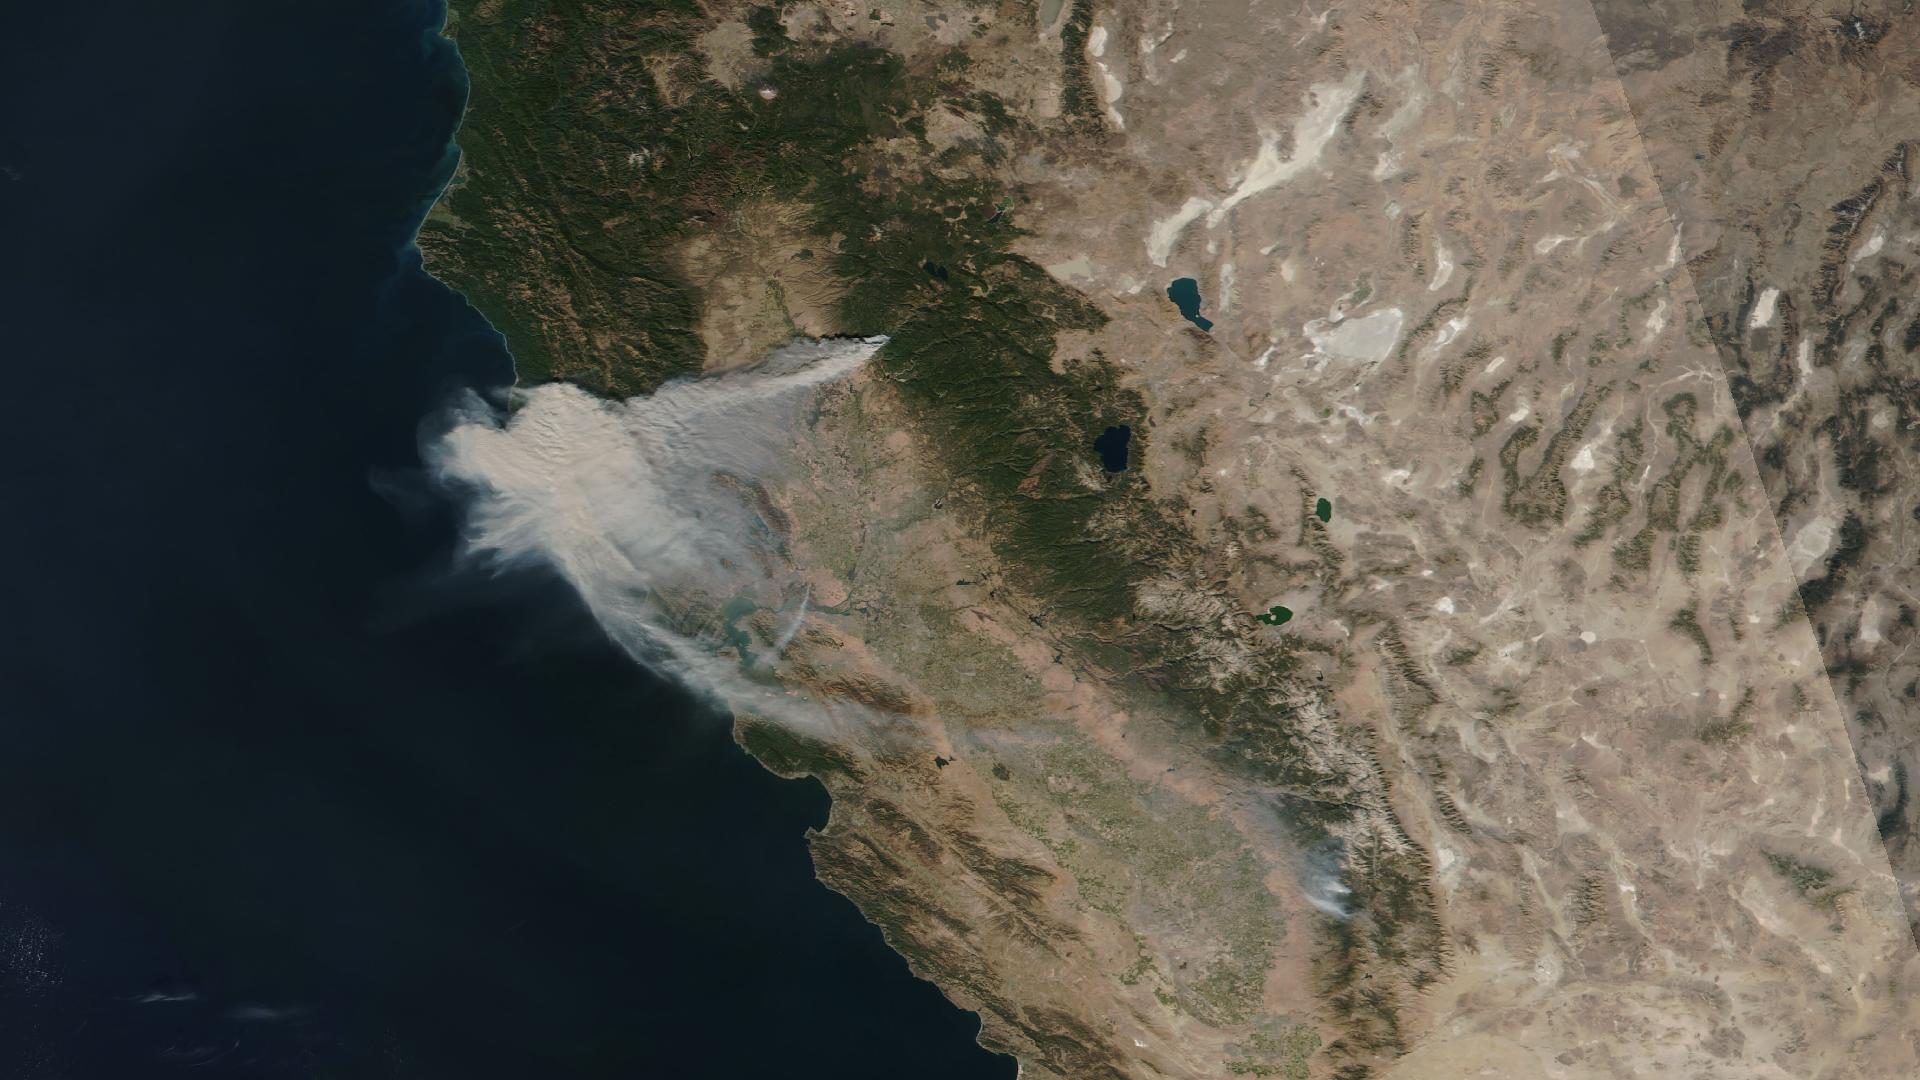
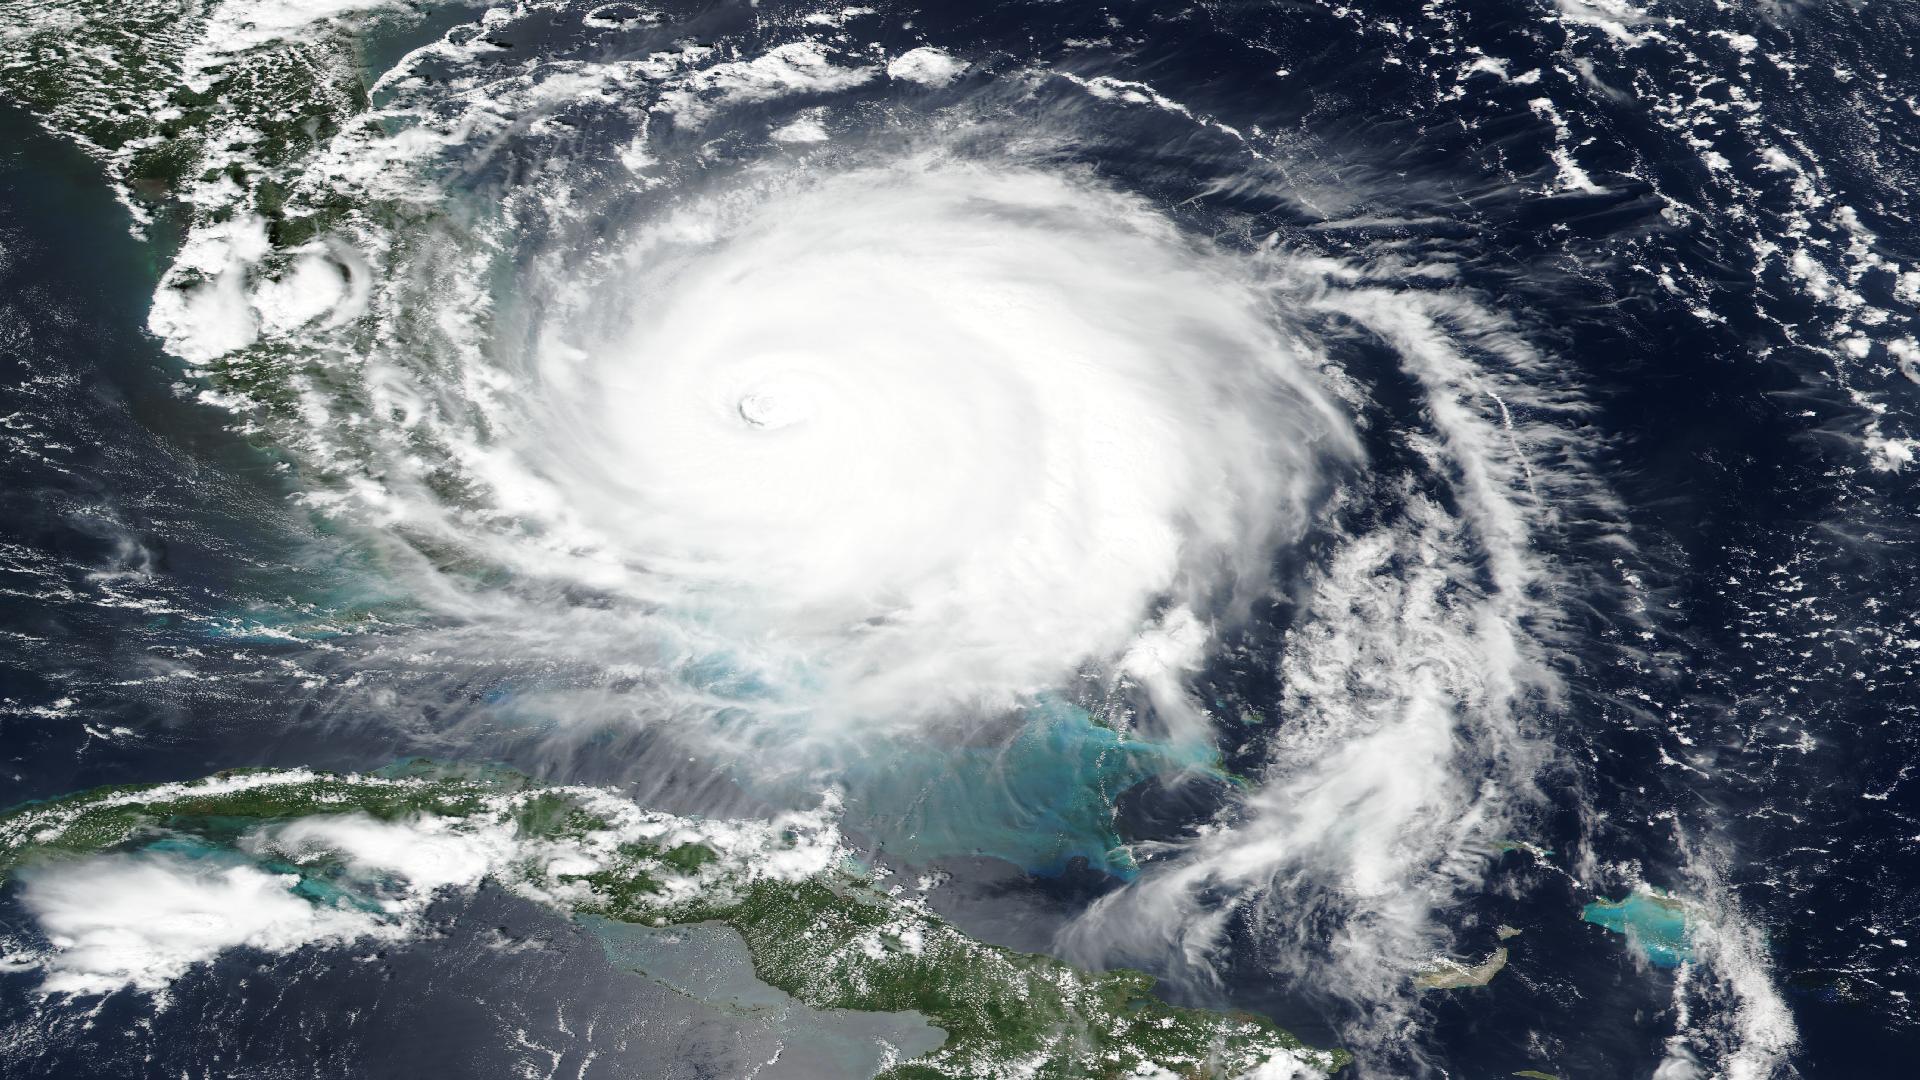
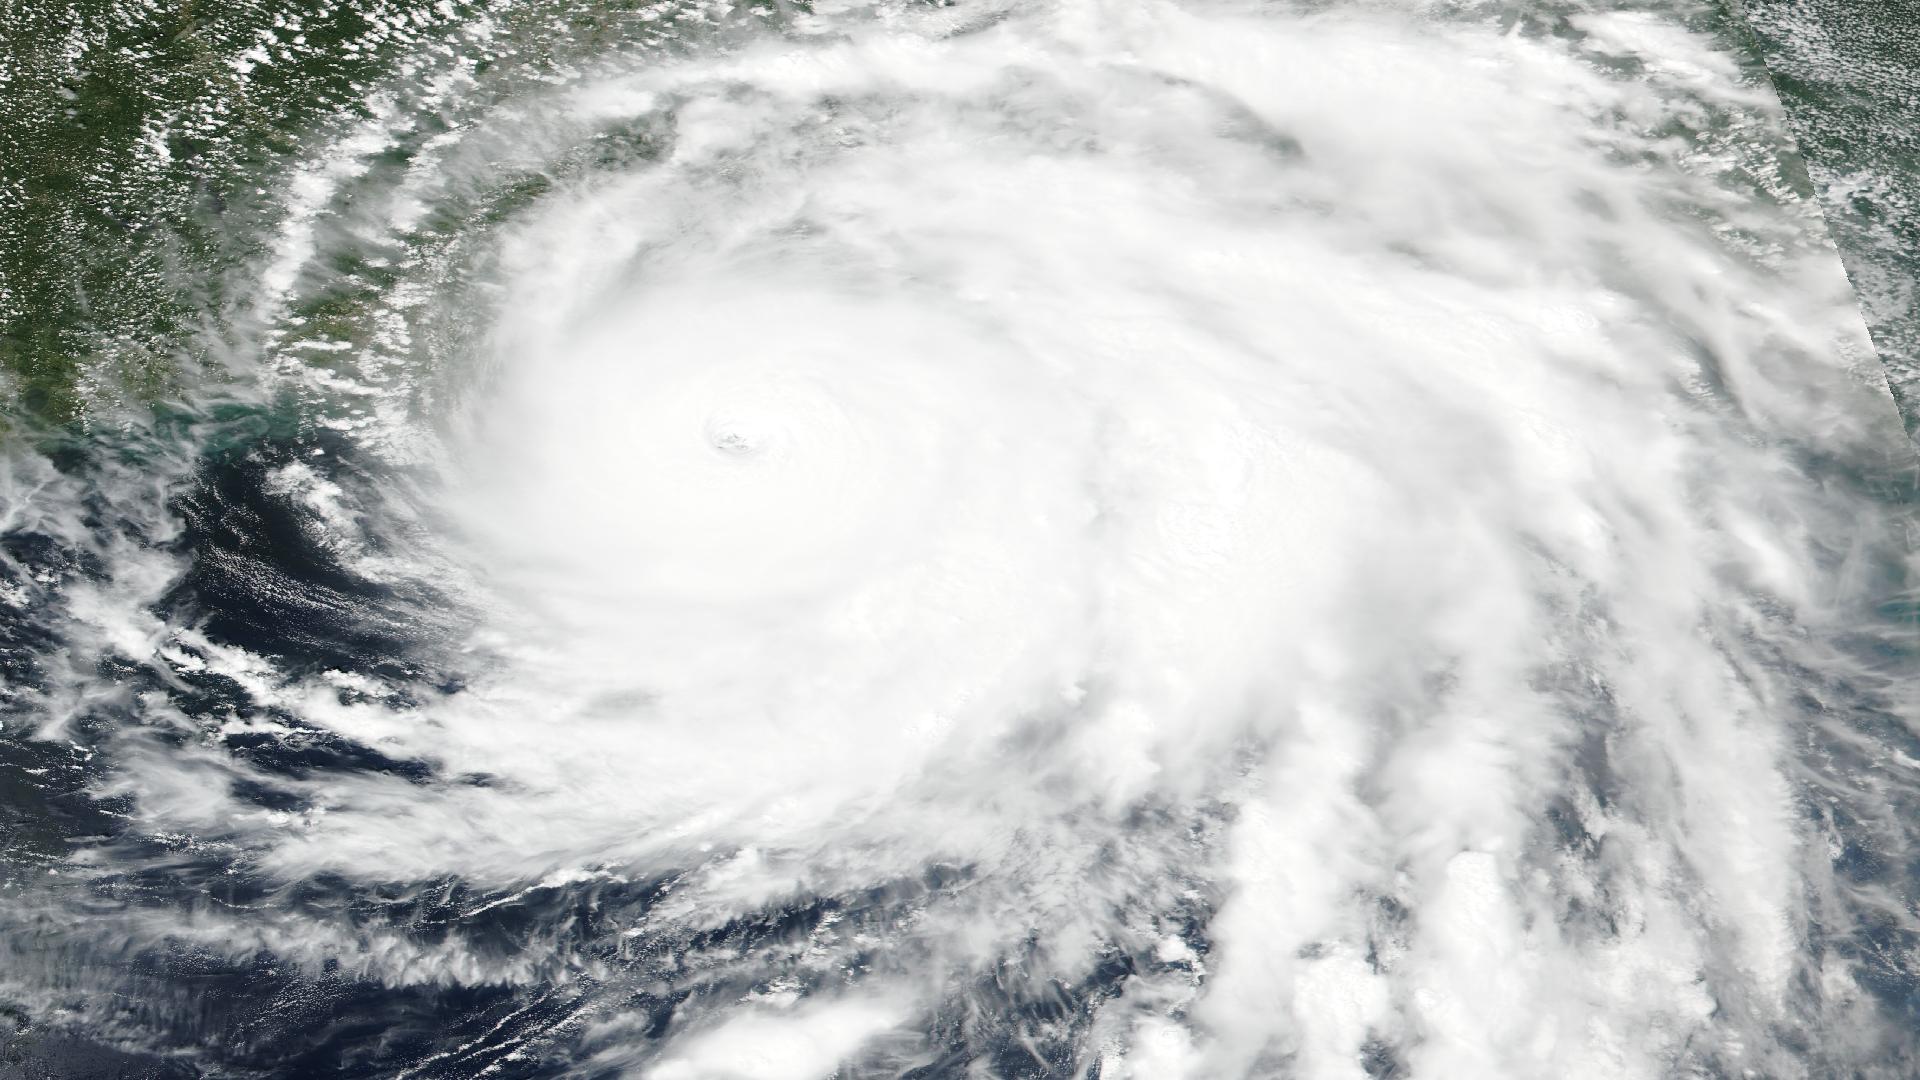
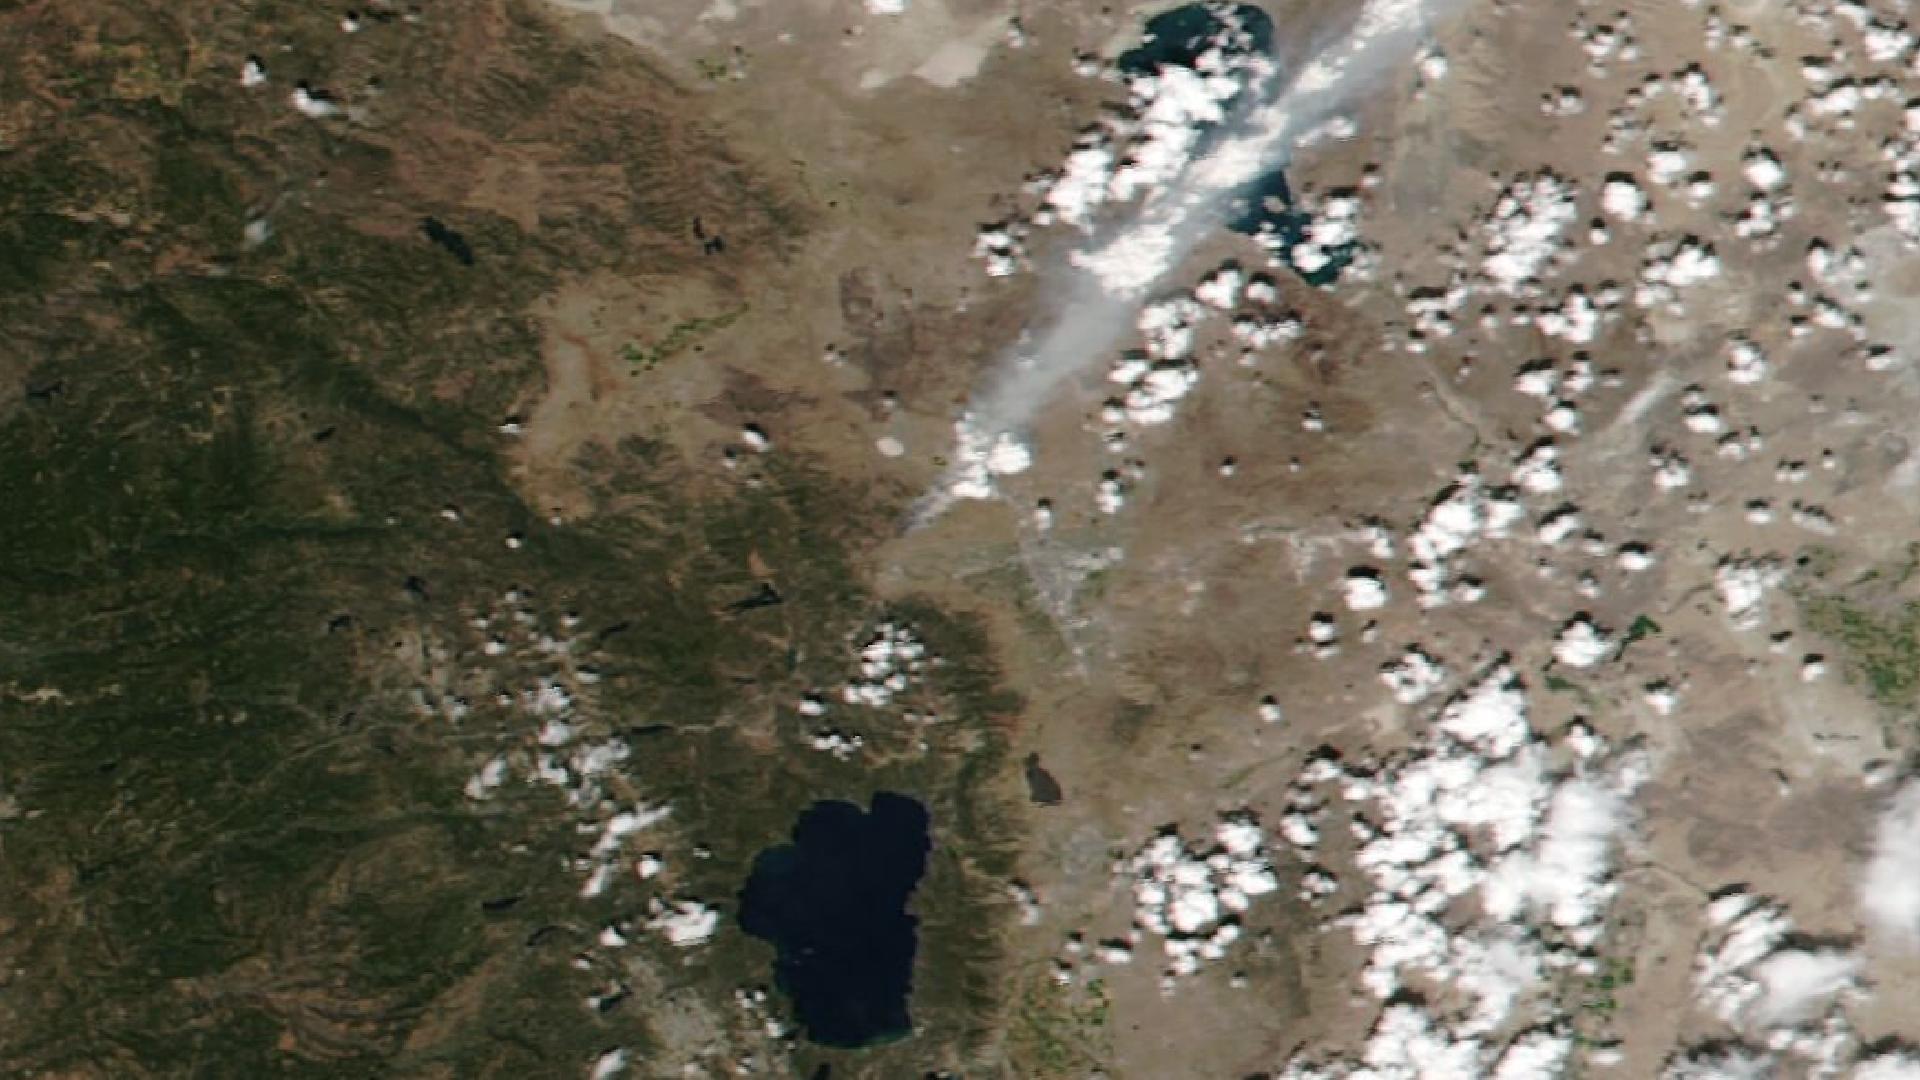
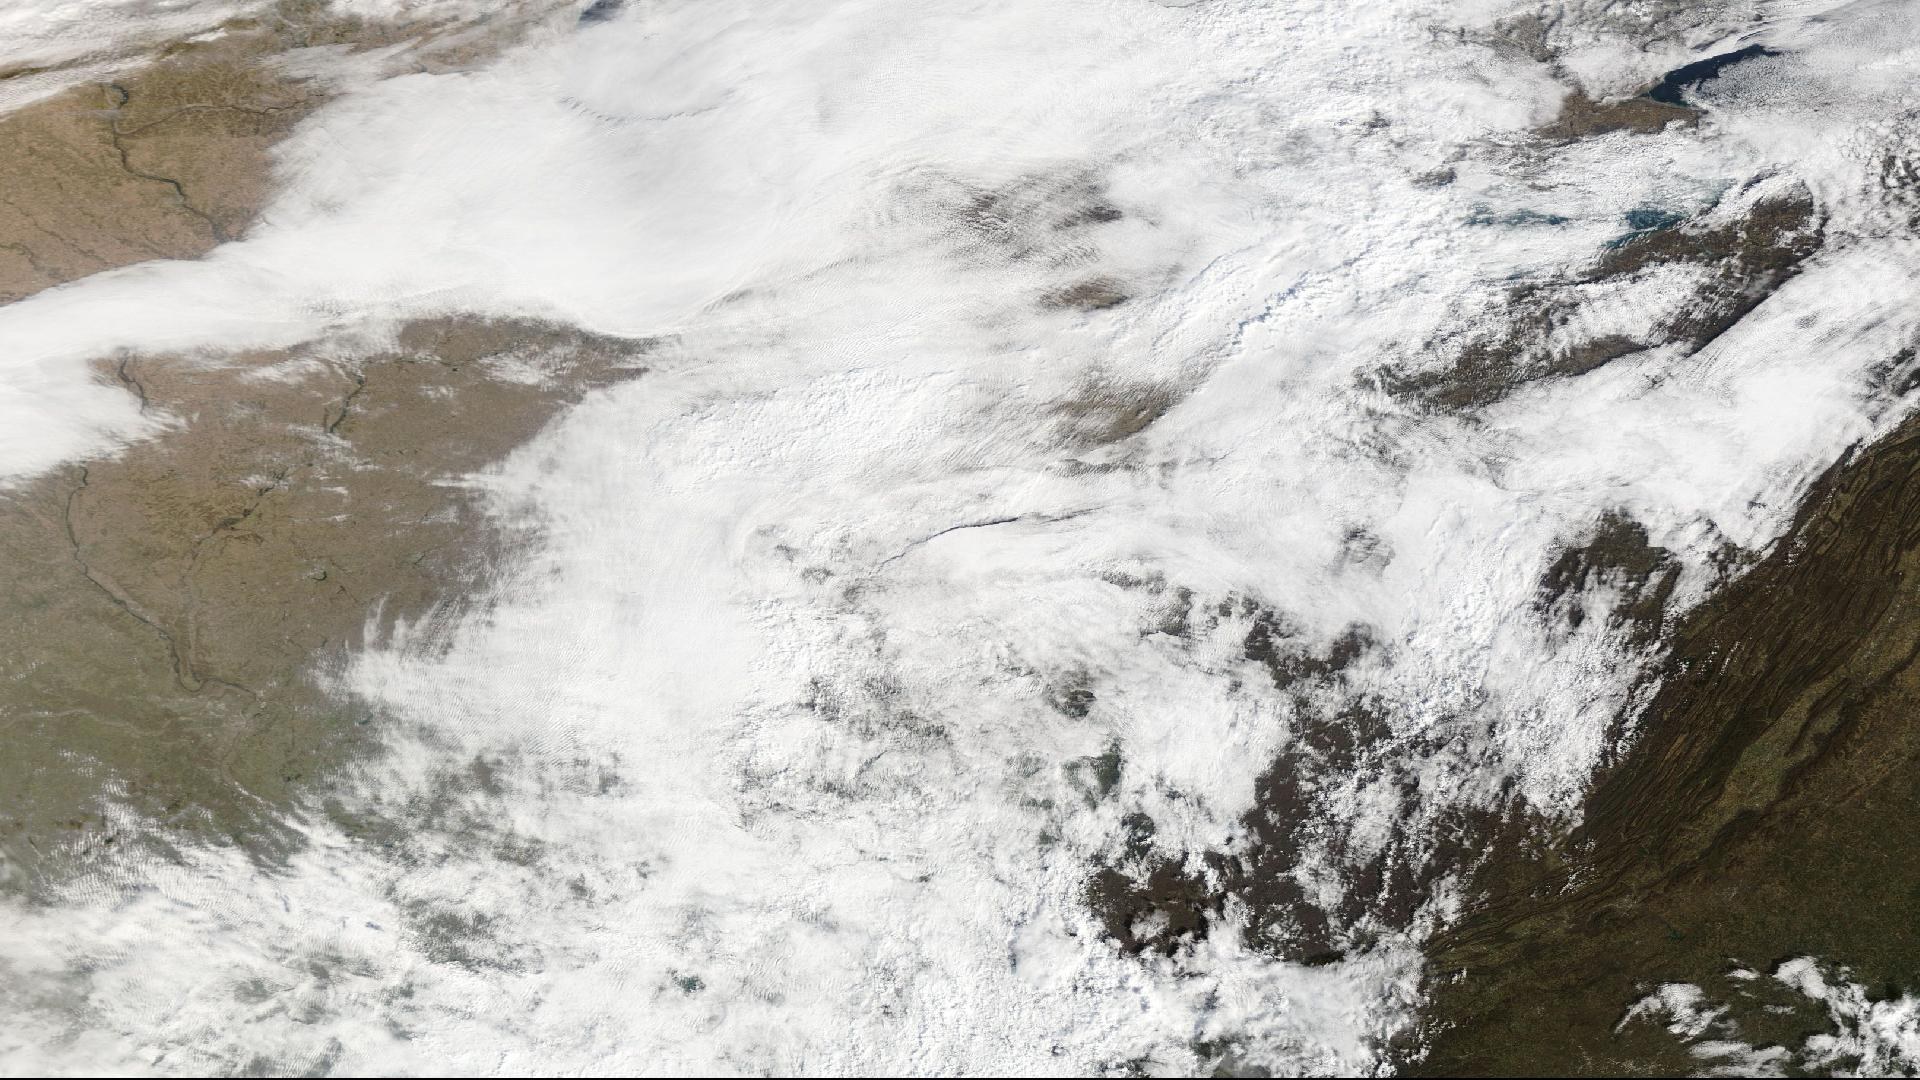
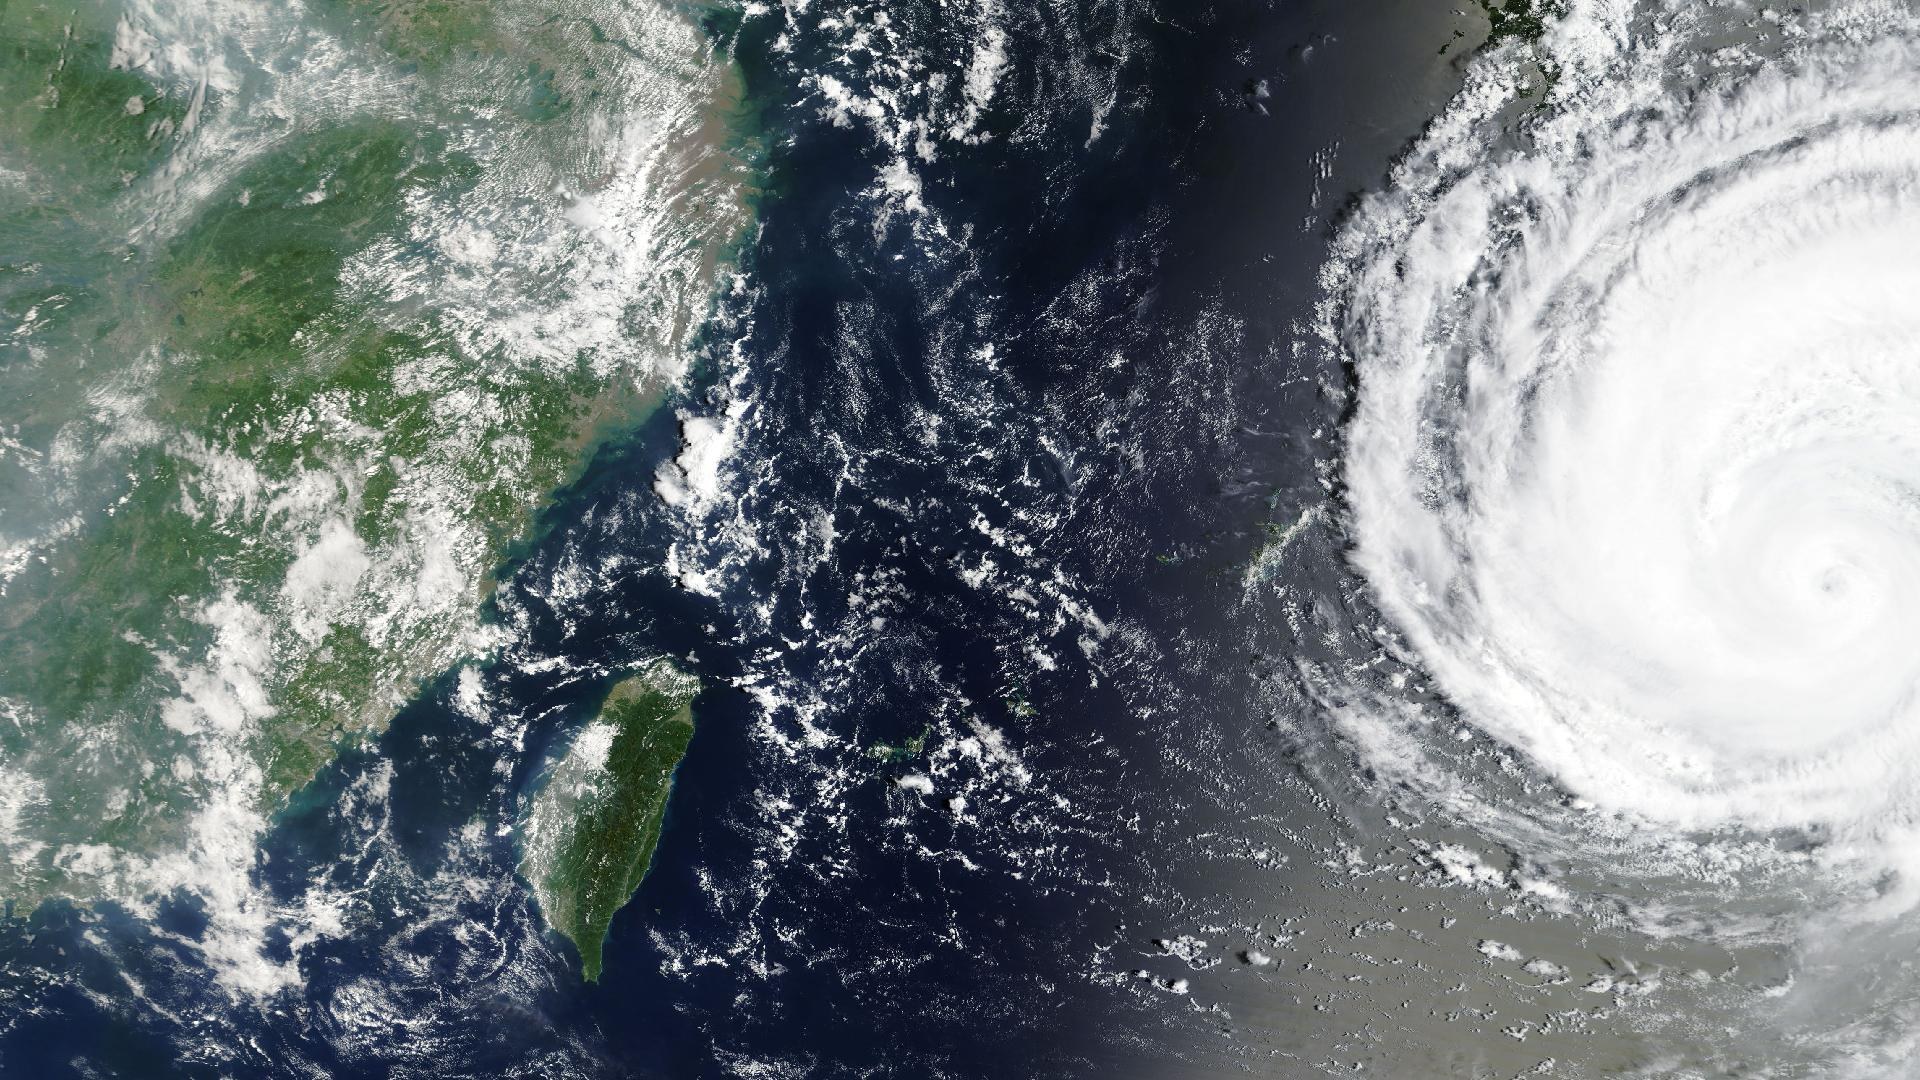
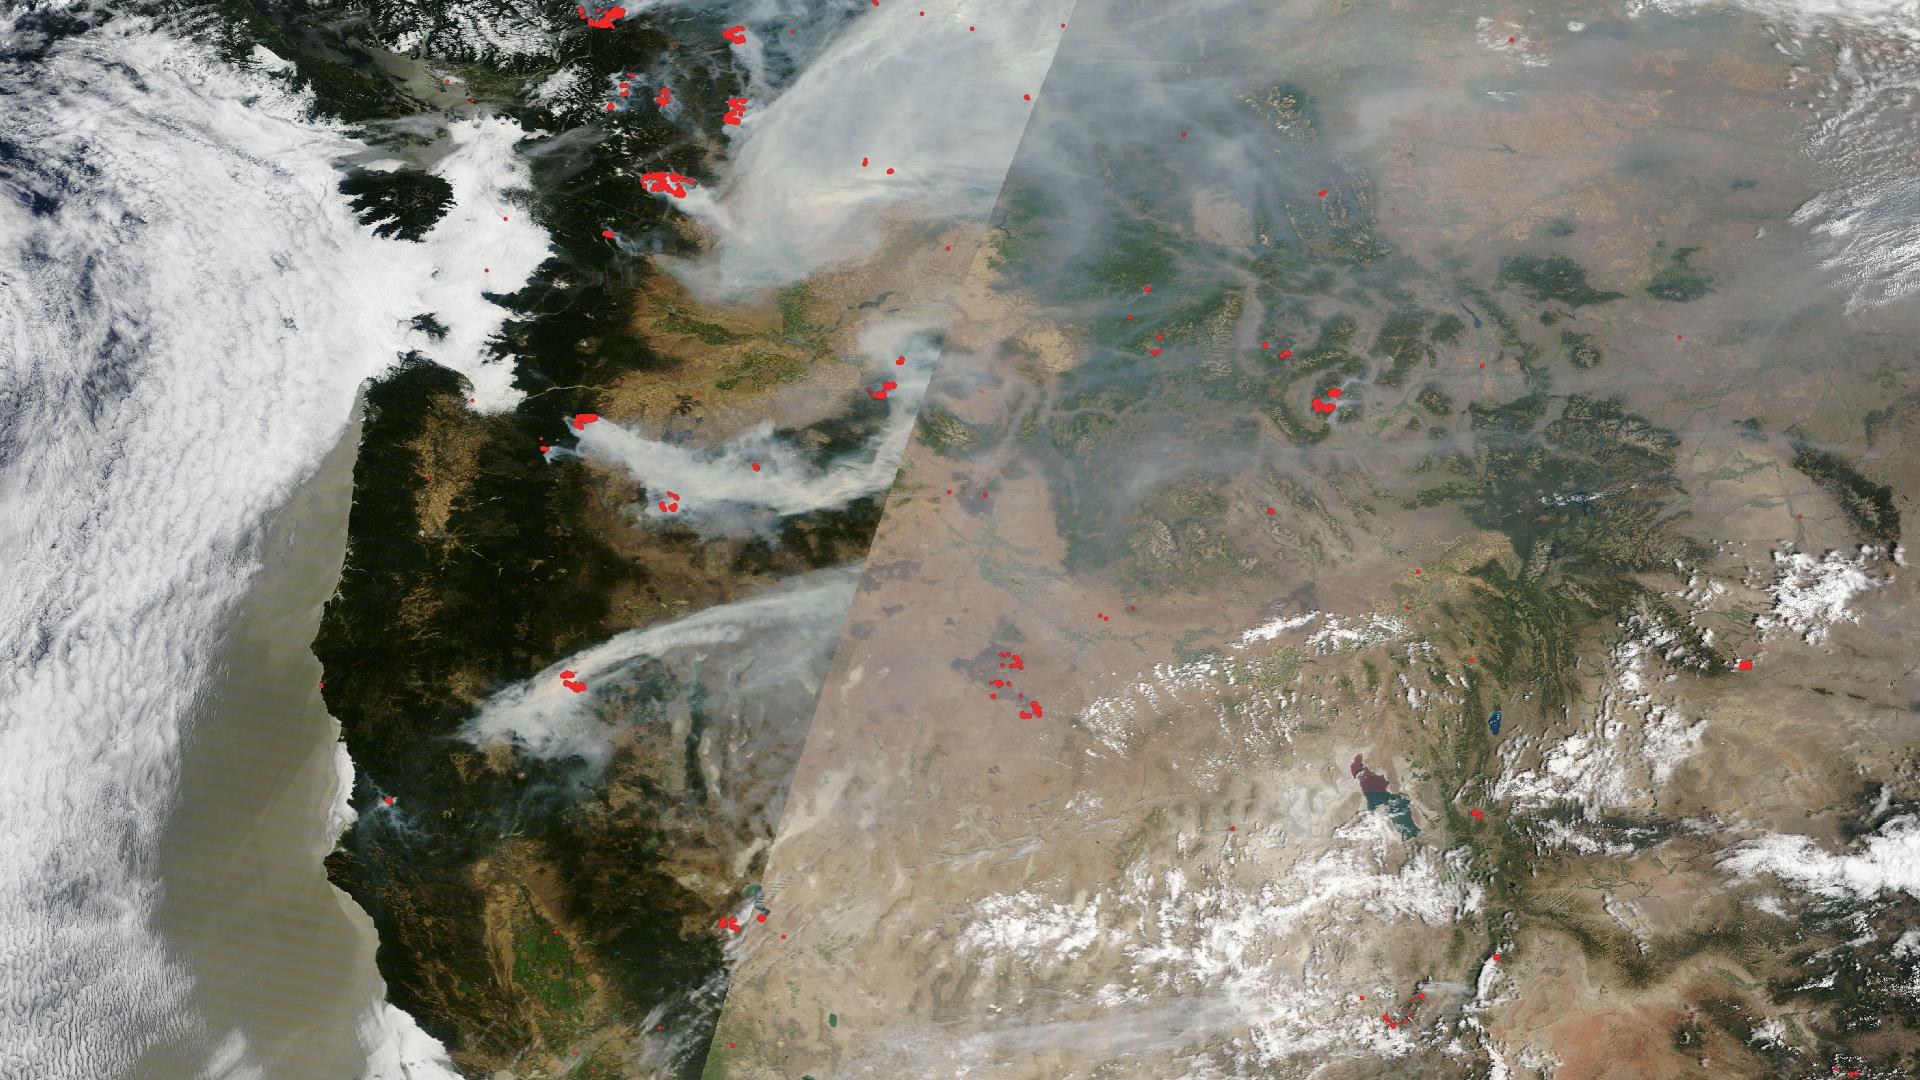
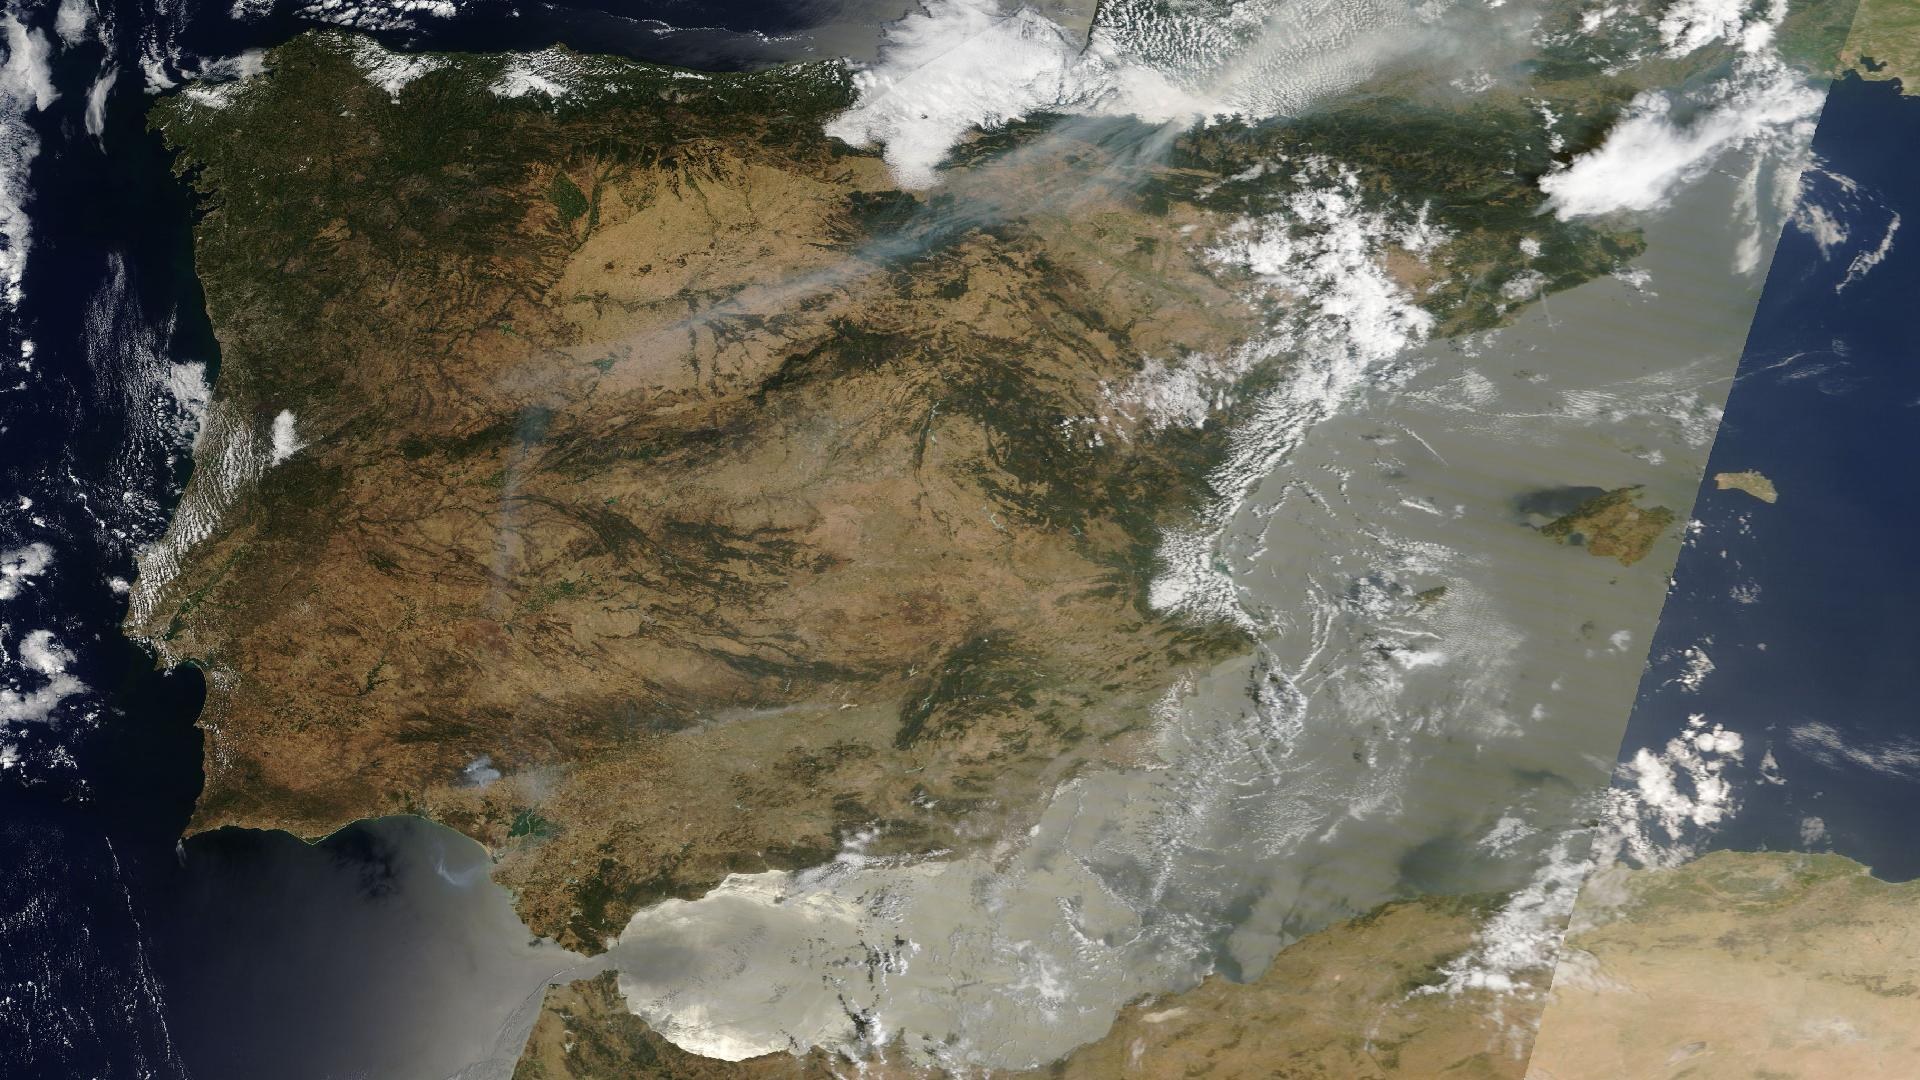
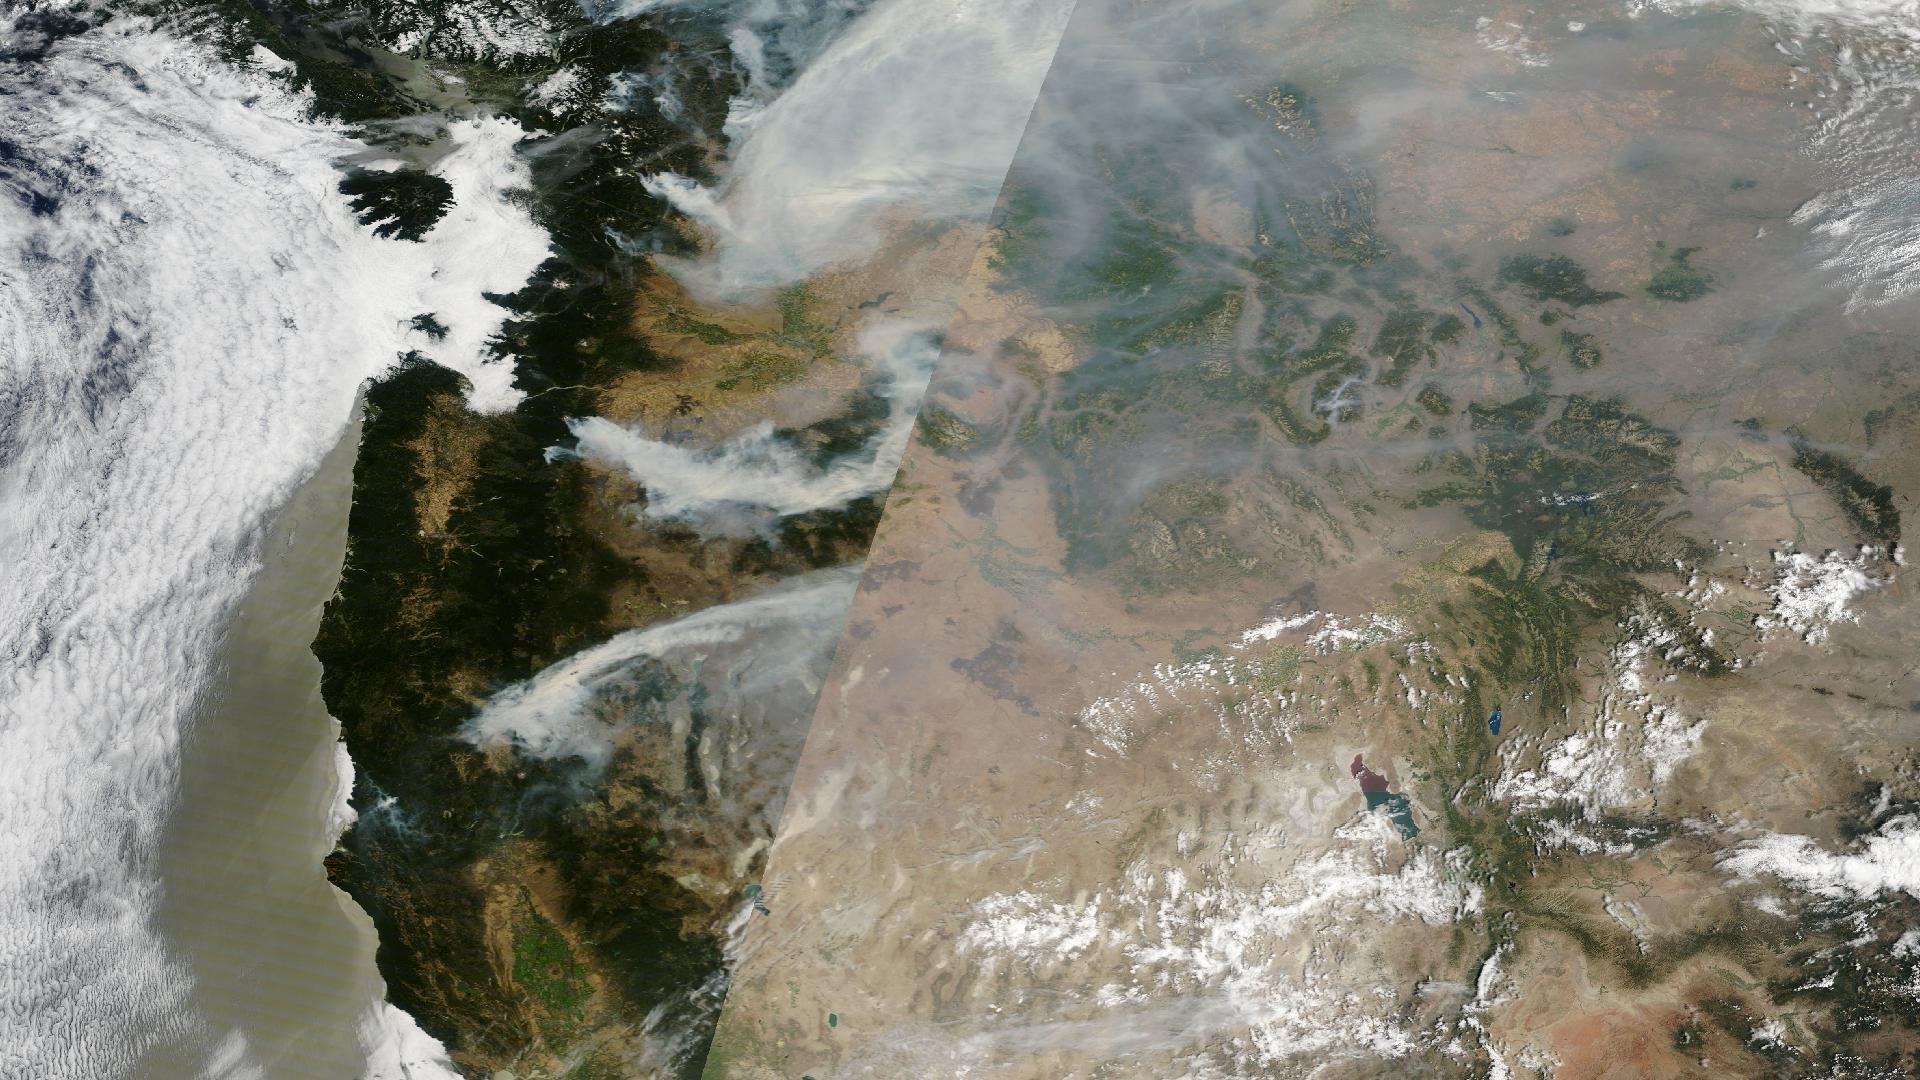
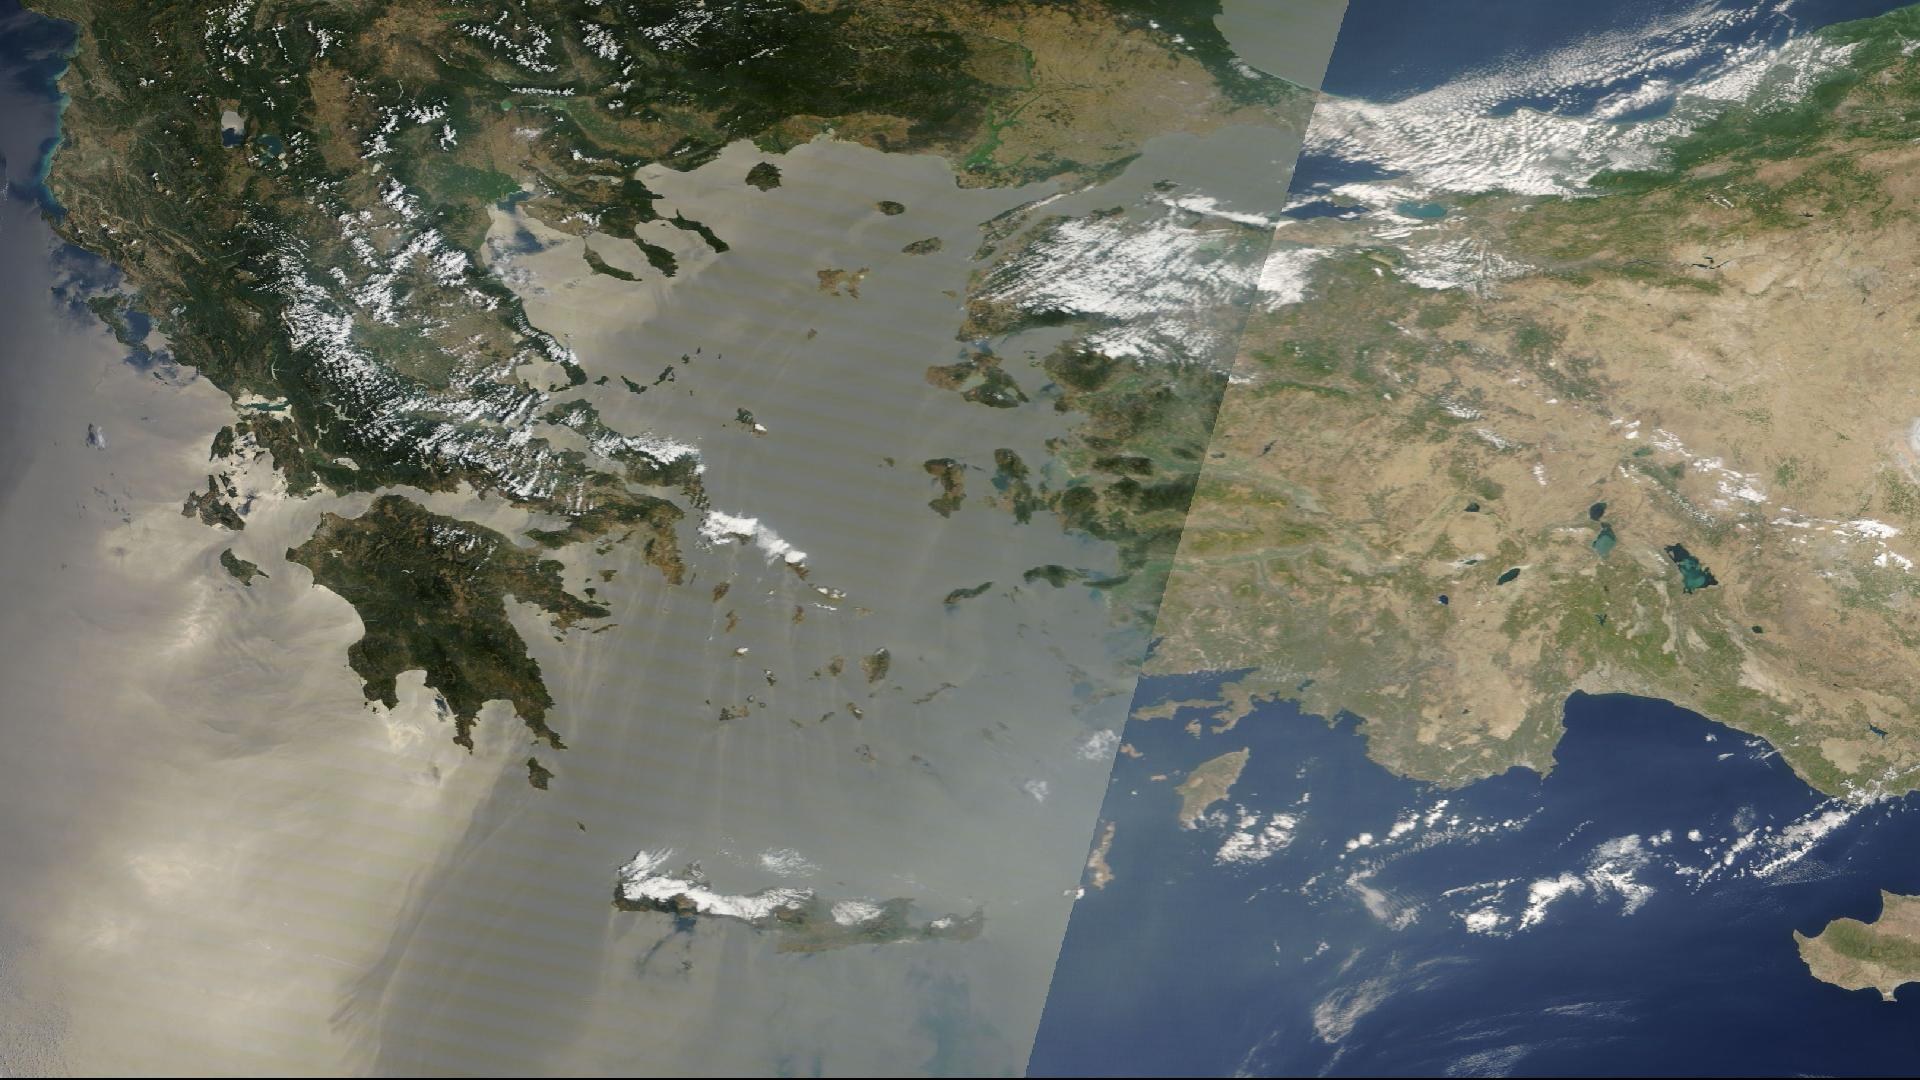
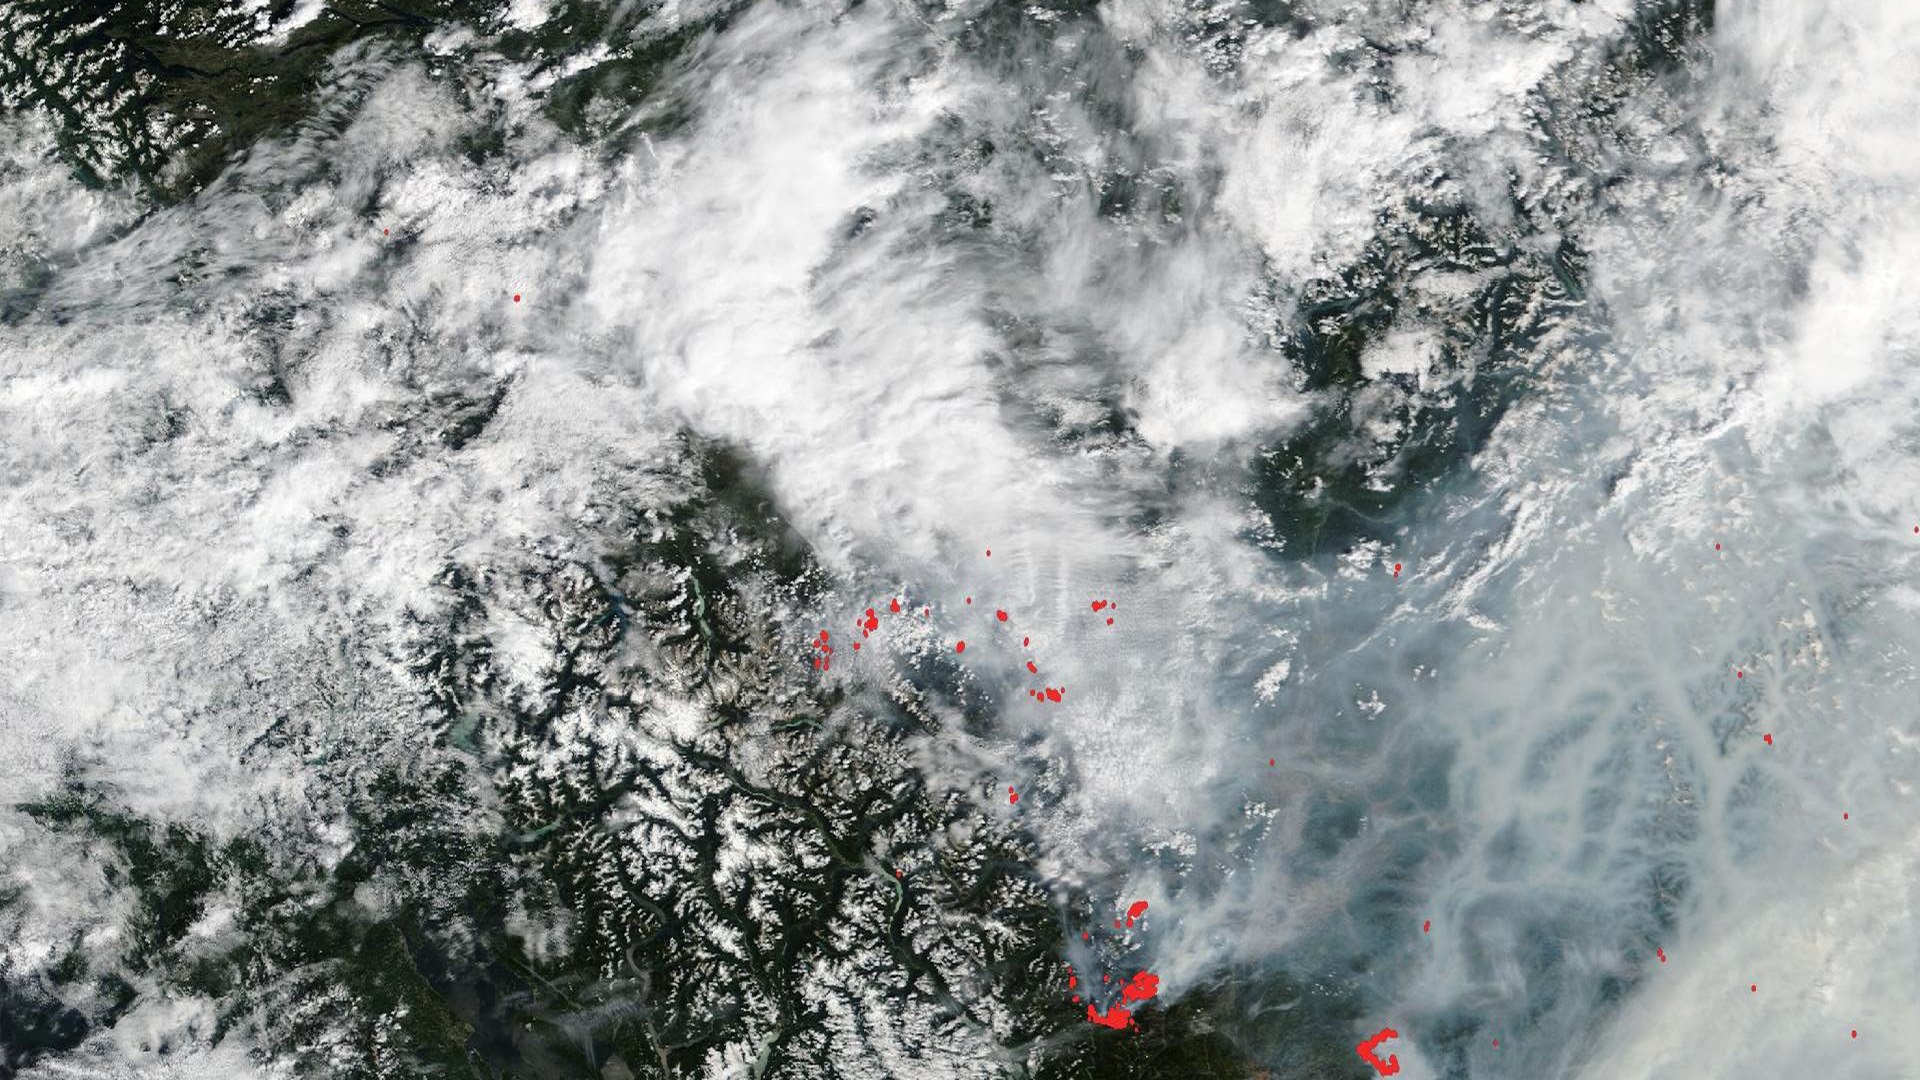
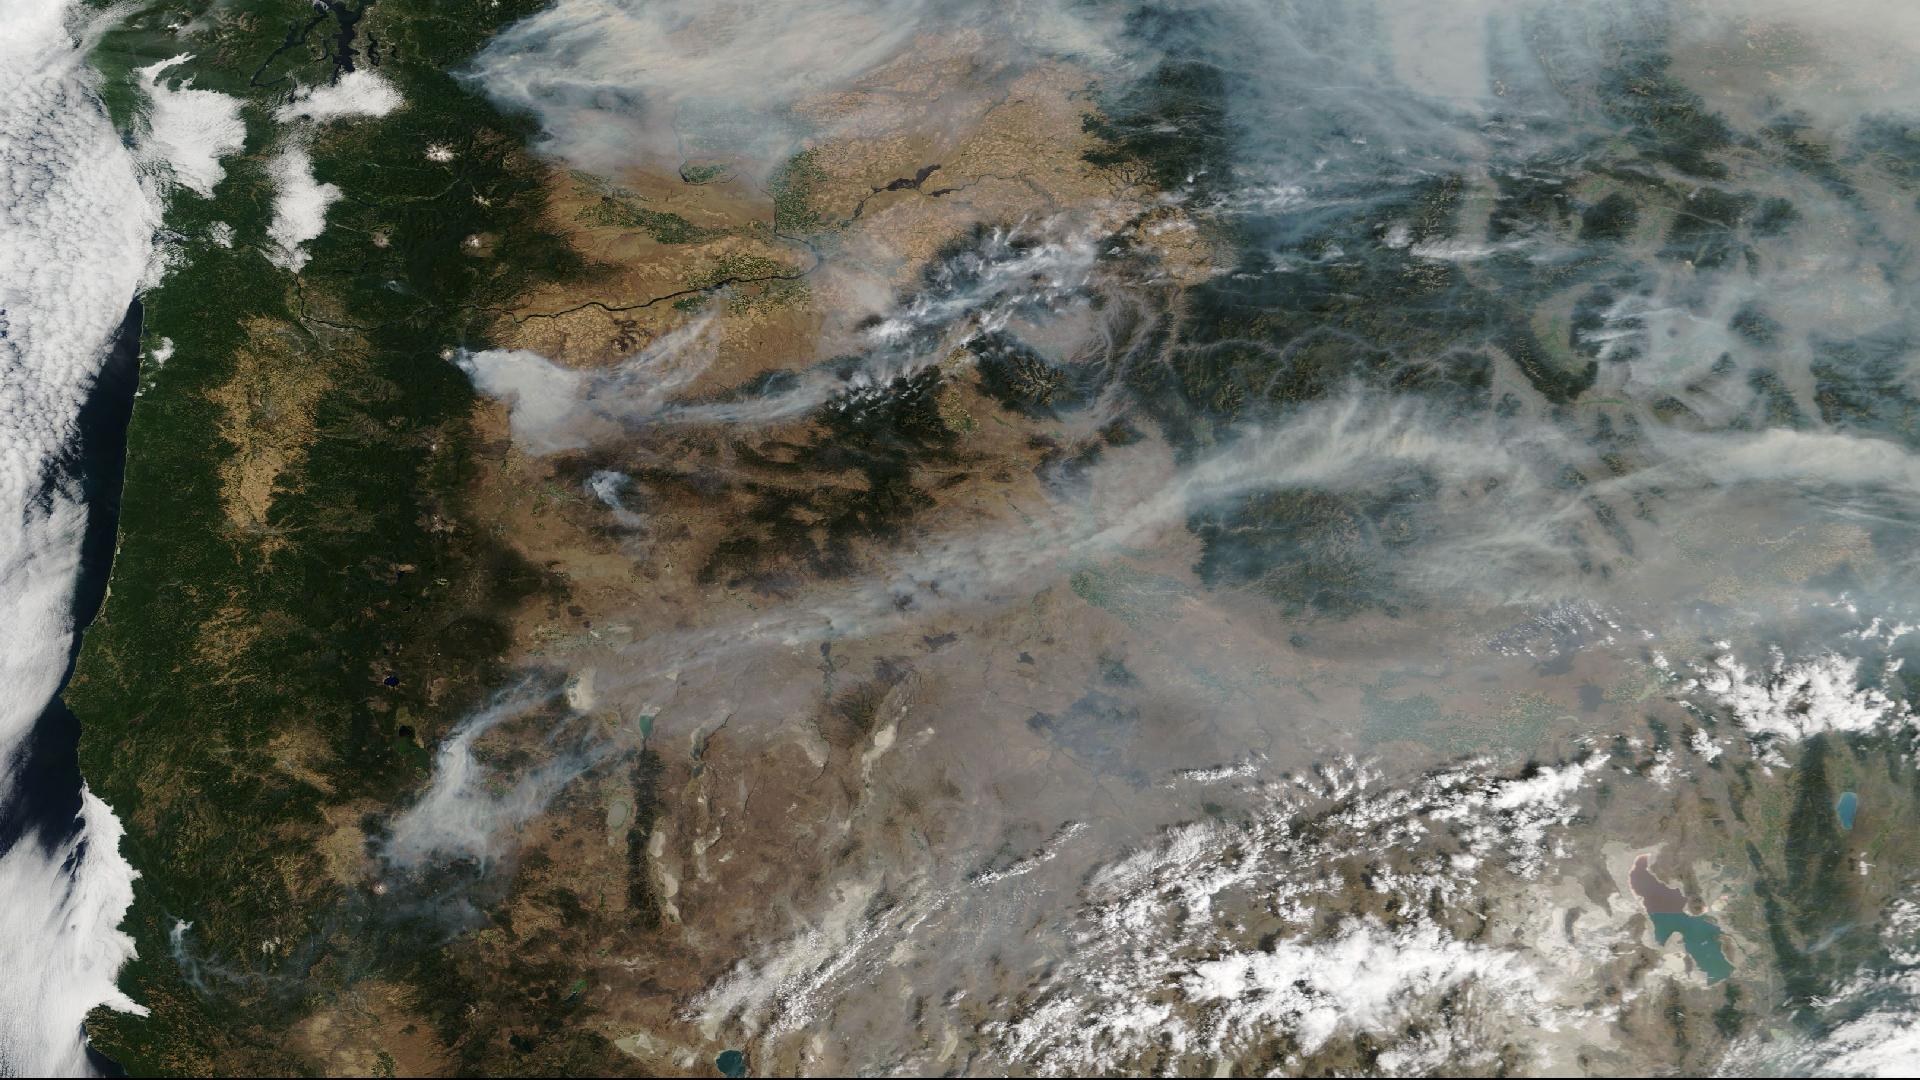
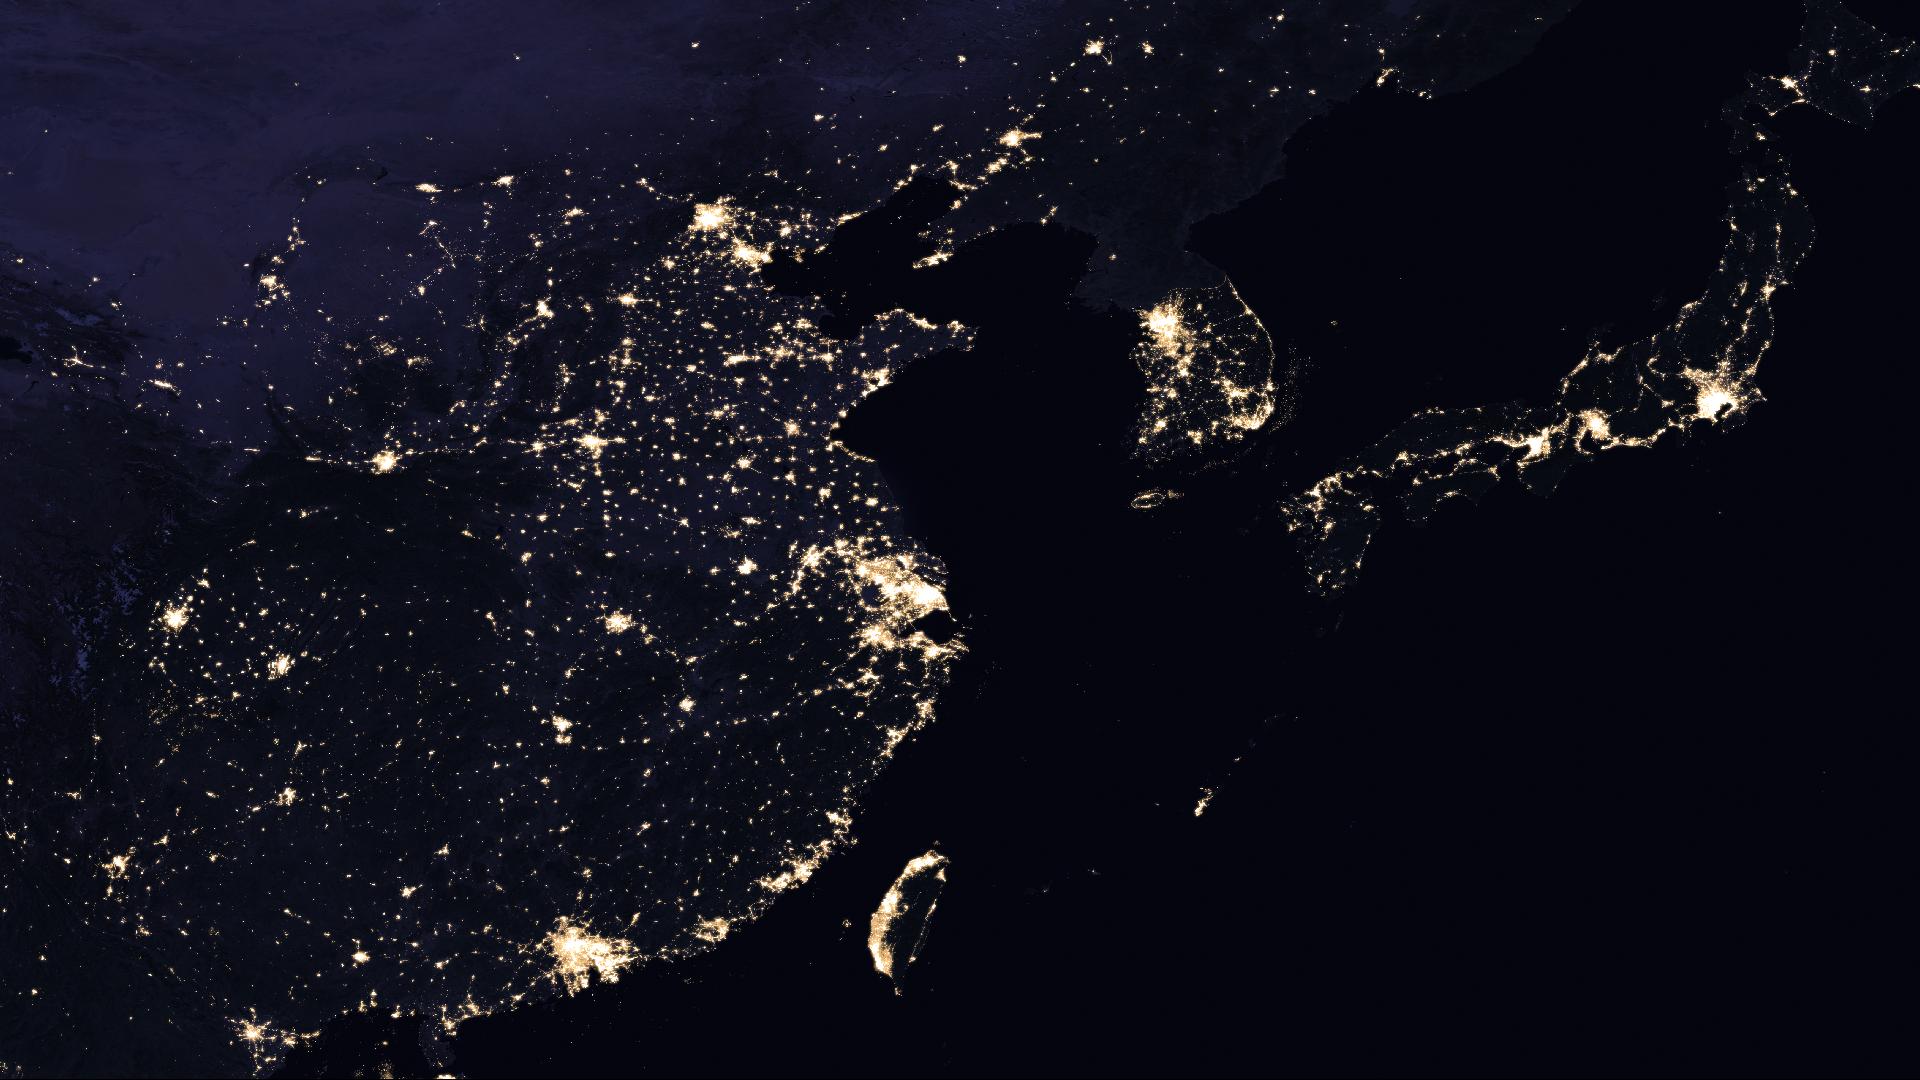
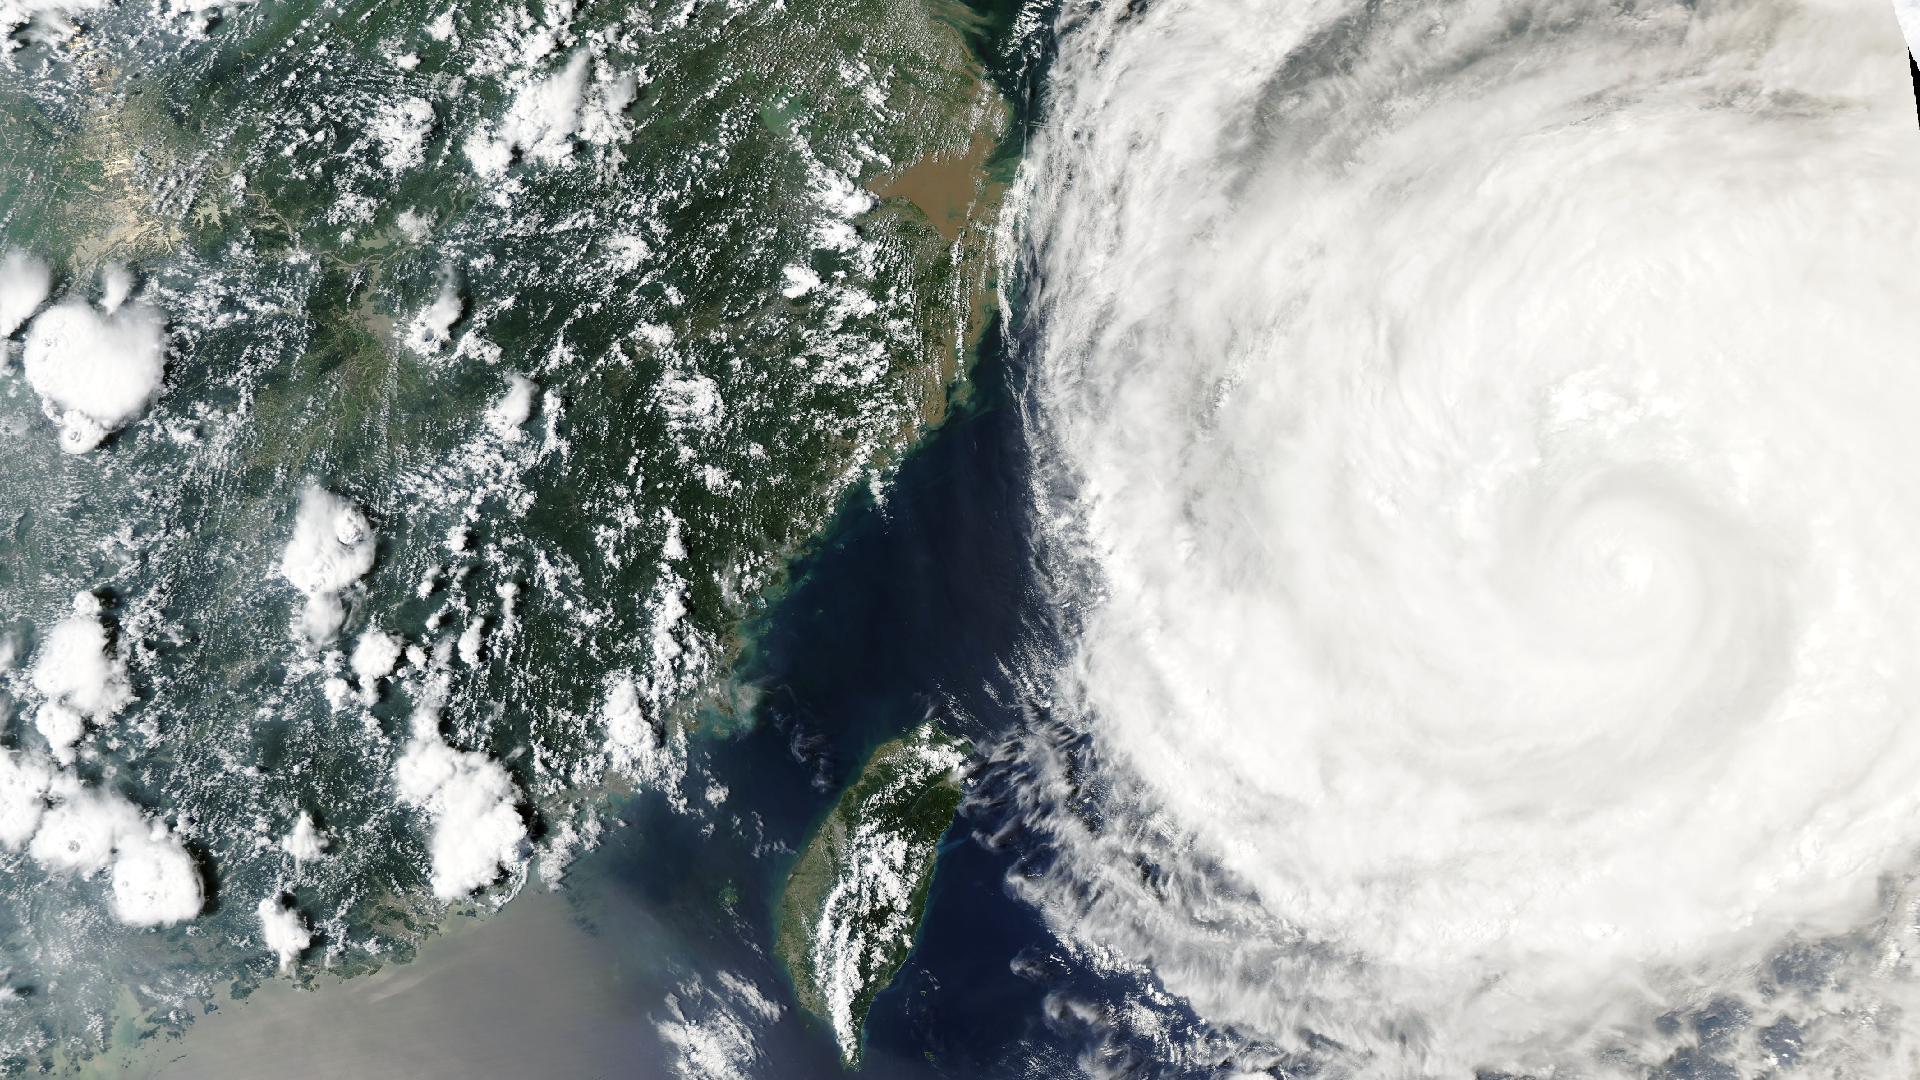
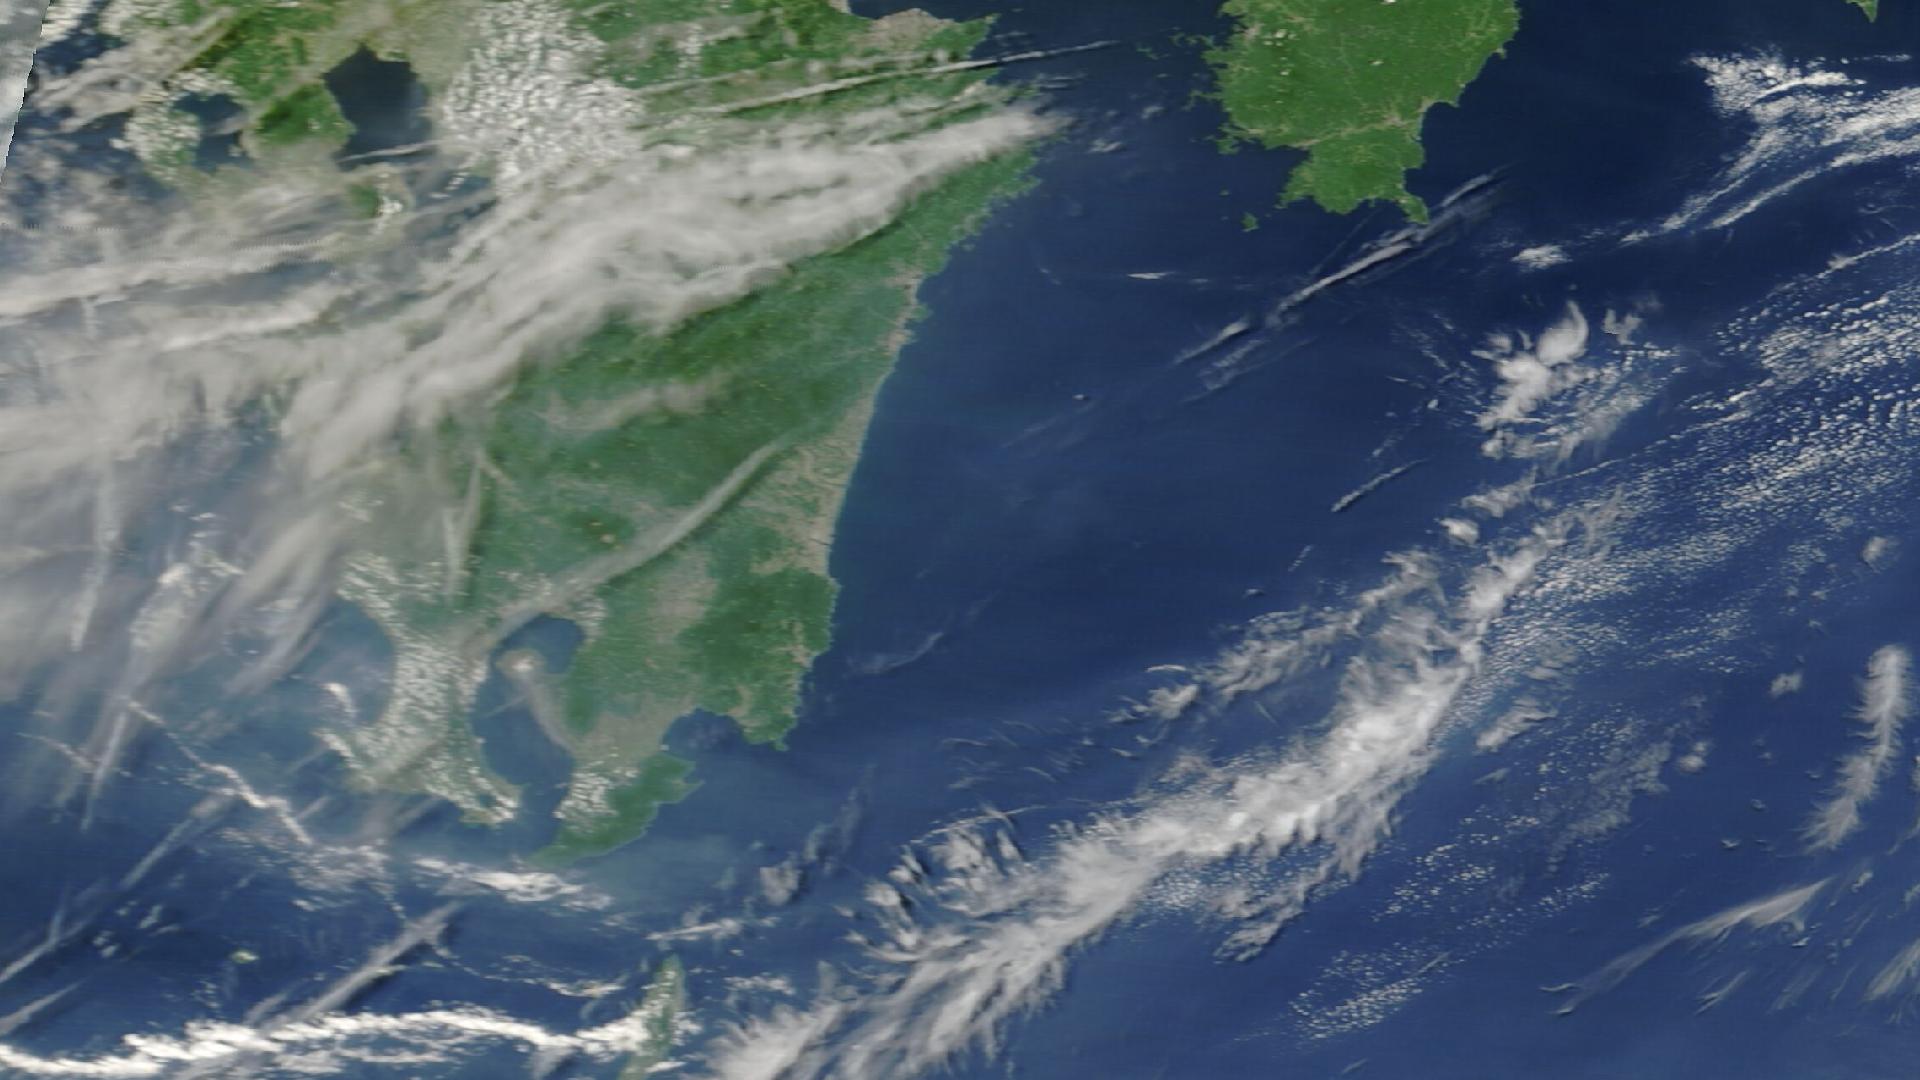
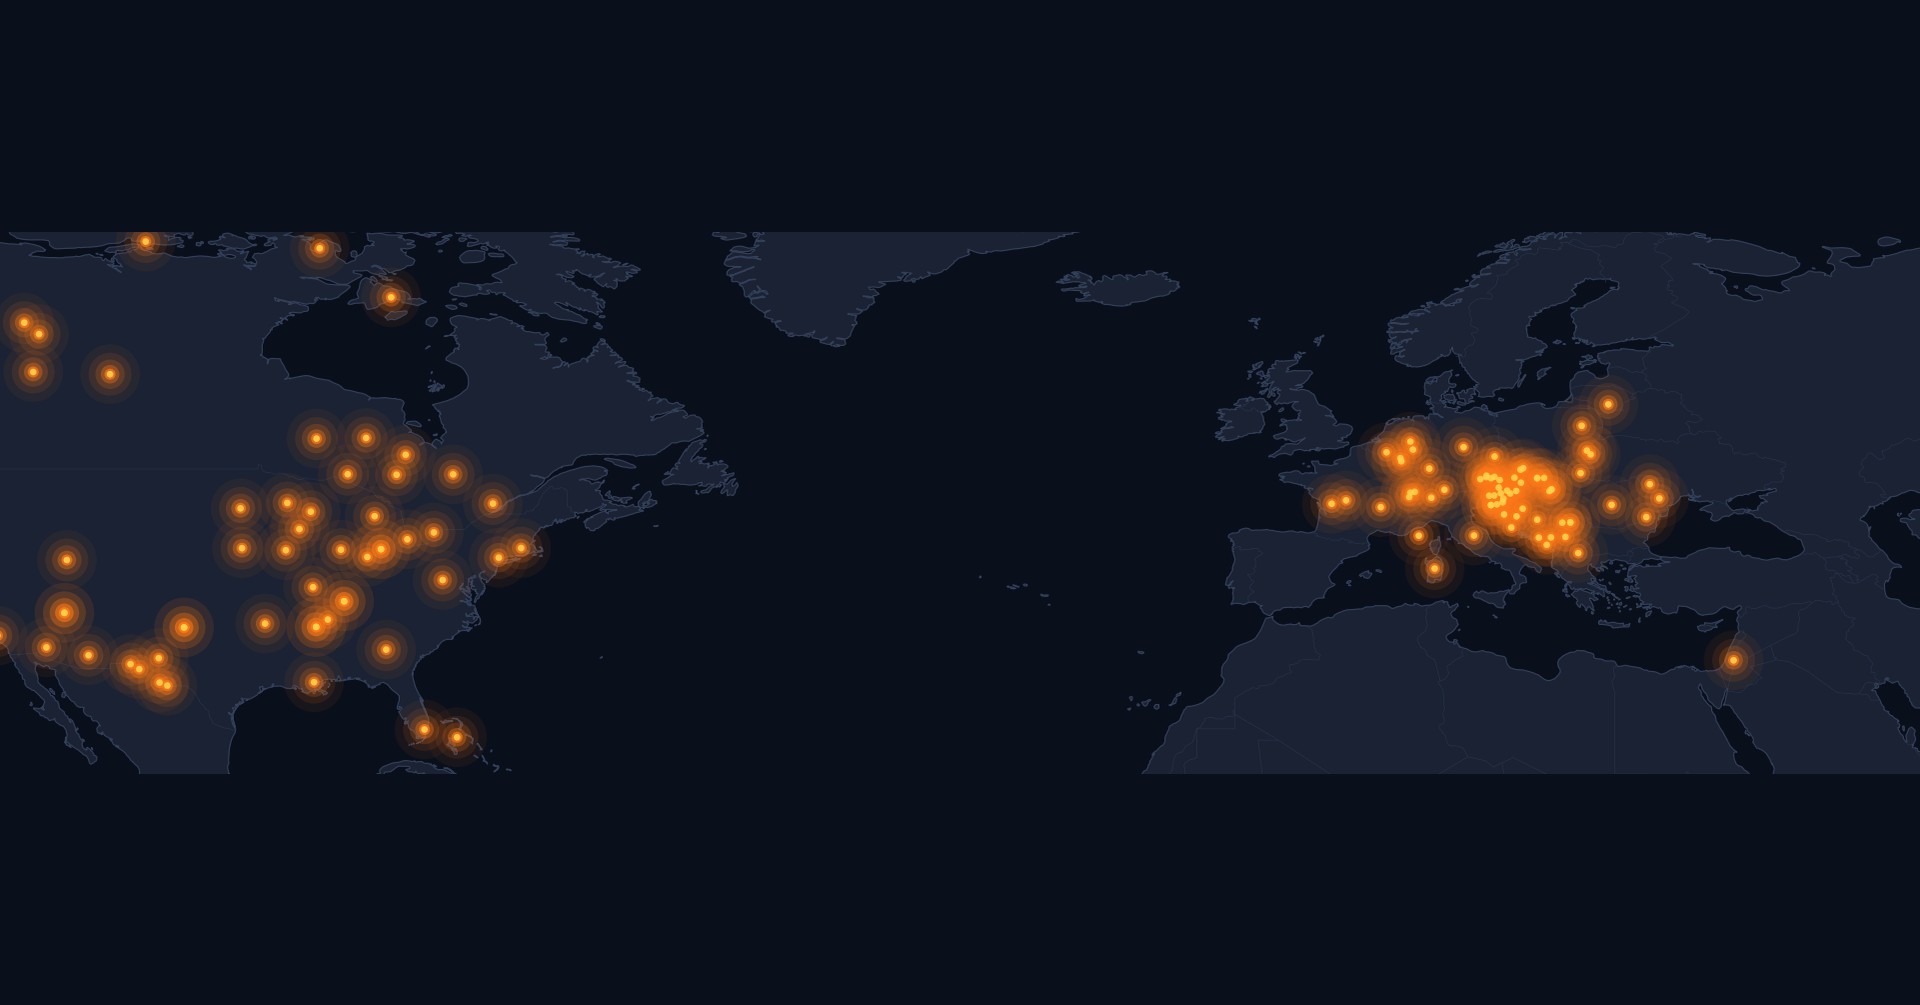
Event intelligence, practiced weekly — our latest hazard briefs:







-min.png)
.png)
.png)

Decision-ready intelligence for understanding what's happening, what is impacted, and what to do next. Global hazard, severe weather, catastrophe, and physical risk intelligence trusted by governments, enterprises, insurers, humanitarian organizations, and technology platforms worldwide.
Request DemoContact Us

