


DisasterAWARE Weekly Intelligence Brief — August 29 to September 8, 2026
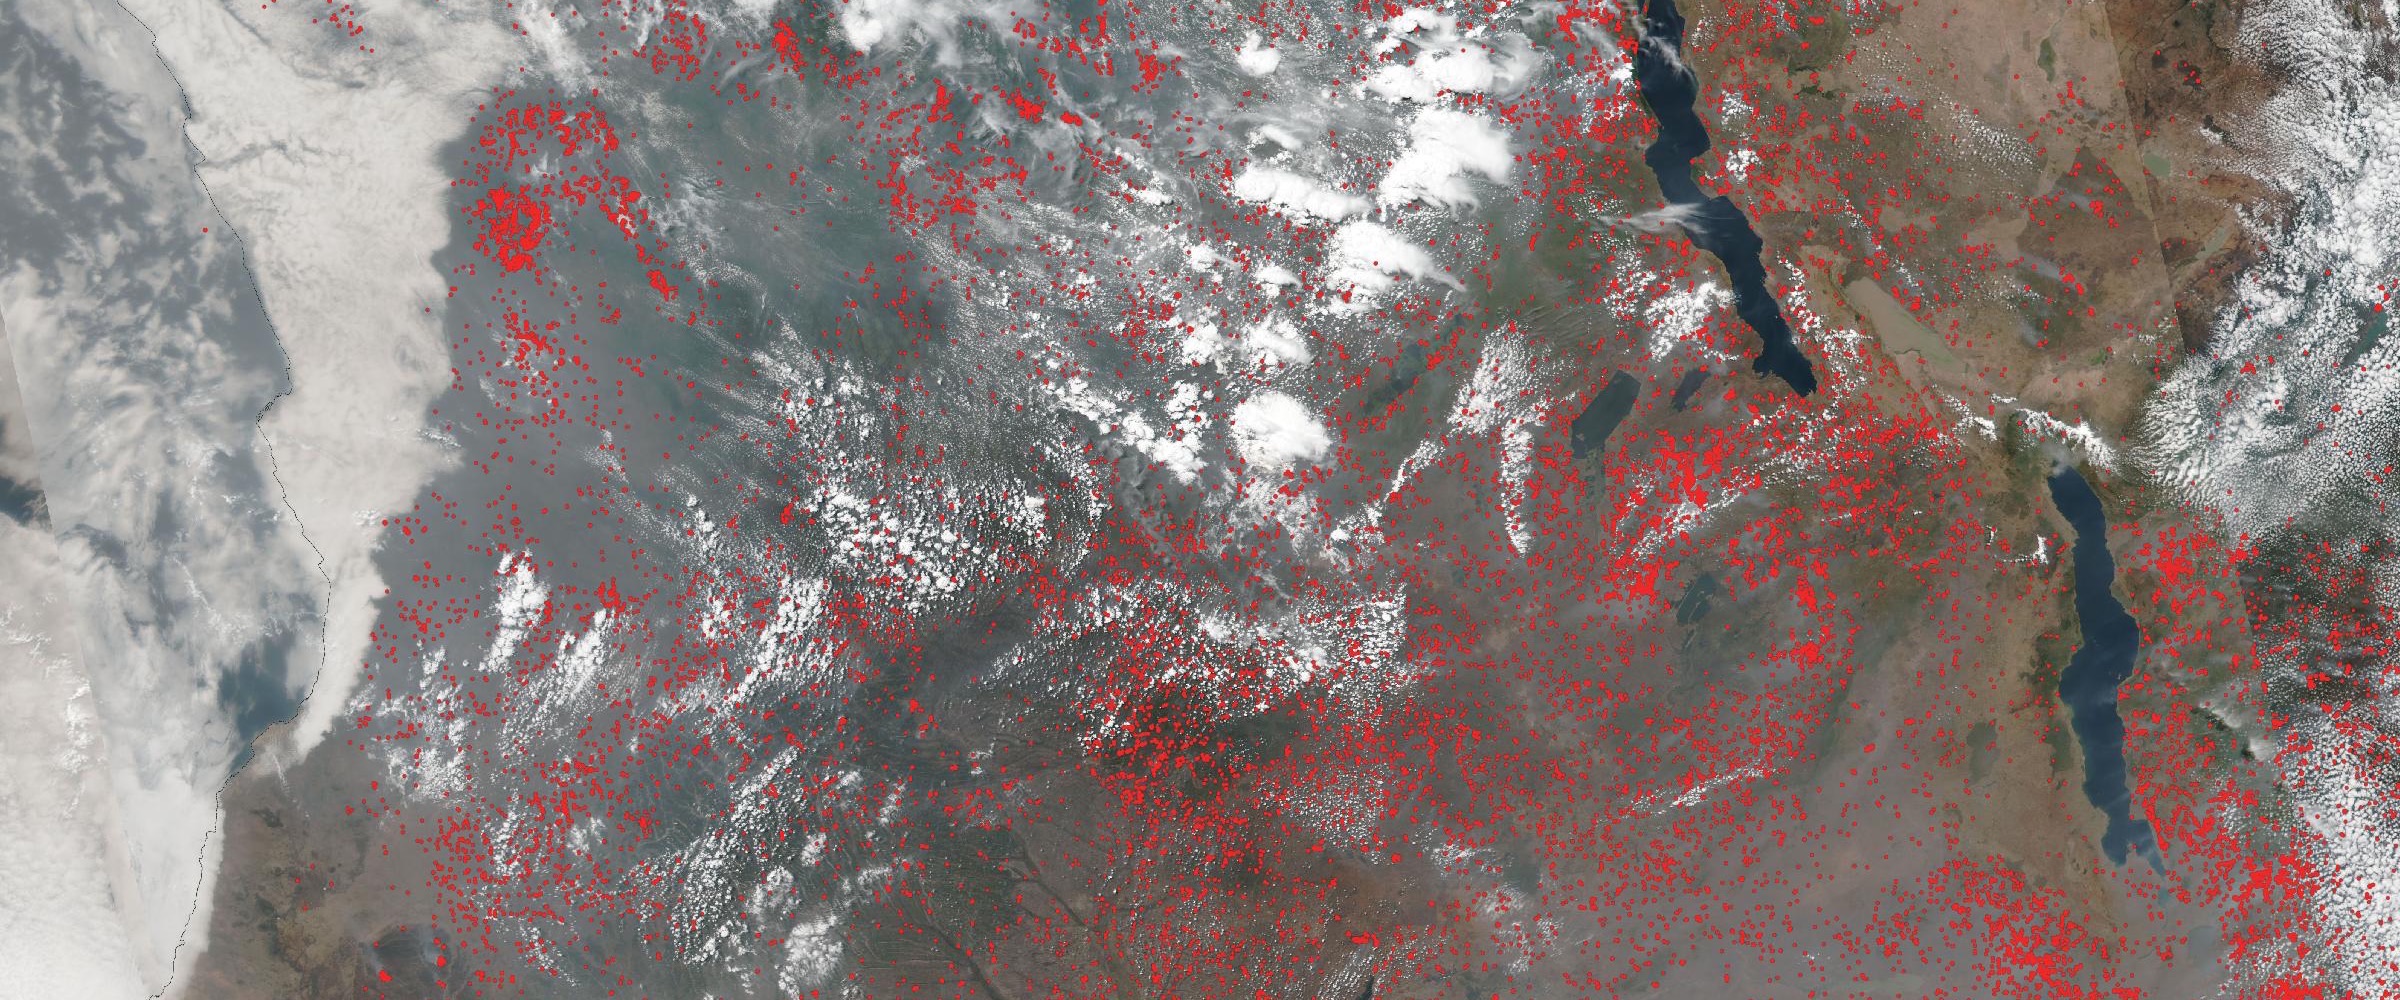
For the second window running, wildfire was 80% of everything on the board. Of 3,514 hazard events that passed our occurrence filter between August 29 and September 8, 2,809 were wildfire records — and precision matters here about what that word covers. 454 were warning-level events, the tier that includes named, agency-tracked incidents. 2,331 were advisory-level satellite detections: multiple consistent heat signatures the source data itself labels "Potential Large and/or Intense Wildfire… not confirmed by ground or official agencies." A detection at that confidence is almost certainly something burning — but it is a probable fire seen from orbit, not a verified incident, and this brief counts the two tiers separately throughout. What changed from last window is where the burning was. The United States recorded 411 wildfire records, a substantial fire season by any normal measure. The Democratic Republic of the Congo recorded 452, Angola 328, Mozambique 192, Zambia 82, Madagascar 46, Tanzania 34, Namibia 34. Add the Congo Basin and Southern Africa together and you get 1,168 wildfire records — nearly three times the American total, and 42% of everything fire-related on Earth this window — of which 1,106 are satellite detections and just 62 reached warning level. Almost none of it, at either tier, was covered anywhere.
What's confirmed, what's detected, and what's forecast: Every count above is an observed record, deduplicated by UUID across the active and historical feeds — but the wildfire numbers span two evidence tiers, and we hold them apart. Warning-level records (454 fires this window) are the pipeline's higher-confidence tier — in the US these are named incidents carried by NIFC reporting. Advisory-level records (2,331) are satellite heat detections: the source text for each reads "derived from satellite heat detections and modeled exposure estimates and has not been corroborated by ground or official" sources, and their exposure figures are modeled, not surveyed. On the map, warning-level fires are red, detections are orange, and anything that stopped being detected before the September 8 data cutoff is faded. (The full argument for why a satellite fire detection is not yet wildfire intelligence — and what turns one into the other — is an explainer of its own.) The 4,349 formal warnings, watches, and advisories our occurrence filter set aside this window are context only and are never counted as events. One caution we're applying to ourselves: the single largest exposure figure in this window belongs to a wildfire record for Gironde, France (101,000 people, $18.8 billion) — but that record began on July 23, carries a placeholder end date, and its own description text estimates 22,500 people and $4.66 billion, a 4.5× disagreement with its structured exposure field. We have excluded it from every headline number here and flag it rather than quietly using the larger figure.
Open map full screen in a new tab ↗
Reading the map: it opens on the Southern Africa / Congo Basin fire belt — the window's hero story — with every fire marker colored by evidence tier: red is warning-level confirmed severe activity; orange is an advisory satellite detection, not confirmed by ground or official agencies (the on-map legend, bottom left, carries the same key). Solid markers were still active at the September 8 data cutoff; faded markers had already ended — so the belt reads as what it is, a ten-day accumulation of mostly short-lived detections with the 73 still-active fires standing out. Click any marker for its detection date range and status. The layer control (bottom right) toggles the Ukraine/Russia conflict-zone fires — a notably more-confirmed cluster — United States wildfires, the rest-of-world fires, and this window's warning-level earthquakes and volcanoes. Zoom out to see the whole board.
The Southern African fire belt is the largest recurring burning event on the planet, and it is almost entirely absent from Western hazard coverage. Between roughly June and October, the dry season moves across the miombo woodlands and savanna that run from Angola and the southern DRC east through Zambia, Malawi, Mozambique, and Tanzania. Much of the burning is agricultural and deliberate — land clearing, pasture management, hunting practice — layered on top of lightning ignitions in cured grass.
That mixture is exactly why it gets undercounted. A fire that is intentional, seasonal, and rural fails nearly every filter a Western newsroom applies: no structures threatened, no evacuation order, no named incident, no suppression effort to cover. But a satellite detection does not care whether a fire was lit on purpose, and neither does the smoke, the carbon, or the household downwind. Turning those raw hotspots into something decision-grade is exactly the pipeline we described in wildfire intelligence beyond satellite hotspots.
The modeled exposure numbers make the point. This window's African detection records include 62,800 people within the detection footprint in Kongo-Central (DRC), 55,200 across Maniema and South Kivu, 33,000 in Ogooué-Lolo (Gabon), 23,200 in Maniema, and 19,900 at Sanza Pombo (Angola) — in a region where the capital-at-risk figures are small precisely because the infrastructure is sparse and the people are not.
That inverts the usual relationship between a fire's newsworthiness and its human footprint. A Californian fire threatening $46 million of structures and 300 people is a national story. A Congolese heat detection with 62,800 people inside its modeled footprint and $160 million at risk is not a story at all — and, tellingly, it usually never graduates past "detection," because no agency is there to confirm it. Both are in the feed. Only one gets written about.
See every hazard, everywhere, as it happens
DisasterAWARE monitors 30+ hazard types worldwide in real time — with the population, infrastructure, and assets exposed under each one.
321 wildfire records came out of Ukraine and Russia this window — 142 of them at warning severity, a far higher confirmed share than the African belt's 5%. This is the second consecutive window in which the conflict zone has produced a fire cluster large enough to register as a distinct global feature.
These fires have a property that makes them unlike every other fire in this brief: they cannot be fought. Suppression requires crews to enter the burn area, and the burn area is a front line — mined, shelled, contested. Fires along the contact line burn until they run out of fuel, weather, or both. From an intelligence standpoint, a fire that cannot be suppressed changes the forecast entirely: the usual containment curve does not apply, and the relevant question shifts from "when will this be controlled?" to "what is downwind, and for how long?"
The window's most consequential single event by damage was Hurricane Lowell, which reached Category 5 twice — on September 2 (160 mph, 927 mb) and again on September 5 (160 mph, 922 mb) — making it the first Category 5 in the Central Pacific since Walaka in 2018, and only the third Pacific hurricane on record to reach the top category twice.
Lowell then turned north and passed roughly 40 miles west of Niʻihau on September 8 without making landfall. It still knocked out power to more than 91% of Kauaʻi County, destroyed Waimea Pier, sank vessels at Port Allen, dropped rainfall near 20 inches on the north shore, disabled the island's only weather radar before the worst of the storm arrived, and is blamed for two deaths. Damage estimates exceed $400 million.
Its closest approach fell three days before the 34th anniversary of Hurricane Iniki, the Category 4 that struck Kauaʻi on September 11, 1992 — and the storm that caused Congress to create the Pacific Disaster Center. We've published a full analysis of Lowell and what a 40-mile near-miss actually delivers.
Two magnitude-7-class earthquake response operations continued running simultaneously: the M7.5 near Yumare, Venezuela and the M7.4 at San José del Palmar, Colombia. Of 62 earthquakes in the window, 16 reached M5.5 or greater, including an M6.3 southwest of Nikolski, Alaska, an M6.2 in the South Sandwich Islands region, and an M6.0 north of Caluula, Somalia.
Volcanic activity stayed elevated, with 15 of 33 volcanic events at warning level — Fuego in Guatemala and Reventador in Ecuador alongside an unusually active Indonesian cluster (Semeru, Ibu, Dukono, Lewotolo).
Storms and floods were comparatively quiet at 200 and 79 events respectively. Drought records appear in the feed as ongoing background conditions and are not counted among this window's actual events.
Two of this brief's three main findings are stories about where nobody is looking: a fire belt that outburns the American West by three to one and gets no coverage, and a conflict-zone fire cluster that cannot be suppressed by anyone. The third — Lowell — is a story about what happens when the looking stops, when the radar on the island fails before the storm arrives.
The common thread is that hazard significance and hazard visibility are only loosely related. Coverage follows structures, cameras, and named incidents. Exposure follows people. The Africa belt's own numbers show the mechanism: 95% of its records never advance past "satellite detection" — not because the fires are unreal, but because nobody on the ground is confirming them. A monitoring system that inherits the newsroom's filters will faithfully reproduce the newsroom's blind spots — which is why ours carries every detection, in every country, labeled as exactly what it is, whether or not anyone is writing about it.
Why are there so many wildfires in Southern Africa right now? June through October is the region's dry season, when burning moves across the miombo woodlands and savanna from Angola and the southern DRC east through Zambia, Malawi, Mozambique, and Tanzania. Much of it is deliberate agricultural burning layered on lightning ignitions in cured grass. This window produced 1,168 wildfire records across seven countries — 1,106 of them satellite heat detections, 62 at warning level.
What is the difference between a wildfire detection and a confirmed wildfire? An advisory-level detection is a satellite heat signature — often multiple consistent detections with modeled exposure — that the source data explicitly labels as not confirmed by ground or official agencies. A warning-level event is the higher-confidence tier, which in the United States includes named incidents carried by NIFC reporting. This brief counts the two separately: 454 warning-level events and 2,331 detections this window.
Why can't the Ukraine and Russia wildfires be suppressed? Because the burn areas sit on or near an active front line — mined, shelled, and contested — fire crews cannot enter. Fires burn until they run out of fuel or weather. The window recorded 321 wildfire records in the conflict zone, 142 at warning severity.
Did Hurricane Lowell hit Hawaii during this period? Lowell's center passed just west of Niʻihau and Kauaʻi on September 8 without an official landfall, after twice reaching Category 5 over open water. It still cut power to more than 91% of Kauaʻi County and is blamed for two deaths. Our full analysis of Lowell covers the storm and the Iniki anniversary in depth.



Decision-ready intelligence for understanding what's happening, what is impacted, and what to do next. Global hazard, severe weather, catastrophe, and physical risk intelligence trusted by governments, enterprises, insurers, humanitarian organizations, and technology platforms worldwide.
Request DemoContact Us

