
Full Layer Catalog
Every Available Geospatial Layer
The complete DisasterAWARE Geospatial Intelligence Layer catalog — hundreds of hazard, weather, forecast, risk, population, infrastructure, and reference layers, organized by category. Click any layer to expand details, preview images, and metadata.
Full Layer Catalog
332 layers · 268 with data · 50 no current data · 14 empty service · 0 unrenderable protocol · 3 render failures · 4 animated · 400×300 px, zoom auto-selected per layer
▶ Animated layers (4)
These layers carry multiple time-series data points and are returned as a single animated artifact (HTML player, animated PNG, or animated GIF) when requested through the API. Click a layer below to jump to its card.
- Ash Clouds Forecast3 frames
- Precipitation Forecast (USA)7 frames
- Wildfire Weather Outlook (USA)8 frames
- Tropical Cyclone Forecast Uncertainty2 frames
Advanced Analytics / Risk and Vulnerability (92)
Background Map Layers / ESRI ArcGIS Online Imagery (1)
Background Map Layers / Mapbox Dark (1)
Background Map Layers / Mapbox Light (1)
Background Map Layers / Mapbox Navigation Day (1)
Background Map Layers / Mapbox Navigation Night (1)
Background Map Layers / Mapbox Outdoors (1)
Background Map Layers / Mapbox Satellite Streets (1)
Background Map Layers / Mapbox Streets (1)
Background Map Layers / OSM Basic (1)
Background Map Layers / OSM Black and White (1)
Background Map Layers / OSM Blue (1)
Background Map Layers / OSM Dark Mode (1)
Background Map Layers / OSM Enhanced (1)
Background Map Layers / OSM Gray (1)
Background Map Layers / OSM Terrain (1)
Background Map Layers / OSM Terrain Gray (1)
Background Map Layers / PDC Default Basemap (1)
Current Observations & Forecasts / Atmospheric (1)
Current Observations & Forecasts / Day (1)
Current Observations & Forecasts / Ocean (1)
Disaster Response Events / Middle East Conflict Response 2026 (12)
Early Warning / SmartAlerts - All Hazards (1)
Featured Layers / Population Density (1)
Global Data / Boundaries (7)
Global Data / Embassies (United States) (1)
Global Data / Emergency Services (4)
Global Data / Schools (3)
Global Data / Transportation (4)
Global Data / Utilities (5)
Hazards and Events / Avalanche (4)
Hazards and Events / Biomedical (4)
Hazards and Events / Drought (7)
Hazards and Events / Earthquake (7)
Hazards and Events / Extreme Temperature (5)
Hazards and Events / Flood (21)
Hazards and Events / Geopolitical Incidents (18)
Hazards and Events / High Surf (3)
Hazards and Events / High Wind (2)
Hazards and Events / Landslide (3)
Hazards and Events / Manmade (2)
Hazards and Events / Marine (3)
Hazards and Events / Severe Weather (4)
Hazards and Events / Storm (2)
Hazards and Events / Tornado (4)
Hazards and Events / Tropical Cyclone (57)
Hazards and Events / Tsunami (7)
Hazards and Events / Volcano (7)
Hazards and Events / Wildfire (16)
Hazards and Events / Winter Storm (3)
PDC Composite (1)
User layers (2)
Advanced Analytics / Risk and Vulnerability (92)
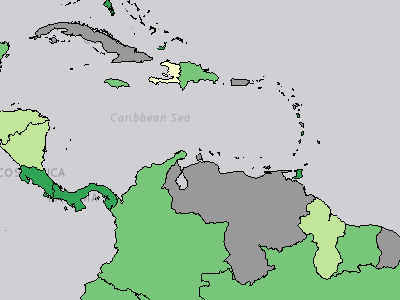
Coping Capacity Index
Advanced Analytics / Risk and Vulnerability / Coping Capacity / Coping Capacity Index
The Coping Capacity Index combines data for Economic Capacity Index, Environmental Capacity Index, Governance Index, and the Infrastructure Index. Values range from 0-1, with 1 representing a higher coping capacity.
Legend
 Very Low
 Low
 Moderate
 High
 Very High
 No Data
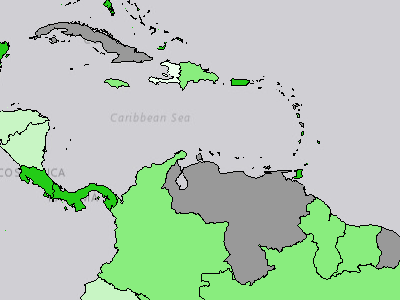
Economic Capacity Index
Advanced Analytics / Risk and Vulnerability / Coping Capacity / Economic Capacity / Economic Capacity Index
The Economic Capacity Index combines indicator data for GNI per Capita and Reserves per Capita. The Economic Capacity Index is part of the Coping Capacity Index. Values range from 0-1, with 1 representing a higher coping capacity.
Legend
 Very Low
 Low
 Moderate
 High
 Very High No Data
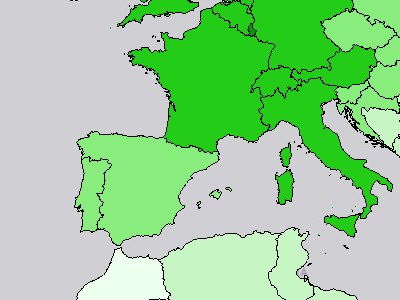
GNI per Capita
Advanced Analytics / Risk and Vulnerability / Coping Capacity / Economic Capacity / GNI per Capita
GNI per capita, PPP (constant 2021 international $)
Legend
$830.63 - 11,091.57 $11,091.58 - 28,032.17 $28,032.18 - 49,159.34 $49,159.35 - 81,515.48 $81,515.49 - 115,036.57 No Data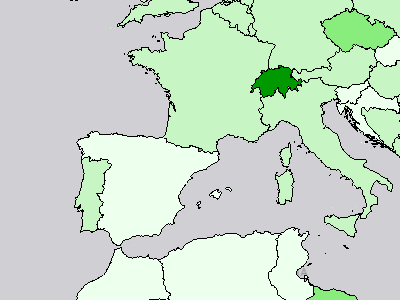
Reserves per Capita
Advanced Analytics / Risk and Vulnerability / Coping Capacity / Economic Capacity / Reserves per Capita
Total reserves (includes gold, current US$) per capita
Legend
US$4.17 - 2,218.71 US$2,218.72 - 7,187.34 US$7,187.35 - 14,767.32 US$14,767.33 - 40,911.37 US$40,911.38 - 97,196.54 No Data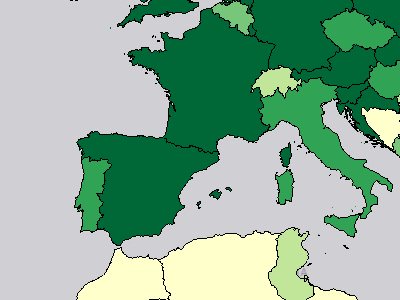
Biome Protection
Advanced Analytics / Risk and Vulnerability / Coping Capacity / Environmental Capacity / Biome Protection
Terrestrial Biome Protection / Biodiversity / Ecosystem Vitality
Legend
0.00% - 16.50% 16.51% - 40.20% 40.21% - 60.70% 60.71% - 80.20% 80.21% - 100.00% No Data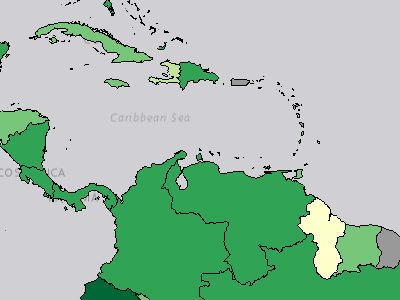
Environmental Capacity Index
Advanced Analytics / Risk and Vulnerability / Coping Capacity / Environmental Capacity / Environmental Capacity Index
The Environmental Capacity Index combines indicator data for Biome Protection and Marine Protected Areas. The Environmental Capacity Index is part of the Coping Capacity Index. Values range from 0-1, with 1 representing a higher coping capacity.
Legend
Very Low Low Moderate High Very High No Data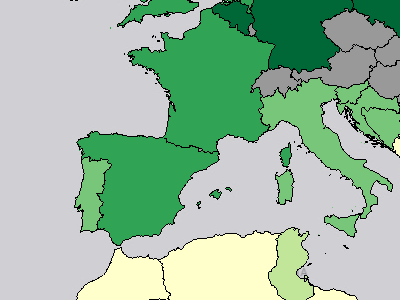
Marine Protected Areas
Advanced Analytics / Risk and Vulnerability / Coping Capacity / Environmental Capacity / Marine Protected Areas
Marine Habitat Protection / Biodiversity / Ecosystem Vitality
Legend
0.00% - 8.00% 8.01% - 27.50% 27.51% - 44.70% 44.71% - 66.30% 66.31% - 100.00% No Data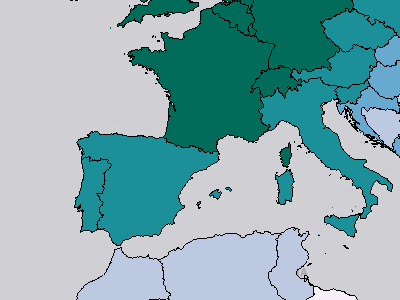
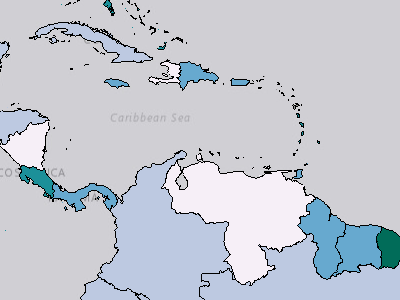
Control of Corruption
Advanced Analytics / Risk and Vulnerability / Coping Capacity / Governance / Control of Corruption
Control of corruption captures perceptions of the extent to which public power is exercised for private gain, including both petty and grand forms of corruption, as well as "capture" of the state by elites and private interests.
Legend
 -1.97 - -0.97
 -0.96 - -0.27
 -0.26 - 0.36
 0.37 - 1.13
 1.14 - 2.38 No Data
Governance Index
Advanced Analytics / Risk and Vulnerability / Coping Capacity / Governance / Governance Index
The Governance Index combines indicator data for Control of Corruption, Government Effectiveness, Political Stability, Rule of Law, and Voice and Accountability. The Governance Index is part of the Coping Capacity Index. Values range from 0-1, with 1 representing a higher coping capacity.
Legend
Very Low Low Moderate High Very High No Data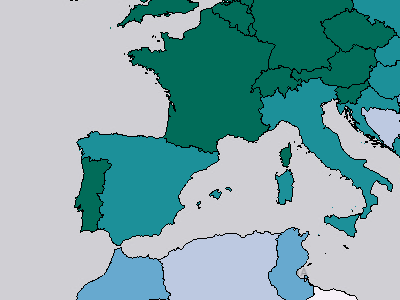
Government Effectiveness
Advanced Analytics / Risk and Vulnerability / Coping Capacity / Governance / Government Effectiveness
Government effectiveness captures perceptions of the quality of public services, the quality of the civil service and the degree of its independence from political pressures, the quality of policy formulation and implementation, and the credibility of the government's commitment to such policies.
Legend
-2.33 - -1.32 -1.31 - -0.45 -0.44 - 0.17 0.18 - 0.88 0.89 - 2.32 No Data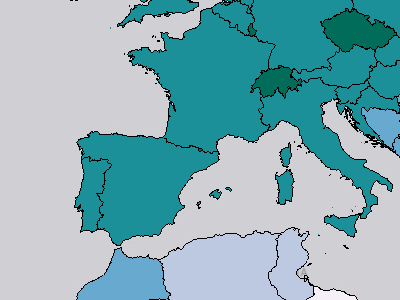
Political Stability
Advanced Analytics / Risk and Vulnerability / Coping Capacity / Governance / Political Stability
Political Stability and Absence of Violence/Terrorism measures perceptions of the likelihood of political instability and/or politicallymotivated violence, including terrorism.
Legend
-2.75 - -1.40 -1.39 - -0.46 -0.45 - 0.18 0.19 - 0.82 0.83 - 1.74 No Data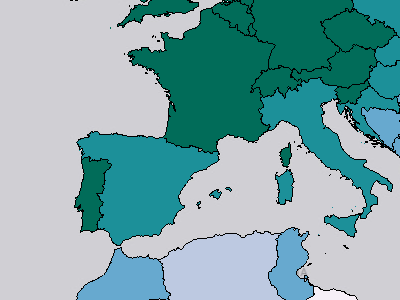
Rule of Law
Advanced Analytics / Risk and Vulnerability / Coping Capacity / Governance / Rule of Law
Rule of law captures perceptions of the extent to which agents have confidence in and abide by the rules of society, and in particular the quality of contract enforcement, property rights, the police, and the courts, as well as the likelihood of crime and violence.
Legend
-2.21% - -1.44% -1.43% - -0.67% -0.66% - 0.09% 0.10% - 0.94% 0.95% - 1.97% No Data
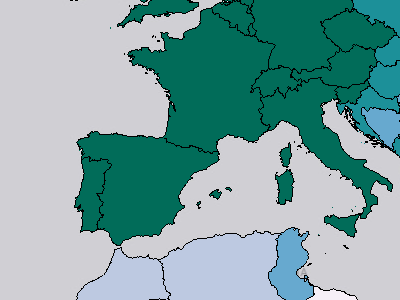
Voice and Accountability
Advanced Analytics / Risk and Vulnerability / Coping Capacity / Governance / Voice and Accountability
Voice and accountability captures perceptions of the extent to which a country's citizens are able to participate in selecting their government, as well as freedom of expression, freedom of association, and a free media.
Legend
-1.98 - -1.15 -1.14 - -0.44 -0.43 - 0.25 0.26 - 0.91 0.92 - 1.78 No Data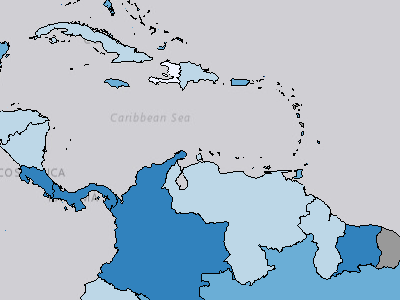
Communication Index
Advanced Analytics / Risk and Vulnerability / Coping Capacity / Infrastructure / Communication / Communication Index
The Communication Index combines indicator data for Fixed Phone Access, Mobile Phone Access, and Internet Server Access. The Communication Index is part of the Coping Capacity Index. Values range from 0-1, with 1 representing a higher coping capacity.
Legend
 Very Low
 Low
 Moderate
 High
 Very High No Data
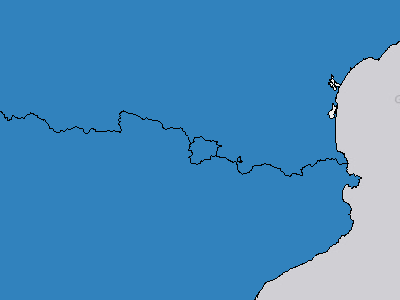
Fixed Phone Access
Advanced Analytics / Risk and Vulnerability / Coping Capacity / Infrastructure / Communication / Fixed Phone Access
Fixed telephone subscriptions (per 100 people)
Legend
0.00 - 7.30 per 100 people 7.31 - 19.30 per 100 people 19.31 - 35.60 per 100 people 35.61 - 63.90 per 100 people 63.91 - 111.00 per 100 people No Data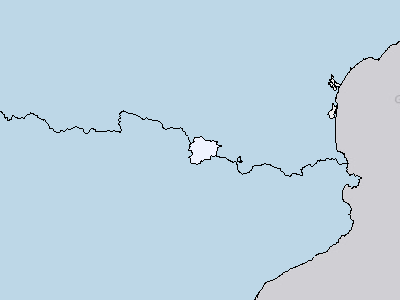
Internet Server Access
Advanced Analytics / Risk and Vulnerability / Coping Capacity / Infrastructure / Communication / Internet Server Access
Secure Internet servers (per 1 million people)
Legend
0.29 - 23,603.60 per 1 million people 23,603.61 - 96,899.80 per 1 million people 96,899.81 - 261,262.41 per 1 million people 261,262.42 - 557,174.25 per 1 million people 557,174.26 - 1,982,403.49 per 1 million people No Data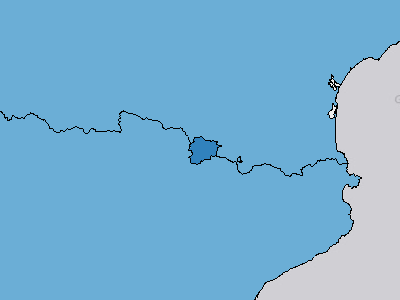
Mobile Phone Access
Advanced Analytics / Risk and Vulnerability / Coping Capacity / Infrastructure / Communication / Mobile Phone Access
Mobile cellular subscriptions (per 100 people)
Legend
3.90 - 70.18 per 100 people 70.19 - 104.06 per 100 people 104.07 - 131.59 per 100 people 131.60 - 168.98 per 100 people 168.99 - 291.91 per 100 people No Data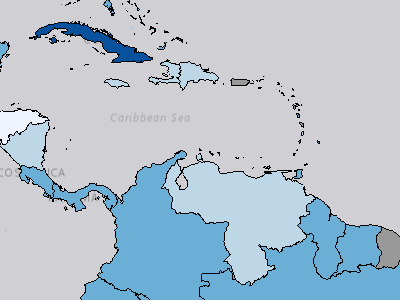
Healthcare Index
Advanced Analytics / Risk and Vulnerability / Coping Capacity / Infrastructure / Healthcare / Healthcare Index
The Healthcare Index combines indicator data for Hospital Bed Density, Nurses and Midwives, and Physicians. The Healthcare Index is part of the Coping Capacity Index. Values range from 0-1, with 1 representing a higher coping capacity.
Legend
Very Low Low Moderate High Very High No Data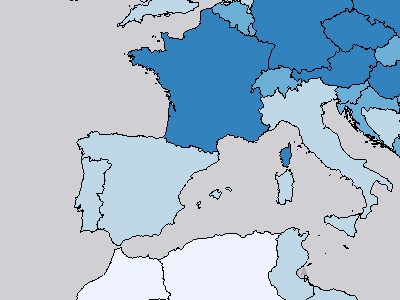
Hospital Bed Density
Advanced Analytics / Risk and Vulnerability / Coping Capacity / Infrastructure / Healthcare / Hospital Bed Density
Hospital Bed Density (per 1,000 people)
Legend
0.17 - 1.74 per 1,000 people 1.75 - 3.53 per 1,000 people 3.54 - 5.68 per 1,000 people 5.69 - 10.55 per 1,000 people 10.56 - 22.02 per 1,000 people No Data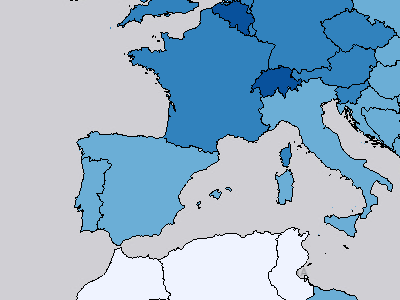
Nurses and Midwives
Advanced Analytics / Risk and Vulnerability / Coping Capacity / Infrastructure / Healthcare / Nurses and Midwives
Nurses and midwives (per 1,000 people)
Legend
0.11 - 2.52 per 1,000 people 2.53 - 5.03 per 1,000 people 5.04 - 8.53 per 1,000 people 8.54 - 14.40 per 1,000 people 14.41 - 22.32 per 1,000 people No Data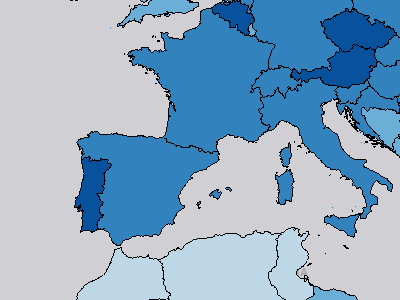
Physicians
Advanced Analytics / Risk and Vulnerability / Coping Capacity / Infrastructure / Healthcare / Physicians
Physicians (per 1,000 people)
Legend
0.02 - 0.60 per 1,000 people 0.61 - 1.73 per 1,000 people 1.74 - 3.17 per 1,000 people 3.18 - 4.95 per 1,000 people 4.96 - 8.43 per 1,000 people No Data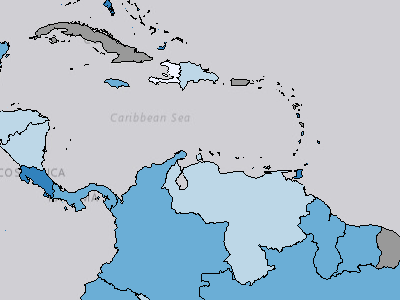
Infrastructure Index
Advanced Analytics / Risk and Vulnerability / Coping Capacity / Infrastructure / Infrastructure Index
The Infrastructure Index combines data for Communication Index, Healthcare Index, and Transportation Index. The Infrastructure Index is part of the Coping Capacity Index. Values range from 0-1, with 1 representing a higher coping capacity.
Legend
Very Low Low Moderate High Very High No Data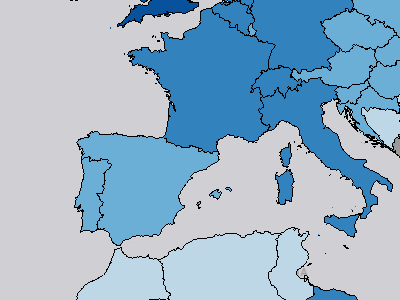
Transportation Index
Advanced Analytics / Risk and Vulnerability / Coping Capacity / Infrastructure / Transportation / Transportation Index
Combination of Airport, Seaport, Road, and Railroad Density
Legend
0.01 - 0.23 0.24 - 0.39 0.40 - 0.58 0.59 - 0.80 0.81 - 1.00 <excluded>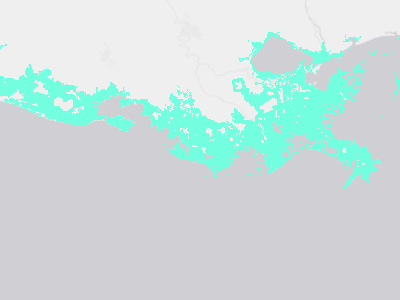
Coastal Flooding Hazard Zone
Advanced Analytics / Risk and Vulnerability / Hazard Exposure / Hazard Zones / Coastal Flooding Hazard Zone
Areas at risk of coastal flooding by 2050.
Legend
 (no label)
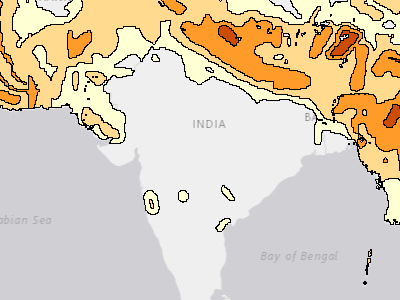
Earthquake Hazard Zone
Advanced Analytics / Risk and Vulnerability / Hazard Exposure / Hazard Zones / Earthquake Hazard Zone
Areas at risk of earthquake.
Legend
 5 MMI
 6 MMI
 7 MMI
 8 MMI
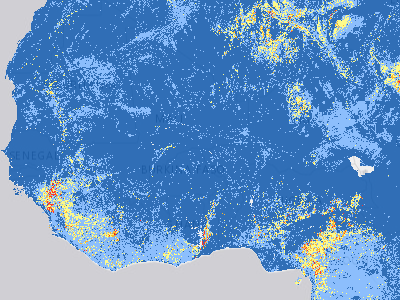
Landslide Hazard Zone
Advanced Analytics / Risk and Vulnerability / Hazard Exposure / Hazard Zones / Landslide Hazard Zone
NASA's global landslide susceptibility map.
Legend
 (no label) Very Low Low Moderate High Very High
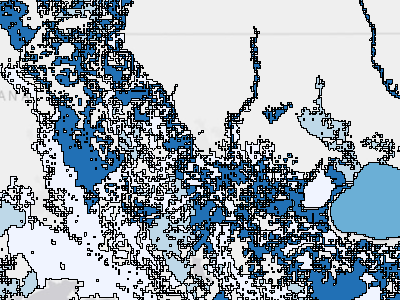
River Flooding Hazard Zone
Advanced Analytics / Risk and Vulnerability / Hazard Exposure / Hazard Zones / River Flooding Hazard Zone
Areas at risk of river flooding by 2050.
Legend
 Low
 Moderate
 High
 Extreme
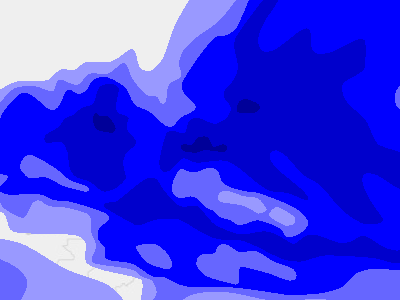
Storm Intensity Zones
Advanced Analytics / Risk and Vulnerability / Hazard Exposure / Hazard Zones / Storm Intensity Zones
Tropical storm intensity zones.
Legend
 Cat 1 (118 - 153 km/hr)
 Cat 2 (154 - 177 km/hr)
 Cat 3 (178 - 209 km/hr)
 Cat 4 (210 - 249 km/hr)
 Cat 5 (250+ km/hr)
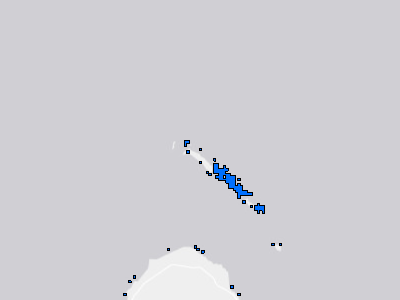
Tsunami Hazard Zone
Advanced Analytics / Risk and Vulnerability / Hazard Exposure / Hazard Zones / Tsunami Hazard Zone
Areas at risk of tsunami.
Legend
 (no label)
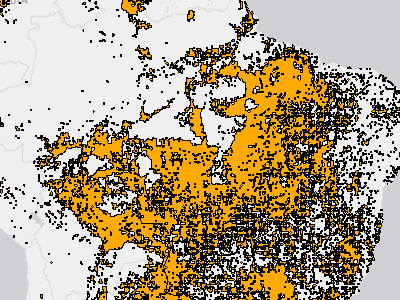
Wildfire Hazard Zone
Advanced Analytics / Risk and Vulnerability / Hazard Exposure / Hazard Zones / Wildfire Hazard Zone
Areas at risk of wildfire.
Legend
 (no label)
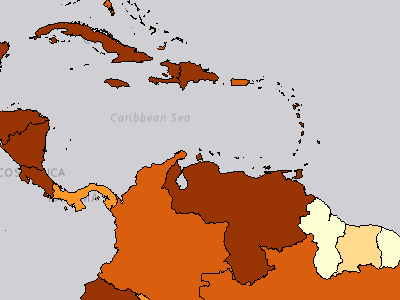
Multi-Hazard Exposure Index
Advanced Analytics / Risk and Vulnerability / Hazard Exposure / Multi-Hazard Exposure Index
The Multi-hazard Exposure Index averages the Raw Multi-hazard Exposure and Relative Multi-hazard Exposure indices. Values are scaled from 0 to 1 with 0 being the lowest exposure and 1 representing the highest exposure. This index provides a value for comparison across countries of overall exposure encompassing both extent (raw) and importance (relative) of hazard exposures.
Legend
Very Low Low
 Moderate
 High
 Very High No Data
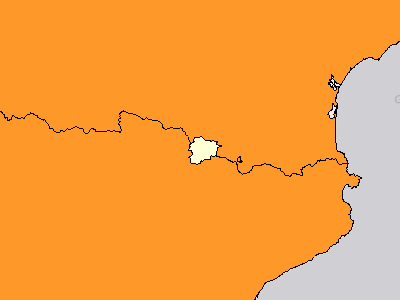
Raw Multi-Hazard Economic Exposure
Advanced Analytics / Risk and Vulnerability / Hazard Exposure / Raw Multi-Hazard Exposure / Raw Multi-Hazard Economic Exposure
Raw Multi-Hazard Economic Exposure depicts the total estimated replacement cost of buildings within one or more of the hazard zones: tropical cyclone winds (Saffir-Simpson categories 1-5), drought, earthquakes, landslides, tsunami run-up, riverine flood, volcanoes, and wildfire. Raw Economic Exposure provides a value of how much capital stock is estimated to be in a hazard zone, which can assist in planning and provides a snapshot of the scale of a country’s exposure.
Legend
$17,600,100 - 857,544,368,800 $857,544,368,801 - 2,978,371,091,600 $2,978,371,091,601 - 6,973,108,957,400 $6,973,108,957,401 - 12,363,008,044,600 $12,363,008,044,601 - 136,197,037,508,200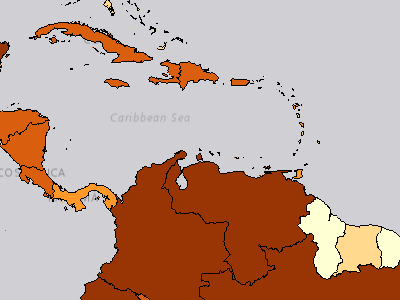
Raw Multi-Hazard Exposure Index
Advanced Analytics / Risk and Vulnerability / Hazard Exposure / Raw Multi-Hazard Exposure / Raw Multi-Hazard Exposure Index
The Raw Multi-hazard Exposure Index is the average of the scaled Raw Population and Raw Economic Exposure Indicators. Values are scaled from 0 to 1 with 0 being the lowest exposure and 1 representing the highest exposure. Raw Multi-hazard Exposure provides a value for comparison across countries of how much population and capital stock is estimated to be in a hazard zone which can assist in planning and provides a snapshot of the scale of a country’s exposure.
Legend
Very Low Low Moderate High Very High No Data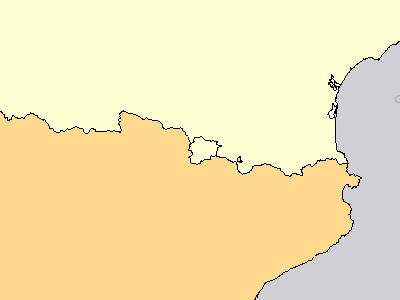
Raw Multi-Hazard Population Exposure
Advanced Analytics / Risk and Vulnerability / Hazard Exposure / Raw Multi-Hazard Exposure / Raw Multi-Hazard Population Exposure
Raw Multi-Hazard Population Exposure is based on the total estimated population within one or more of hazard zones: tropical cyclone winds (Saffir-Simpson categories 1-5), drought, earthquakes, landslides, tsunami run-up, riverine flood, volcanoes, and wildfire. Raw Population Exposure provides a value of how many persons are estimated to be in a hazard zone, which can assist in planning and provides a snapshot of the scale of a country’s exposure.
Legend
1,621 - 34,075,138 people 34,075,139 - 95,269,054 people 95,269,055 - 333,845,055 people 333,845,056 - 576,562,191 people 576,562,192 - 2,348,013,732 people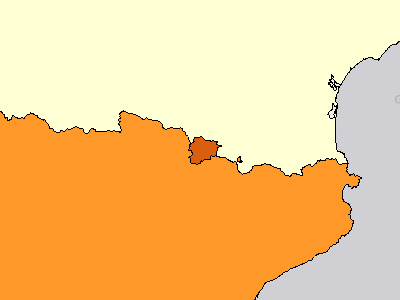
Relative Multi-Hazard Economic Exposure
Advanced Analytics / Risk and Vulnerability / Hazard Exposure / Relative Multi-Hazard Exposure / Relative Multi-Hazard Economic Exposure
Relative Multi-Hazard Economic Exposure depicts the proportion of a country's total estimated replacement cost of buildings within one or more of the hazard zones: tropical cyclone winds (Saffir-Simpson categories 1-5), drought, earthquakes, landslides, tsunami run-up, riverine flood, volcanoes, and wildfire. Relative Economic Exposure highlights the scale and importance of exposure. This provides information to assist with potential prio
Legend
0.48% - 43.44% 43.45% - 91.80% 91.81% - 153.02% 153.03% - 244.57% 244.58% - 466.00%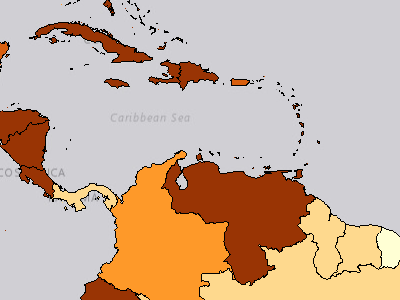
Relative Multi-Hazard Exposure Index
Advanced Analytics / Risk and Vulnerability / Hazard Exposure / Relative Multi-Hazard Exposure / Relative Multi-Hazard Exposure Index
The Relative Multi-hazard Exposure Index is the average of the scaled Relative Population and Relative Economic Exposure Indicators. Values are scaled from 0 to 1 with 0 being the lowest exposure and 1 representing the highest exposure. Relative Multi-hazard Exposure provides a value for comparison across countries of the scale and importance of exposure. This provides information to assist with potential prioritization of resources.
Legend
Very Low Low Moderate High Very High No DataRelative Multi-Hazard Population Exposure
Advanced Analytics / Risk and Vulnerability / Hazard Exposure / Relative Multi-Hazard Exposure / Relative Multi-Hazard Population Exposure
Relative Multi-Hazard Population Exposure depicts the proportion of a country's total population within within one or more of the hazard zones: tropical cyclone winds (Saffir-Simpson categories 1-5), drought, earthquakes, landslides, tsunami run-up, riverine flood, volcanoes, and wildfire.. Relative Population Exposure highlights the scale and importance of exposure. This provides information to assist with potential prioritization of res
Legend
2.34% - 56.52% 56.53% - 106.31% 106.32% - 168.10% 168.11% - 255.94% 255.95% - 431.91%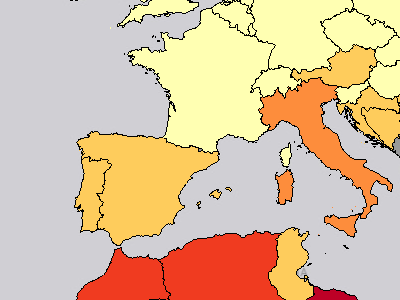
Multi-Hazard Risk Index
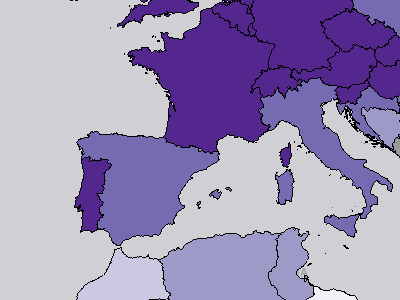
Advanced Analytics / Risk and Vulnerability / Multi-Hazard Risk Index
The Multi Hazard Risk Index combines Multi Hazard Exposure, Vulnerability, and Coping Capacity. Values range from 0 to 1, with 1 representing higher risk.
Legend
 Very Low
 Low
 Moderate
 High
 Very High No Data
Resilience Index
Advanced Analytics / Risk and Vulnerability / Resilience Index
The Resilience Index is hazard-independent, combining the Vulnerability Index and Coping Capacity Index. Values range from 0 to 1, with 1 indicating the combination of low susceptibility to negative disaster impacts and high capacity to prepare for, respond to, and recover from disasters.
Legend
 Very Low
 Low
 Moderate
 High
 Very High No Data
Access to Information Index
Advanced Analytics / Risk and Vulnerability / Vulnerability / Access to Information / Access to Information Index
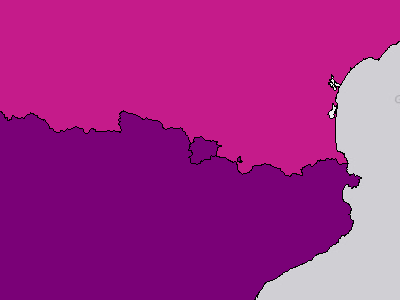
The Access to Information Index combines data for Access to Internet, Adult Literacy, and Mean Years Schooling. The Access to Information Index is part of the Vulnerability Index. Values range from 0-1, with 1 representing a higher vulnerability.
Legend
 Very Low
 Low
 Moderate
 High
 Very High No Data
Access to Internet
Advanced Analytics / Risk and Vulnerability / Vulnerability / Access to Information / Access to Internet
Individuals using the Internet (% of population)
Legend
 0.00% - 27.60%
 27.61% - 50.11%
 50.12% - 73.84%
 73.85% - 88.00%
 88.01% - 100.00% No Data
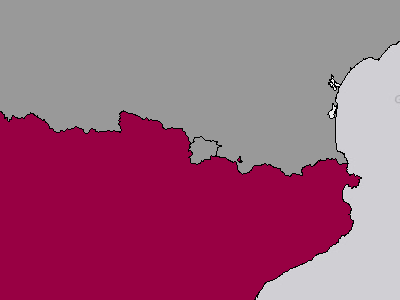
Adult Literacy
Advanced Analytics / Risk and Vulnerability / Vulnerability / Access to Information / Adult Literacy
Literacy rate, adult total (% of people ages 15 and above)
Legend
27.28% - 48.64% 48.65% - 68.08% 68.09% - 83.78% 83.79% - 94.37% 94.38% - 100.00% No Data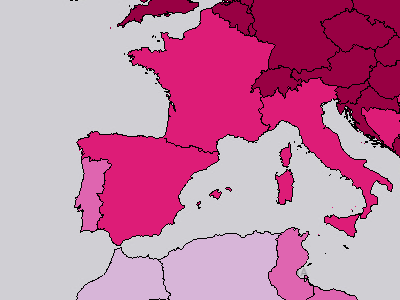
Mean Years Schooling
Advanced Analytics / Risk and Vulnerability / Vulnerability / Access to Information / Mean Years Schooling
Mean Years of Schooling (years)
Legend
1.34 - 4.59 years 4.60 - 7.44 years 7.45 - 9.89 years 9.90 - 11.93 years 11.94 - 14.26 years No Data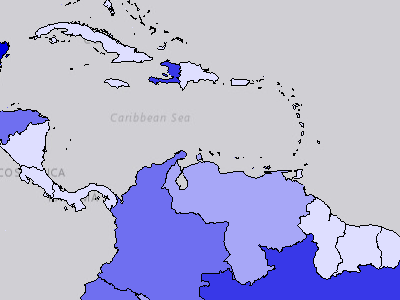
Conflict Deaths Index
Advanced Analytics / Risk and Vulnerability / Vulnerability / Conflict Impacts / Conflict Deaths / Conflict Deaths Index
The Conflict Deaths Index combines indicator data for Recent Conflict Deaths. The Conflict Deaths Index is part of the Vulnerability Index. Values range from 0-1, with 1 representing a higher vulnerability.
Legend
 Very Low
 Low
 Moderate
 High
 Very High No Data
Recent Conflict Deaths
Advanced Analytics / Risk and Vulnerability / Vulnerability / Conflict Impacts / Conflict Deaths / Recent Conflict Deaths
Recent conflict deaths per million population (past 5 years). Conflict types: one-sided violence, non-state conflict violence, battle-related deaths
Legend
0 - 58 per million persons 59 - 257 per million persons 258 - 916 per million persons 917 - 2,201 per million persons 2,202 - 15,742 per million persons No Data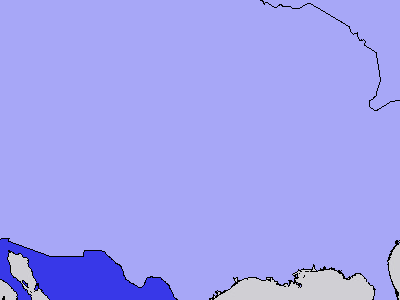
Conflict Impacts Index
Advanced Analytics / Risk and Vulnerability / Vulnerability / Conflict Impacts / Conflict Impacts Index
The Conflict Impacts Index combines data for Displaced Persons Index, and Conflict Deaths Index. The Conflict Impacts Index is part of the Vulnerability Index. Values range from 0-1, with 1 representing a higher vulnerability.
Legend
Very Low Low Moderate High Very High No Data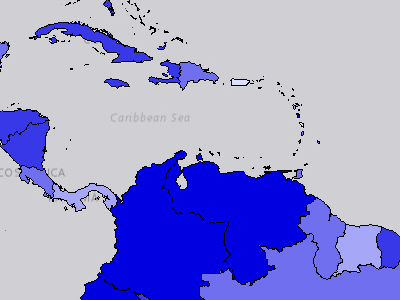
Displaced Persons Index
Advanced Analytics / Risk and Vulnerability / Vulnerability / Conflict Impacts / Displaced Persons / Displaced Persons Index
The Displaced Persons Index combines indicator data for Internally Displaced Persons, Refugees by Asylum Country, and Refugees by Origin Country. The Displaced Persons Index is part of the Vulnerability Index. Values range from 0-1, with 1 representing a higher vulnerability.
Legend
Very Low Low Moderate High Very High No DataInternally Displaced Persons
Advanced Analytics / Risk and Vulnerability / Vulnerability / Conflict Impacts / Displaced Persons / Internally Displaced Persons
Internally displaced persons due to conflict per 1,000 population
Legend
0.00 - 3.03 per 1,000 3.04 - 17.86 per 1,000 17.87 - 48.66 per 1,000 48.67 - 116.42 per 1,000 116.43 - 318.54 per 1,000 No Data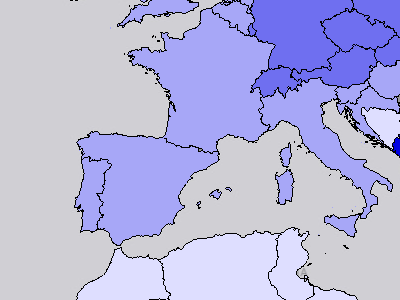
Refugees by Asylum Country
Advanced Analytics / Risk and Vulnerability / Vulnerability / Conflict Impacts / Displaced Persons / Refugees by Asylum Country
Number of refugees by country of asylum per 1,000 population
Legend
0.00 - 4.60 per 1,000 4.61 - 16.08 per 1,000 16.09 - 34.83 per 1,000 34.84 - 60.28 per 1,000 60.29 - 136.86 per 1,000 No DataRefugees by Origin Country
Advanced Analytics / Risk and Vulnerability / Vulnerability / Conflict Impacts / Displaced Persons / Refugees by Origin Country
Number of refugees and asylum seekers by country of origin per 1,000 population
Legend
0.00 - 2.39 per 1,000 2.40 - 8.02 per 1,000 8.03 - 24.80 per 1,000 24.81 - 56.64 per 1,000 56.65 - 284.11 per 1,000 No Data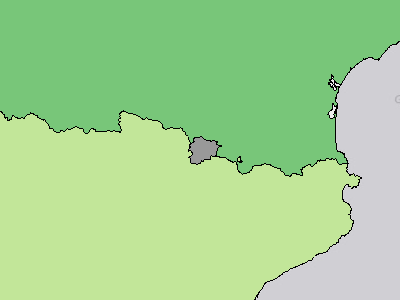
Age Dependency Ratio
Advanced Analytics / Risk and Vulnerability / Vulnerability / Economic Constraints / Age Dependency Ratio
Age dependency ratio (% of working-age population)
Legend
20.10% - 42.80% 42.81% - 53.52% 53.53% - 65.46% 65.47% - 81.89% 81.90% - 105.18% No Data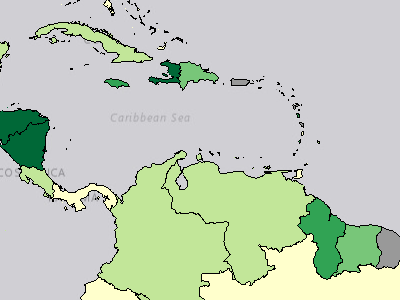
Economic Constraints Index
Advanced Analytics / Risk and Vulnerability / Vulnerability / Economic Constraints / Economic Constraints Index
The Economic Constraints Index combines indicator data for Age Dependency Ratio, Import Export Parity, Net ODA Received as Percent of GNI, and Remittances as Percent of GDP. The Economic Constraints Index is part of the Vulnerability Index. Values range from 0-1, with 1 representing a higher vulnerability.
Legend
Very Low Low Moderate High Very High No Data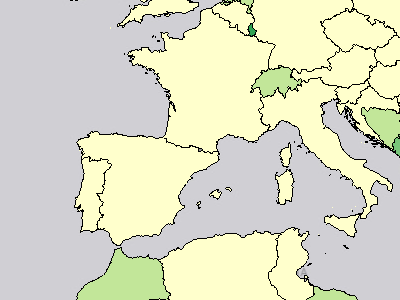
Import Export Parity
Advanced Analytics / Risk and Vulnerability / Vulnerability / Economic Constraints / Import Export Parity
Ratio of exports and imports of goods and services (% of GDP) calculated by ABS([Exports] - [Imports]).
Legend
0.05 - 7.10 7.11 - 15.14 15.15 - 28.78 28.79 - 47.21 47.22 - 85.01 No Data
Net ODA Received as Percent of GNI
Advanced Analytics / Risk and Vulnerability / Vulnerability / Economic Constraints / Net ODA Received as Percent of GNI
Net ODA received (% of GNI)
Legend
-8.19% - 3.49% 3.50% - 10.60% 10.61% - 22.06% 22.07% - 38.03% 38.04% - 79.85% No Data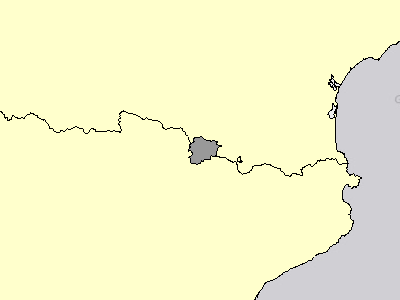
Remittances as Percent of GDP
Advanced Analytics / Risk and Vulnerability / Vulnerability / Economic Constraints / Remittances as Percent of GDP
Personal remittances, received (% of GDP)
Legend
0.00% - 2.30% 2.31% - 6.57% 6.58% - 13.95% 13.96% - 24.09% 24.10% - 41.94% No Data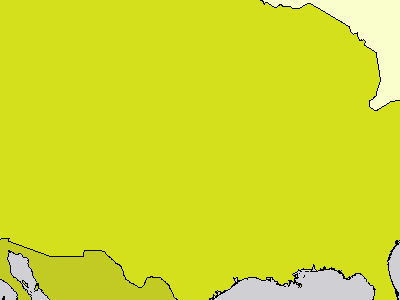
Economic Inequality Index
Advanced Analytics / Risk and Vulnerability / Vulnerability / Marginalization / Economic Inequality / Economic Inequality Index
The Economic Inequality Index shows indicator data for GINI Coefficient. The Economic Inequality Index is part of the Vulnerability Index. Values range from 0-1, with 1 representing a higher vulnerability.
Legend
 Very Low
 Low
 Moderate
 High
 Very High No Data
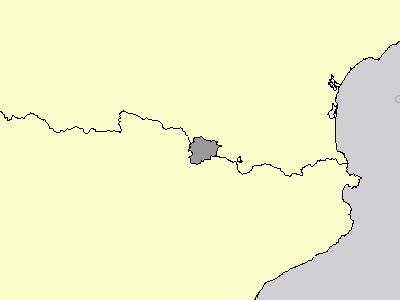
GINI Coefficient
Advanced Analytics / Risk and Vulnerability / Vulnerability / Marginalization / Economic Inequality / GINI Coefficient
Gini index
Legend
24 - 30 31 - 35 36 - 40 41 - 47 48 - 63 No Data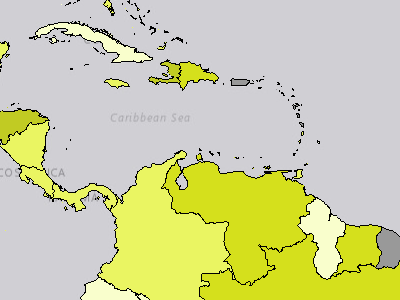
Gender Inequality Index
Advanced Analytics / Risk and Vulnerability / Vulnerability / Marginalization / Gender Inequality / Gender Inequality Index
The Gender Inequality Index combines indicator data for Labor Force Participation Gender Parity, Proportion of Female Seats in Parliament, and Secondary Enrollment Gender Parity. The Gender Inequality Index is part of the Vulnerability Index. Values range from 0-1, with 1 representing a higher vulnerability.
Legend
Very Low Low Moderate High Very High No Data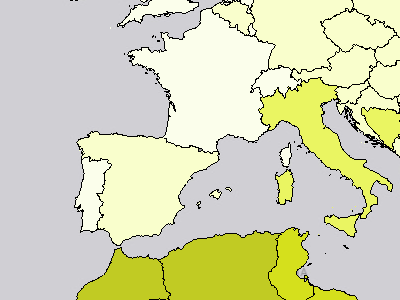
Labor Force Participation Gender Parity
Advanced Analytics / Risk and Vulnerability / Vulnerability / Marginalization / Gender Inequality / Labor Force Participation Gender Parity
Distance from gender parity of labor force participation rate (population ages 15+) (modeled ILO estimate)
Legend
0.02 - 0.14 0.15 - 0.26 0.27 - 0.41 0.42 - 0.65 0.66 - 0.93 No Data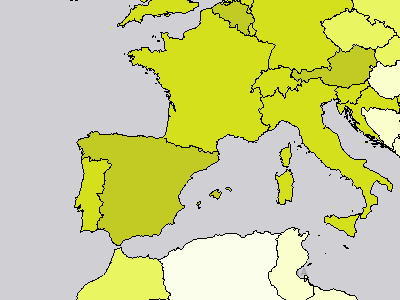
Proportion of Female Seats in Parliament
Advanced Analytics / Risk and Vulnerability / Vulnerability / Marginalization / Gender Inequality / Proportion of Female Seats in Parliament
Proportion of seats held by women in national parliaments (%)
Legend
0.00% - 11.76% 11.77% - 21.57% 21.58% - 30.68% 30.69% - 40.00% 40.01% - 61.25% No Data
Secondary Enrollment Gender Parity
Advanced Analytics / Risk and Vulnerability / Vulnerability / Marginalization / Gender Inequality / Secondary Enrollment Gender Parity
School enrollment, secondary (gross), gender parity index (GPI)
Legend
0.00 - 0.05 0.06 - 0.11 0.12 - 0.19 0.20 - 0.33 0.34 - 0.54 No Data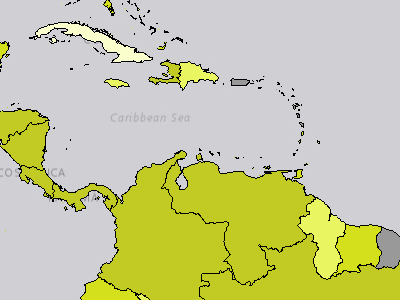
Marginalization Index
Advanced Analytics / Risk and Vulnerability / Vulnerability / Marginalization / Marginalization Index
The Marginalization Index combines data for Economic Inequality Index, and the Gender Inequality Index. The Marginalization Index is part of the Vulnerability Index. Values range from 0-1, with 1 representing a higher vulnerability.
Legend
Very Low Low Moderate High Very High No Data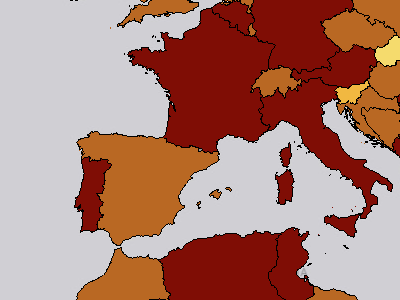
Dietary Energy Supply
Advanced Analytics / Risk and Vulnerability / Vulnerability / Population Pressures / Food Insecurity / Dietary Energy Supply
Average dietary energy supply adequacy (percent) (3-year average)
Legend
 81.00% - 103.00%
 103.01% - 117.00%
 117.01% - 129.00%
 129.01% - 141.00%
 141.01% - 161.00% No Data
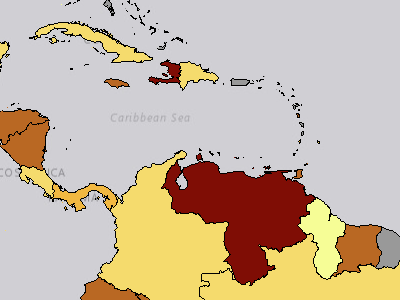
Food Insecurity Index
Advanced Analytics / Risk and Vulnerability / Vulnerability / Population Pressures / Food Insecurity / Food Insecurity Index
The Food Insecurity Index combines indicator data for Dietary Energy Supply, and Undernourishment Prevalence. The Food Insecurity Index is part of the Vulnerability Index. Values range from 0-1, with 1 representing a higher vulnerability.
Legend
Very Low Low Moderate High Very High No Data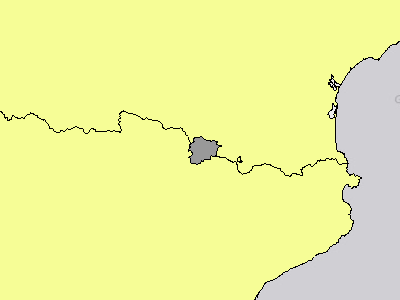
Undernourishment Prevalence
Advanced Analytics / Risk and Vulnerability / Vulnerability / Population Pressures / Food Insecurity / Undernourishment Prevalence
Prevalence of undernourishment (percent) (3-year average)
Legend
2.50% - 4.80% 4.81% - 9.60% 9.61% - 17.60% 17.61% - 28.40% 28.41% - 51.30% No Data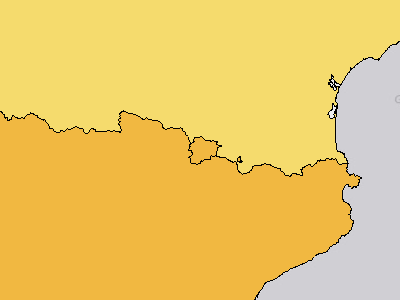
Average Annual Population Change
Advanced Analytics / Risk and Vulnerability / Vulnerability / Population Pressures / Population Change / Average Annual Population Change
Population growth (annual %)
Legend
-8.42% - -2.84% -2.83% - 0.51% 0.52% - 1.81% 1.82% - 3.38% 3.39% - 6.53% No DataAverage Annual Urban Population Change
Advanced Analytics / Risk and Vulnerability / Vulnerability / Population Pressures / Population Change / Average Annual Urban Population Change
Urban population growth (annual %)
Legend
-8.17% - -1.44% -1.43% - 0.95% 0.96% - 2.27% 2.28% - 3.75% 3.76% - 7.27% No Data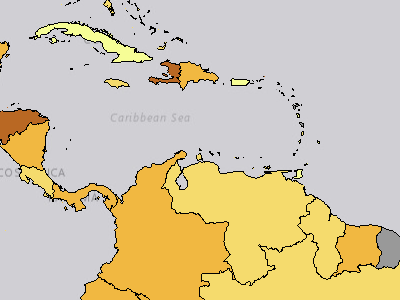
Population Change Index
Advanced Analytics / Risk and Vulnerability / Vulnerability / Population Pressures / Population Change / Population Change Index
The Population Change Index combines indicator data for Average Annual Population Change, and Average Annual Urban Population Change. The Population Change Index is part of the Vulnerability Index. Values range from 0-1, with 1 representing a higher vulnerability.
Legend
Very Low Low Moderate High Very High No Data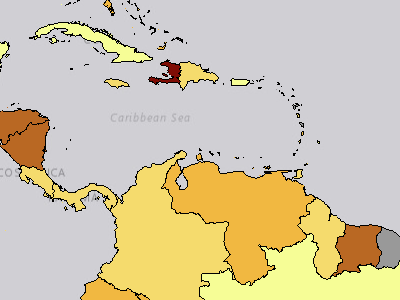
Population Pressures Index
Advanced Analytics / Risk and Vulnerability / Vulnerability / Population Pressures / Population Pressures Index
The Population Pressures Index combines indicator data for Food Insecurity Index, Population Change Index, and the Youth Bulge and Unemployment Index. The Population Pressures Index is part of the Vulnerability Index. Values range from 0-1, with 1 representing a higher vulnerability.
Legend
Very Low Low Moderate High Very High No Data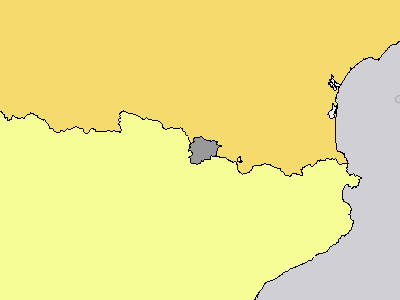
Youth Bulge
Advanced Analytics / Risk and Vulnerability / Vulnerability / Population Pressures / Youth Bulge and Unemployment / Youth Bulge
Youth Bulge is percent of population ages 15-24.
Legend
7.72% - 11.70% 11.71% - 14.93% 14.94% - 17.64% 17.65% - 20.01% 20.02% - 23.52% No Data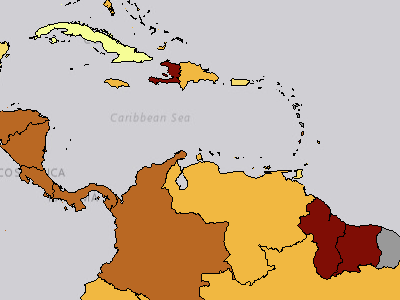
Youth Bulge and Unemployment Index
Advanced Analytics / Risk and Vulnerability / Vulnerability / Population Pressures / Youth Bulge and Unemployment / Youth Bulge and Unemployment Index
The Youth Bulge and Unemployment Index combines indicator data for Youth Unemployment, and Youth Bulge. The Youth Bulge and Unemployment Index is part of the Vulnerability Index. Values range from 0-1, with 1 representing a higher vulnerability.
Legend
Very Low Low Moderate High Very High No Data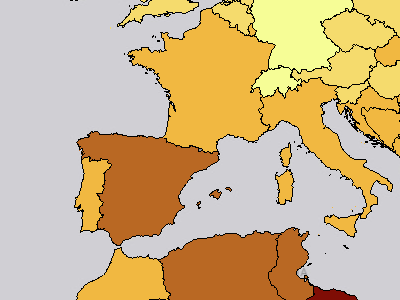
Youth Unemployment
Advanced Analytics / Risk and Vulnerability / Vulnerability / Population Pressures / Youth Bulge and Unemployment / Youth Unemployment
Unemployment, youth total (% of total labor force ages 15-24) (modeled ILO estimate)
Legend
0.42% - 7.95% 7.96% - 16.12% 16.13% - 27.27% 27.28% - 44.36% 44.37% - 76.27% No Data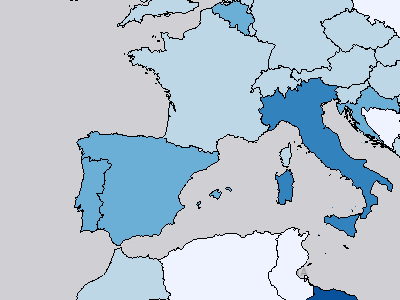
Recent Disaster Deaths
Advanced Analytics / Risk and Vulnerability / Vulnerability / Recent Disaster Impacts / Recent Disaster Deaths
Recent disaster deaths per 10,000 people (last 5 years)
Legend
0.00 - 0.46 per 10,000 0.47 - 1.97 per 10,000 1.98 - 4.34 per 10,000 4.35 - 8.93 per 10,000 8.94 - 18.17 per 10,000 No Data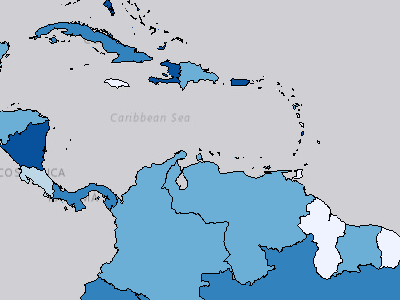
Recent Disaster Impacts Index
Advanced Analytics / Risk and Vulnerability / Vulnerability / Recent Disaster Impacts / Recent Disaster Impacts Index
The Recent Disaster Impacts Index combines indicator data for Recent Disaster Deaths, and Recent Disaster Losses as Percent of GNI. The Recent Disaster Impacts Index is part of the Vulnerability Index. Values range from 0-1, with 1 representing a higher vulnerability.
Legend
Very Low Low Moderate High Very High No Data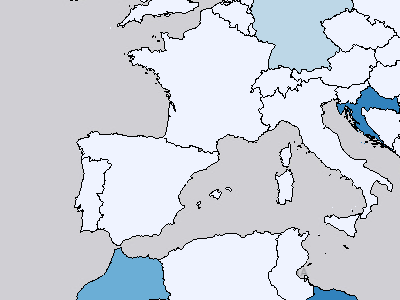
Recent Disaster Losses as Percent of GNI
Advanced Analytics / Risk and Vulnerability / Vulnerability / Recent Disaster Impacts / Recent Disaster Losses as Percent of GNI
Losses (damages) as a percentage of GNI (by country) that have resulted from natural disasters in the past five years.
Legend
0.00 - 0.46 % of GNI 0.47 - 2.11 % of GNI 2.12 - 7.50 % of GNI 7.51 - 18.23 % of GNI 18.24 - 46.62 % of GNI No Data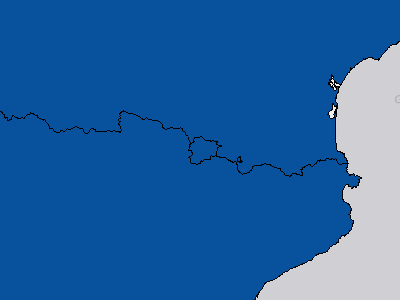
Access to Electricity
Advanced Analytics / Risk and Vulnerability / Vulnerability / Standard of Living / Access to Electricity
Access to electricity (% of population)
Legend
8.40% - 33.20% 33.21% - 57.20% 57.21% - 78.00% 78.01% - 95.00% 95.01% - 100.00% No Data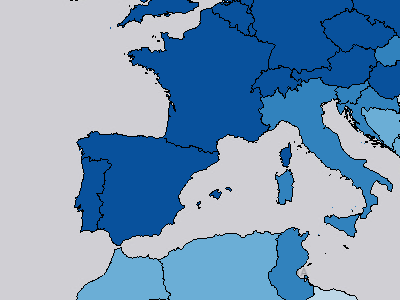
Population with Safely Managed Sanitation
Advanced Analytics / Risk and Vulnerability / Vulnerability / Standard of Living / Population with Safely Managed Sanitation
Proportion of population using safely managed improved sanitation facilities (excluding shared)
Legend
0.00% - 19.00% 19.01% - 41.00% 41.01% - 63.00% 63.01% - 85.00% 85.01% - 100.00% No DataPopulation with Safely Managed Water Source
Advanced Analytics / Risk and Vulnerability / Vulnerability / Standard of Living / Population with Safely Managed Water Source
Proportion of population using safely managed improved water supplies
Legend
6.00% - 30.00% 30.01% - 52.00% 52.01% - 69.00% 69.01% - 88.00% 88.01% - 100.00% No Data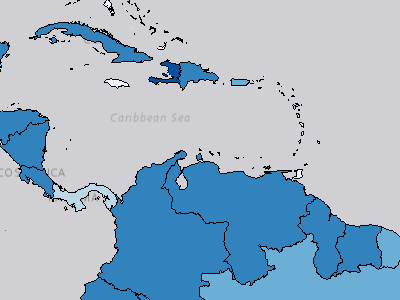
Standard of Living Index
Advanced Analytics / Risk and Vulnerability / Vulnerability / Standard of Living / Standard of Living Index
The Standard of Living Index combines indicator data for Access to Electricity, Population with Safely Managed Sanitation, and Population with Safely Managed Water Source. The Standard of Living Index is part of the Vulnerability Index. Values range from 0-1, with 1 representing a higher vulnerability.
Legend
Very Low Low Moderate High Very High No Data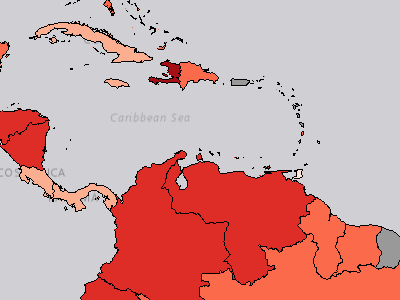
Vulnerability Index
Advanced Analytics / Risk and Vulnerability / Vulnerability / Vulnerability Index
The Vulnerability Index combines indicator data for Access to Information Index, Conflict Impacts Index, Economic Constraints Index, Marginalization Index, Population Pressures Index, Recent Disaster Impacts Index, Standard of Living Index, Vulnerable Health Status Index. Values range from 0-1, with 1 representing a higher vulnerability.
Legend
 Very Low
 Low
 Moderate
 High
 Very High No Data
Hepatitis B Incidence
Advanced Analytics / Risk and Vulnerability / Vulnerability / Vulnerable Health Status / Infectious Disease / Hepatitis B Incidence
Prevalence of the Hepatitis B surface antigen in children under five years of age
Legend
0.01% - 0.71% 0.72% - 1.75% 1.76% - 3.75% 3.76% - 6.07% 6.08% - 13.03% No Data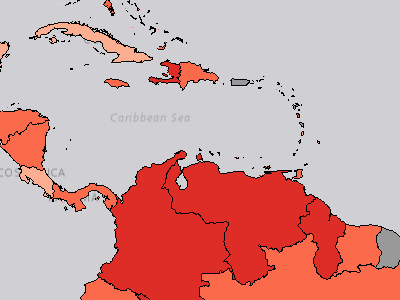
Infectious Disease Index
Advanced Analytics / Risk and Vulnerability / Vulnerability / Vulnerable Health Status / Infectious Disease / Infectious Disease Index
The Infectious Disease Index combines indicator data for Malaria Incidence, New HIV Infections, NTD Intervention, Hepatitis B Incidence, and Tuberculosis Incidence. The Infectious Disease Index is part of the Vulnerability Index. Values range from 0-1, with 1 representing a higher vulnerability.
Legend
Very Low Low Moderate High Very High No DataMalaria Incidence
Advanced Analytics / Risk and Vulnerability / Vulnerability / Vulnerable Health Status / Infectious Disease / Malaria Incidence
Malaria incidence per 1,000 population
Legend
0.00 - 24.75 per 1,000 24.76 - 68.07 per 1,000 68.08 - 147.20 per 1,000 147.21 - 258.81 per 1,000 258.82 - 363.40 per 1,000 No DataNTD Intervention
Advanced Analytics / Risk and Vulnerability / Vulnerability / Vulnerable Health Status / Infectious Disease / NTD Intervention
Number of people requiring interventions against neglected tropical diseases
Legend
0 - 4,716,388 people 4,716,389 - 14,786,109 people 14,786,110 - 36,039,903 people 36,039,904 - 92,474,258 people 92,474,259 - 622,238,663 people No Data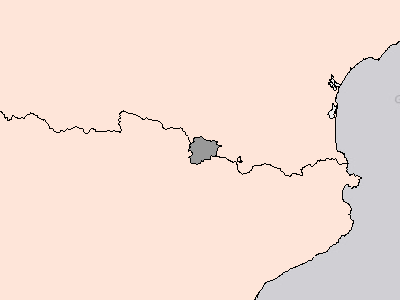
New HIV Infections
Advanced Analytics / Risk and Vulnerability / Vulnerability / Vulnerable Health Status / Infectious Disease / New HIV Infections
Number of new HIV infections per 1,000 uninfected population, by sex, age and key populations
Legend
0.00 - 0.17 per 1,000 uninfected population 0.18 - 0.48 per 1,000 uninfected population 0.49 - 1.20 per 1,000 uninfected population 1.21 - 2.20 per 1,000 uninfected population 2.21 - 4.20 per 1,000 uninfected population No DataTuberculosis Incidence
Advanced Analytics / Risk and Vulnerability / Vulnerability / Vulnerable Health Status / Infectious Disease / Tuberculosis Incidence
Tuberculosis incidence per 100,000 population
Legend
0.00 - 38.00 per 100,000 38.01 - 122.00 per 100,000 122.01 - 244.00 per 100,000 244.01 - 432.00 per 100,000 432.01 - 692.00 per 100,000 No Data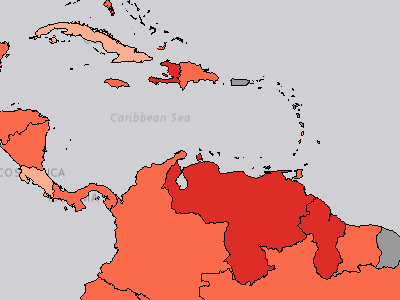
Vulnerable Health Status Index
Advanced Analytics / Risk and Vulnerability / Vulnerability / Vulnerable Health Status / Vulnerable Health Status Index
The Vulnerable Health Status Index combines indicator data for Infectious Disease Index and the Women and Children's Health Index. The Vulnerable Health Status Index is part of the Vulnerability Index. Values range from 0-1, with 1 representing a higher vulnerability.
Legend
Very Low Low Moderate High Very High No DataInfant Mortality
Advanced Analytics / Risk and Vulnerability / Vulnerability / Vulnerable Health Status / Women and Children Health / Infant Mortality
Mortality rate, infant (per 1,000 live births)
Legend
1.50 - 9.40 per 1,000 live births 9.41 - 21.80 per 1,000 live births 21.81 - 37.00 per 1,000 live births 37.01 - 53.60 per 1,000 live births 53.61 - 76.00 per 1,000 live births No Data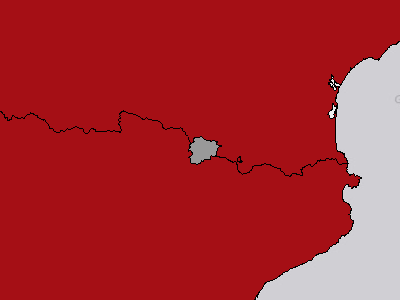
Life Expectancy at Birth
Advanced Analytics / Risk and Vulnerability / Vulnerability / Vulnerable Health Status / Women and Children Health / Life Expectancy at Birth
Life expectancy at birth, total (years)
Legend
53.00 - 60.41 years 60.42 - 66.78 years 66.79 - 72.67 years 72.68 - 78.47 years 78.48 - 84.00 years No DataMalnutrition Prevalence (Stunting)
Advanced Analytics / Risk and Vulnerability / Vulnerability / Vulnerable Health Status / Women and Children Health / Malnutrition Prevalence (Stunting)
Prevalence of stunting, height for age (modeled estimate, % of children under 5)
Legend
1.20% - 8.00% 8.01% - 15.90% 15.91% - 25.40% 25.41% - 38.60% 38.61% - 56.50% No Data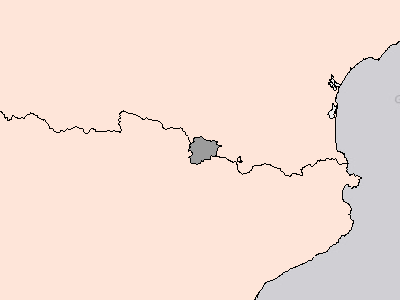
Maternal Mortality
Advanced Analytics / Risk and Vulnerability / Vulnerability / Vulnerable Health Status / Women and Children Health / Maternal Mortality
Maternal mortality ratio (modeled estimate, per 100,000 live births)
Legend
1.00 - 50.00 per 100,000 50.01 - 161.00 per 100,000 161.01 - 357.00 per 100,000 357.01 - 725.00 per 100,000 725.01 - 1223.00 per 100,000 No Data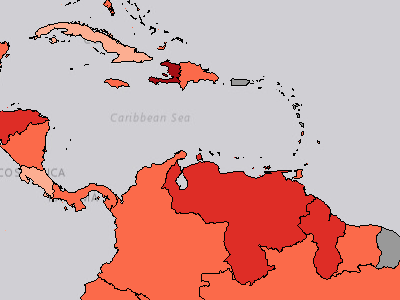
Women and Children's Health Index
Advanced Analytics / Risk and Vulnerability / Vulnerability / Vulnerable Health Status / Women and Children Health / Women and Children's Health Index
The Women and Children's Health Index combines indicator data for Life Expectancy at Birth, Maternal Mortality, Infant Mortality, Malnutrition Prevalence (Stunting). The Women and Children's Health Index is part of the Vulnerability Index. Values range from 0-1, with 1 representing a higher vulnerability.
Legend
Very Low Low Moderate High Very High No DataBackground Map Layers / ESRI ArcGIS Online Imagery (1)
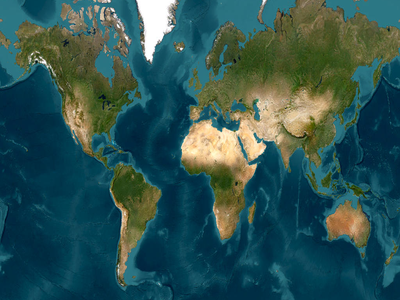
ESRI ArcGIS Online Imagery
Background Map Layers / ESRI ArcGIS Online Imagery
Background Map Layers / Mapbox Dark (1)
Mapbox Dark
Background Map Layers / Mapbox Dark
Background Map Layers / Mapbox Light (1)
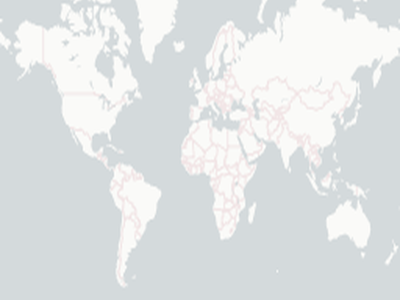
Mapbox Light
Background Map Layers / Mapbox Light
Background Map Layers / Mapbox Navigation Day (1)
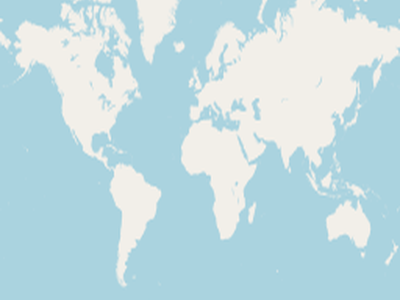
Mapbox Navigation Day
Background Map Layers / Mapbox Navigation Day
Background Map Layers / Mapbox Navigation Night (1)
Mapbox Navigation Night
Background Map Layers / Mapbox Navigation Night
Background Map Layers / Mapbox Outdoors (1)
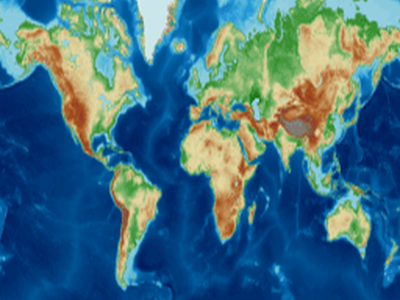
Mapbox Outdoors
Background Map Layers / Mapbox Outdoors
Background Map Layers / Mapbox Satellite Streets (1)
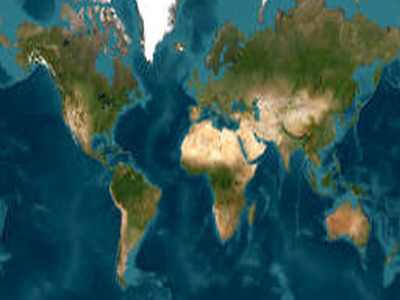
Mapbox Satellite Streets
Background Map Layers / Mapbox Satellite Streets
Background Map Layers / Mapbox Streets (1)
Mapbox Streets
Background Map Layers / Mapbox Streets
Background Map Layers / OSM Basic (1)
OSM Basic
Background Map Layers / OSM Basic
Background Map Layers / OSM Black and White (1)
OSM Black and White
Background Map Layers / OSM Black and White
Background Map Layers / OSM Blue (1)
OSM Blue
Background Map Layers / OSM Blue
Background Map Layers / OSM Dark Mode (1)
OSM Dark Mode
Background Map Layers / OSM Dark Mode
Background Map Layers / OSM Enhanced (1)
OSM Enhanced
Background Map Layers / OSM Enhanced
Background Map Layers / OSM Gray (1)
OSM Gray
Background Map Layers / OSM Gray
Background Map Layers / OSM Terrain (1)
OSM Terrain
Background Map Layers / OSM Terrain
Background Map Layers / OSM Terrain Gray (1)
OSM Terrain Gray
Background Map Layers / OSM Terrain Gray
Background Map Layers / PDC Default Basemap (1)
PDC Default Basemap
Background Map Layers / PDC Default Basemap
Current Observations & Forecasts / Atmospheric (1)

Global Clouds
Current Observations & Forecasts / Atmospheric / Global Clouds
Current Observations & Forecasts / Day (1)
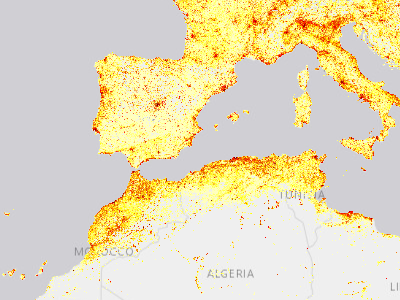
Day/Night Population
Current Observations & Forecasts / Day/Night Population / day population
global/pdc_global_day_population_dyn
Legend
 Red: Band_1
 Green: Band_2
 Blue: Band_3
Current Observations & Forecasts / Ocean (1)
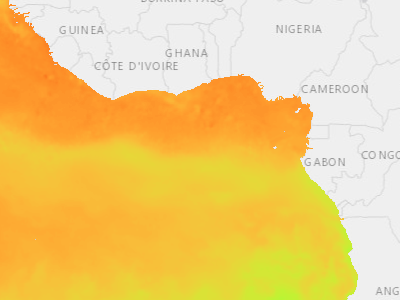
Sea Surface Temperature
Current Observations & Forecasts / Ocean / Sea Surface Temperature
global/pdc_global_sea_surface_temperature_dyn
Legend
Red: Band_1 Green: Band_2 Blue: Band_3Disaster Response Events / Middle East Conflict Response 2026 (12)
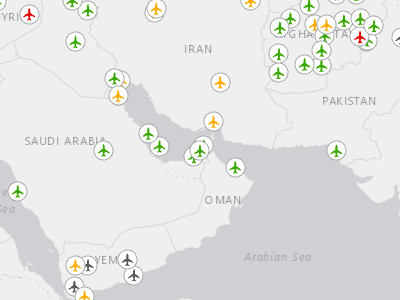
Airport Status (Middle East Conflict Response 2026)
Disaster Response Events / Middle East Conflict Response 2026 / Airport Status (Middle East Conflict Response 2026)
Airport status during the Iran Conflict 2026. Data is updated daily.
Legend
 Open
 Restricted
 Closed
 Unknown
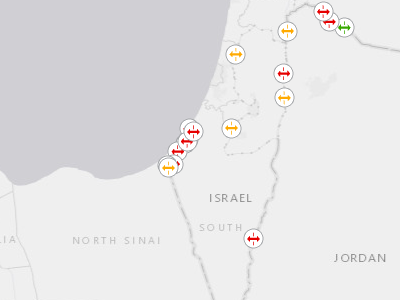
Border Crossing Status (Middle East Conflict Response 2026)
Disaster Response Events / Middle East Conflict Response 2026 / Border Crossing Status (Middle East Conflict Response 2026)
Status of border crossing locations during the Iran Conflict 2026. Data is updated daily.
Legend
 Open
 Restricted
 Closed
 Unknown
 Unspecified
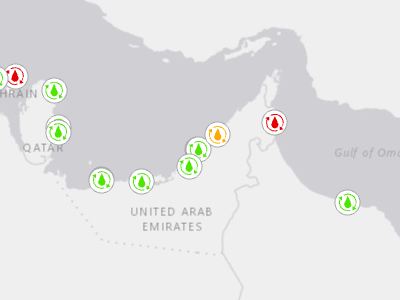
GCC Desalination Infrastructure Status (Middle East Conflict Response 2026)
Disaster Response Events / Middle East Conflict Response 2026 / GCC Desalination Infrastructure Status (Middle East Conflict Response 2026)
A consolidated, georeferenced inventory of major GCC desalination infrastructure with integrated conflict damage attribution, supporting water security analysis, infrastructure risk assessment, and humanitarian planning during the active regional conflict of early 2026.
Legend
 Confirmed Damaged
 Near Miss / Collateral Damage
 No Damage Reported
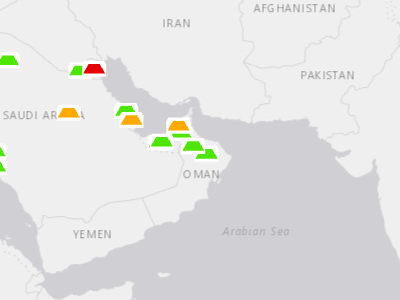
GCC Solar Infrastructure Status (Middle East Conflict Response 2026)
Disaster Response Events / Middle East Conflict Response 2026 / GCC Solar Infrastructure Status (Middle East Conflict Response 2026)
A consolidated, georeferenced inventory of major GCC solar infrastructure with integrated conflict damage attribution, supporting energy security analysis, infrastructure risk assessment, and humanitarian planning during the active regional conflict of early 2026.
Legend
 Confirmed Damaged
 Near Miss / Collateral Damage
 No Damage Reported
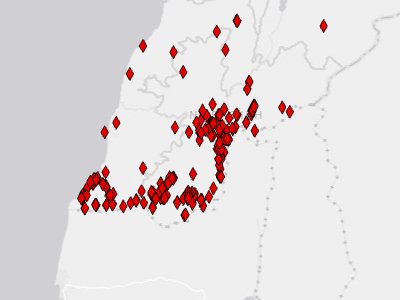
Hezbollah Attacks in Lebanon (Middle East Conflict Response 2026)
Disaster Response Events / Middle East Conflict Response 2026 / Hezbollah Attacks in Lebanon (Middle East Conflict Response 2026)
The Hezbollah Attacks in Lebanon layer consists of distinct observed or claimed Hezbollah kinetic activity conducted against Israeli ground forces in southern Lebanon. The feature consists of kinetic events that are either claimed or observed during the active regional conflict of early 2026.
Legend
 (no label)
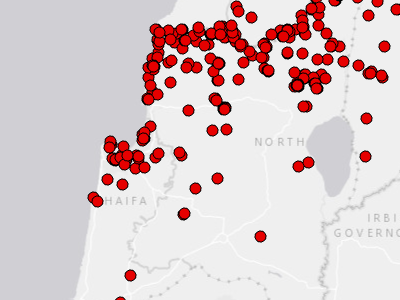
Iran and Axis Strikes (Middle East Conflict Response 2026)
Disaster Response Events / Middle East Conflict Response 2026 / Iran and Axis Strikes (Middle East Conflict Response 2026)
The Iran and Axis Response feature represents Iranian and Axis of Resistance retaliatory strikes against the US, Israel, and countries hosting US bases, and other targets, beginning February 28, 2026 through current. The feature consists of discrete kinetic events recorded by date, location, and actor. Data points are updated as additional information is available. Each point location's data contains information on how that location was confi
Legend
 (no label)
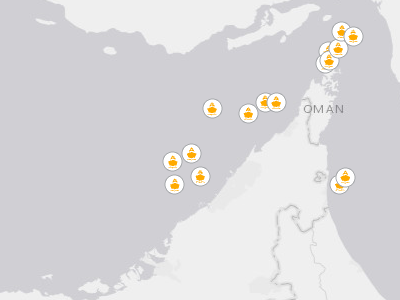
Iranian Strikes on Civilian Vessels (Middle East Conflict Response 2026)
Disaster Response Events / Middle East Conflict Response 2026 / Iranian Strikes on Civilian Vessels (Middle East Conflict Response 2026)
Iranian Strikes on Civilian Vessels represents Iranian strikes against civilian shipping vessels. The feature consists of discrete kinetic events recorded by date, location, and targeted vessel during the active regional conflict of early 2026.
Legend
 (no label)
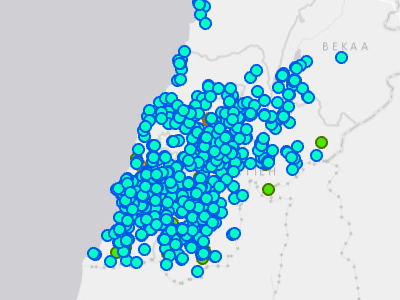
Israeli Strikes in Lebanon (Middle East Conflict Response 2026)
Disaster Response Events / Middle East Conflict Response 2026 / Israeli Strikes in Lebanon (Middle East Conflict Response 2026)
Israeli Strikes in Lebanon, beginning February 28, 2026 through current.
Legend
 Confirmed Airstrike
 Reported Airstrike
 Reported Explosion with Footage
 Reported Explosion without Footage
 Evacuation Notice
 Artillery
 Ground Advance
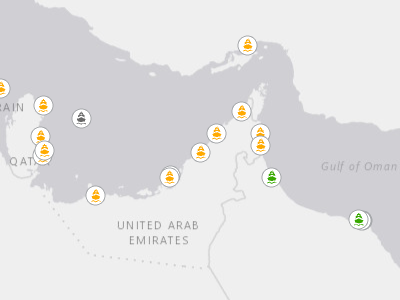
Seaport Status (Middle East Conflict Response 2026)
Disaster Response Events / Middle East Conflict Response 2026 / Seaport Status (Middle East Conflict Response 2026)
Seaport status during the Iran Conflict 2026. Data is updated daily.
Legend
 Open
 Restricted
 Closed
 Unknown
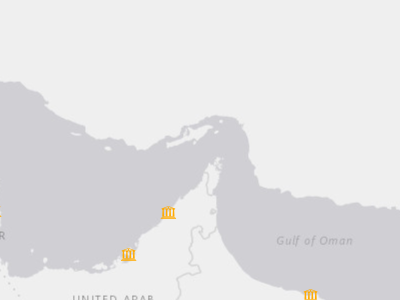
U.S. Embassy Status (Middle East Conflict Response 2026)
Disaster Response Events / Middle East Conflict Response 2026 / U.S. Embassy Status (Middle East Conflict Response 2026)
U.S. Embassy and Consulate General status in the middle east, during the Iran Conflict of 2026. Status is checked twice daily (morning and afternoon) via State Department Embassy alerts.
Legend
 Closed/Not Operating
 Open with Heightened Security/Limited Operations
 Open/Normal Operations
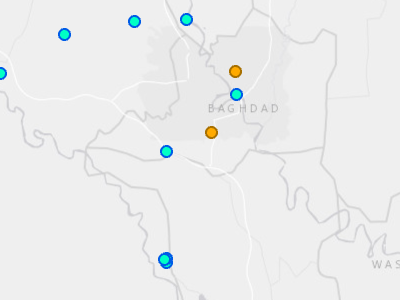
US and Israeli Strikes in Iraq (Middle East Conflict Response 2026)
Disaster Response Events / Middle East Conflict Response 2026 / US and Israeli Strikes in Iraq (Middle East Conflict Response 2026)
U.S. and Israeli strikes in Iraq, beginning February 28, 2026 through current.
Legend
Confirmed Airstrike Reported Airstrike Reported Explosion with Footage Reported Explosion without Footage Evacuation Notice Artillery Ground Advance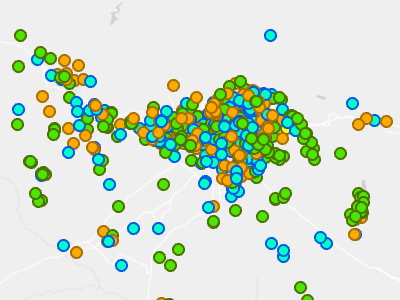
US and Israeli Strikes on Iran (Middle East Conflict Response 2026)
Disaster Response Events / Middle East Conflict Response 2026 / US and Israeli Strikes on Iran (Middle East Conflict Response 2026)
U.S. and Israeli Strikes on Iran, beginning February 28, 2026 through current.
Legend
Confirmed Airstrike Reported Airstrike Reported Explosion with Footage Reported Explosion without Footage Evacuation Notice Artillery Ground AdvanceEarly Warning / SmartAlerts - All Hazards (1)
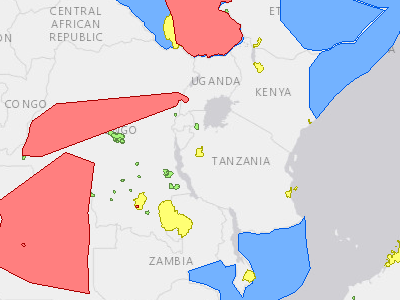
SmartAlerts - All Hazards
Early Warning / SmartAlerts - All Hazards
SmartAlert areas for all hazards.
Legend
 WARNING
 WATCH
 ADVISORY
 INFORMATION
Featured Layers / Population Density (1)
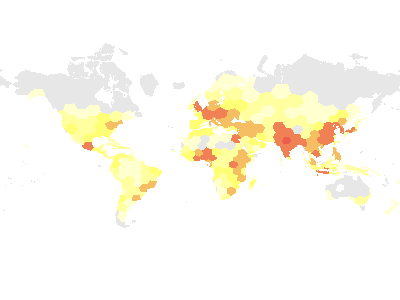
Population Density
Featured Layers / Population Density
Global Data / Boundaries (7)
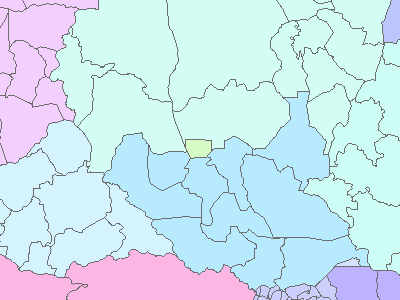
Administrative_Boundaries
Global Data / Boundaries / Administrative_Boundaries
First-level administrative units of the world.
Legend
 Abyei
 Afghanistan
 Aksai Chin
 Albania
 Algeria
 American Samoa
 Andorra
 Angola
 Anguilla
 Antarctica
 Antigua and Barbuda
 Argentina
… +253 more
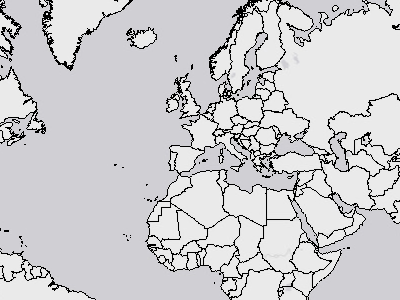
Detailed Coastlines
Global Data / Boundaries / Detailed Coastlines
World shorelines and country boundaries at a nominal scale of 1:250,000.
Legend
 (no label)
Contiguous Zones
Global Data / Boundaries / Economic Exclusion Zones (EEZ) / Contiguous Zones
Area enclosed within the maritime delimitations of a coastal state extending 24 Nautical Miles seawards from the baselines (normal and straight where available) and excluding the 12 nautical miles zone. Flanders Marine Institute (2019). Maritime Boundaries Geodatabase: Contiguous Zones (24NM), version 3. Available online at http://www.marineregions.org/.
Legend
 (no label)
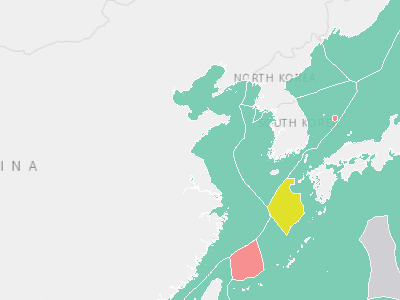
Exclusive Economic Zones
Global Data / Boundaries / Economic Exclusion Zones (EEZ) / Exclusive Economic Zones
An exclusive economic zone (EEZ) is a seazone extending from a state's coast or baseline over which the state has special rights over the exploration and use of marine resources. Generally a state's EEZ extends 200 nautical miles out from its coast, except where resulting points would be closer to another country. This dataset also contains delimitation of disputed areas and joint regimes. Flanders Marine Institute (2019). Maritime Boundaries Geodatabase: Maritime Boundaries and Exclusive Econom
Legend
 Joint regime
 200NM
 Overlapping claim
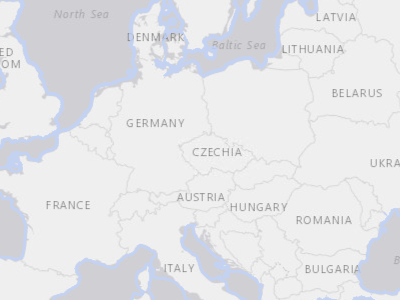
Territorial Seas
Global Data / Boundaries / Economic Exclusion Zones (EEZ) / Territorial Seas
Area enclosed within the maritime delimitations of a coastal state extending 12 Nautical Miles seawards from the baselines (normal and straight where available). Flanders Marine Institute (2019). Maritime Boundaries Geodatabase: Territorial Seas (12NM), version 3. Available online at http://www.marineregions.org/.
Legend
 (no label)
LatLong
Global Data / Boundaries / LatLong
No active data when this snapshot was taken — service has data but none was visible at the chosen frame.
Time_Zones
Global Data / Boundaries / Time_Zones
No active data when this snapshot was taken — service has data but none was visible at the chosen frame.
Global Data / Embassies (United States) (1)
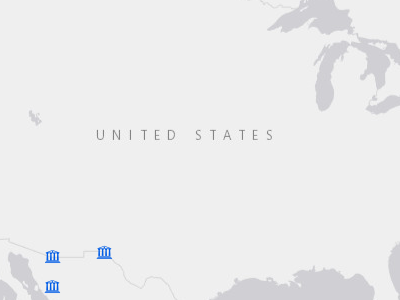
Embassies (United States)
Global Data / Embassies (United States)
U.S. Embassy and Consulates worldwide.
Legend
 (no label)
Global Data / Emergency Services (4)
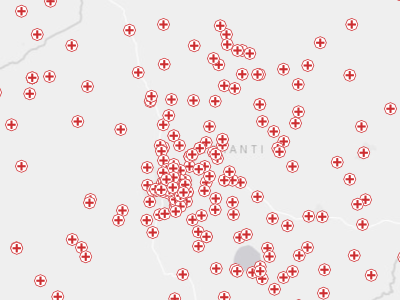
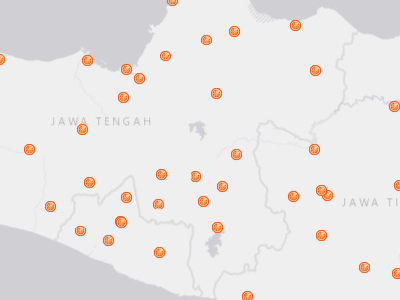
Clinics
Global Data / Emergency Services / Clinics
PDC global medical data contains international clinic locations. This dataset uses various public sources such as OpenStreetMap(HOT) and combines it with the best available National and NDPBA data sources.
Legend
 Clinics
Emergency Operations Centers (EOCs)
Global Data / Emergency Services / Emergency Operations Centers (EOCs)
PDC Global Emergency Operations Center's (EOC) data. This dataset consists of State, National, Local and other types of Emergency Operations Centers.
Legend
 Primary EOC
 Secondary EOC
Hospitals
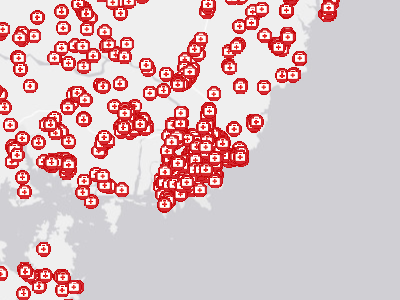
Global Data / Emergency Services / Hospitals
PDC Global Hospital data contains international hospital locations. This dataset uses various public sources such as OpenStreetMap(HOT) and merges it with the best available National and NDPBA data sources.
Legend
 Hospitals
Shelters
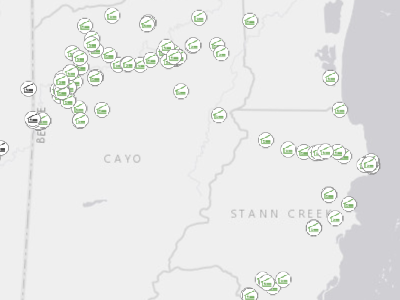
Global Data / Emergency Services / Shelters
PDC Global Emergency Shelter data contains designated and potential shelter locations across the globe . This dataset uses various public sources such as OpenStreetMap (HOT) and merges it with the best available National and PDC NDPBA data sources.
Legend
 Designated Shelter
 Potential Shelter
Global Data / Schools (3)
Colleges, Universities, and Professional Schools
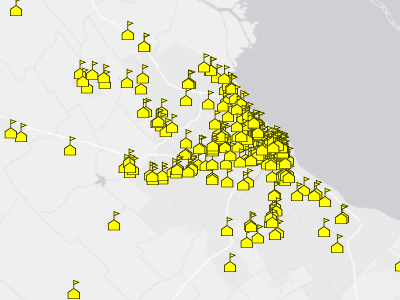
Global Data / Schools / Colleges, Universities, and Professional Schools
PDC global colleges, universities and professional schools.
Legend
 Colleges, Universities, and Professional Schools
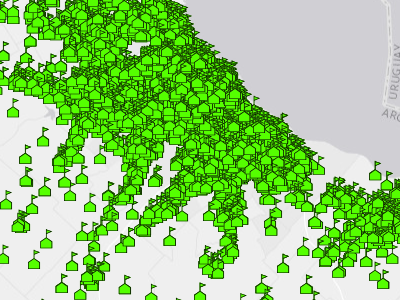
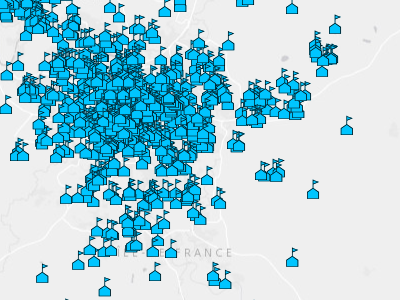
Elementary and Secondary Schools
Global Data / Schools / Elementary and Secondary Schools
PDC global elementary and secondary school locations.
Legend
 Elementary and Secondary Schools
Preschools and Daycares
Global Data / Schools / Preschools and Daycares
PDC global preschools and daycare locations.
Legend
 Preschools and Daycares
Global Data / Transportation (4)
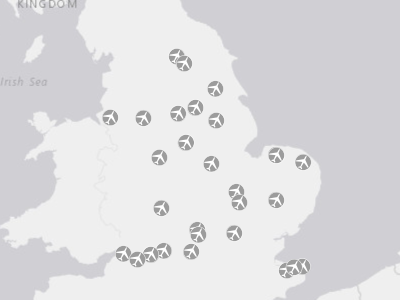
Airports
Global Data / Transportation / Airports / Decommissioned Airports
The Airports layer is a compilation of airports for various countries/providers from around the world.
Legend
 (no label)
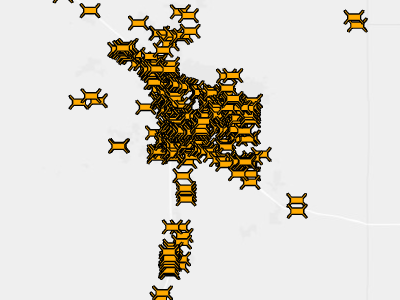
Bridges
Global Data / Transportation / Bridges
Global bridges.
Legend
 (no label)
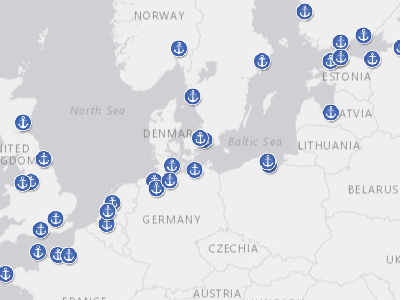
Ports
Global Data / Transportation / Ports / Large Ports
PDC Global Ports
Legend
 (no label)
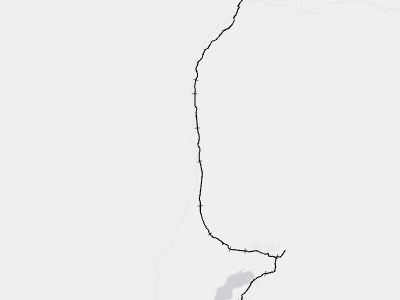
Railways
Global Data / Transportation / Railways
Major railroads of the world.
Legend
 (no label)
Global Data / Utilities (5)
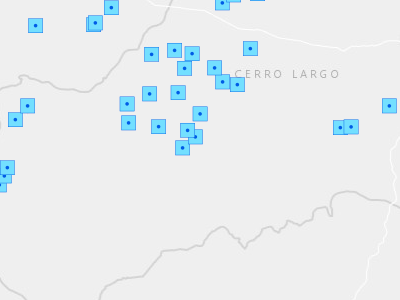
Dams
Global Data / Utilities / Dams
Dam locations globally.
Legend
 (no label)
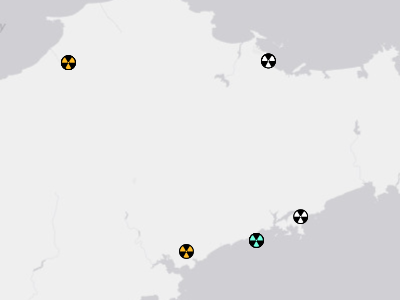
Nuclear Power Plants
Global Data / Utilities / Nuclear Power Plants
Nuclear power plants.
Legend
 Operating
 Announced
 Pre-Construction
 Construction
 Mothballed
 Retired
 Cancelled
 Cancelled - Inferred 4 Y
 Shelved
 Shelved - Inferred 2 Y
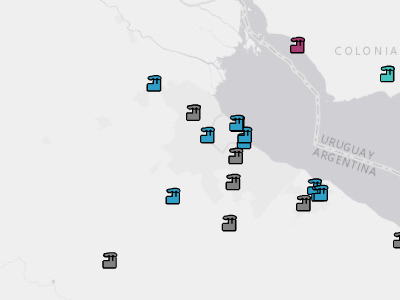
Power Plants
Global Data / Utilities / Power Plants
Electricity generating facilities operating across the world. Generation is provided at the year scale for the years 2013-2019.
Legend
 Biomass
 Coal
 Cogeneration
 Gas
 Geothermal
 Hydro
 Nuclear
 Oil
 Other
 Petcoke
 Solar
 Storage
… +3 more
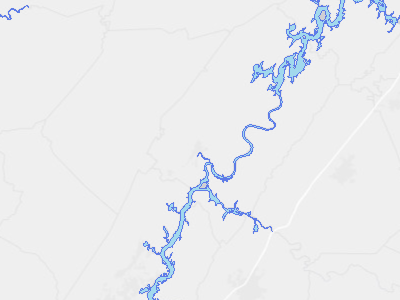
Reservoirs
Global Data / Utilities / Reservoirs
Reservoir locations globally, with a reservoir of more than 0.1km3.
Legend
 Reservoir
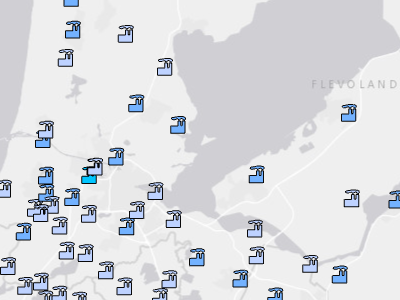
Wastewater Treatment Plants
Global Data / Utilities / Wastewater Treatment Plants
Wastewater treatment plants, as of 2021.
Legend
 0 - 50,000 Persons
 50,001 - 500,000 Persons
 > 500,000 Persons
Hazards and Events / Avalanche (4)
Avalanche Incidents
Hazards and Events / Avalanche / Avalanche Incidents
Active Avalanche incidents globally.
Legend
 INFORMATION
 ADVISORY
 WATCH
 WARNING
Forecasted Snowfall Accumulation 72h (USA)
Hazards and Events / Avalanche / Forecasted Snowfall Accumulation 72h (USA)
No active data when this snapshot was taken — service has data but none was visible at the chosen frame.
The total snowfall for this forecast period.
Recent Exposure - Avalanche
Hazards and Events / Avalanche / Recent Exposure - Avalanche
Service returned zero features at the time of this snapshot — the service exists but is currently empty.
Geographic areas where people, infrastructure, or natural systems are at risk of avalanche.
Legend
 (no label)
SmartAlerts - Avalanche
Hazards and Events / Avalanche / SmartAlerts - Avalanche
Service returned zero features at the time of this snapshot — the service exists but is currently empty.
SmartAlert areas for avalanche hazards.
Legend
WARNING WATCH ADVISORY INFORMATIONHazards and Events / Biomedical (4)
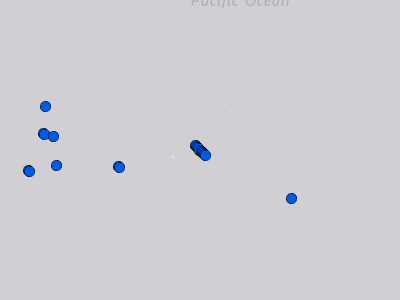
CDC Travel Health Notices
Hazards and Events / Biomedical / CDC Travel Health Notices
This layer displays notifications of disease outbreaks from the Centers for Disease Control (CDC).
Legend
 Level 1 - Practice Usual Precautions
 Level 2 - Practice Enhanced Precautions
 Level 3 - Reconsider Nonessential Travel
 Level 4 - Avoid All Travel
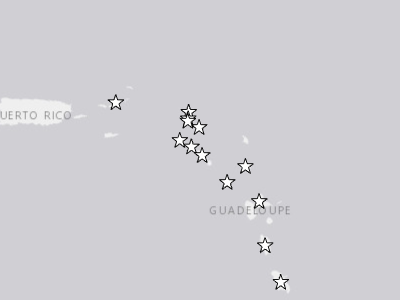
Department of State Travel Advisories
Hazards and Events / Biomedical / Department of State Travel Advisories
U.S. Department of State Travel Advisories. Travel Advisories have up to four levels that describe the risks within that country and give clear guidance to U.S. citizens to help them stay safe.
Legend
 Do Not Travel
 Reconsider Travel - Contains Areas with Higher Security Risk
 Reconsider Travel
 Exercise Increased Caution - Contains Areas with Higher Security Risk
 Exercise Increased Caution
 Exercise Normal Precautions - Contains Areas with Higher Security Risk
 Exercise Normal Precautions
Recent Exposure - Biomedical
Hazards and Events / Biomedical / Recent Exposure - Biomedical
Geographic areas where people, infrastructure, or natural systems are at risk of impacts from biomedical hazards.
Legend
(no label)
SmartAlerts - Biomedical
Hazards and Events / Biomedical / SmartAlerts - Biomedical
SmartAlert areas for biomedical hazards.
Legend
WARNING WATCH ADVISORY INFORMATIONHazards and Events / Drought (7)
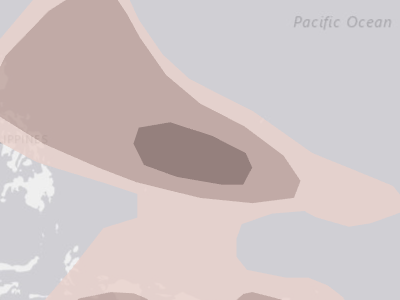
Below Average Precipitation Probability
Hazards and Events / Drought / Below Average Precipitation Probability
Probability of weather hazard occurrences, based on Global Tropics Hazards Outlook (GTH) from NOAA. Probabilities are valid for the specified 2-week window, and data is updated regularly (see metadata).
Legend
 ≤ 50%
 ≤ 65%
 ≤ 80%
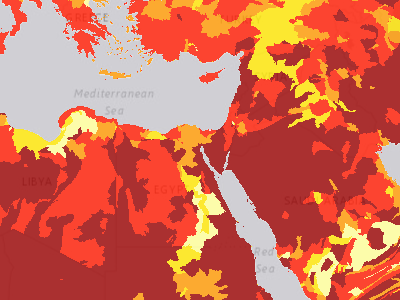
Groundwater Stress Overall Water Risk
Hazards and Events / Drought / Groundwater Stress / Groundwater Stress Overall Water Risk
Overall water risk model aggregates 13 water risk indicators (e.g. baseline water stress, groundwater table decline, flood risk, seasonal & interannual variability, etc.) that encompass quantity, quality, and reputational risks into a composite overall baseline water risk score. Higher values indicate higher water risk. Data model by World Resources Institute Aqueduct 3.0.
Legend
 No Data
 Low (0-1)
 Low - Medium (1-2)
 Medium - High (2-3)
 High (3-4)
 Extremely High (4-5)
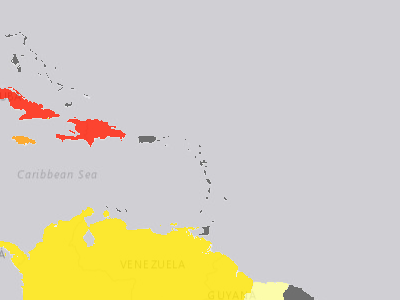
Groundwater Stress Rank by Country
Hazards and Events / Drought / Groundwater Stress / Groundwater Stress Rank by Country
World Resources Institute country rankings for average exposure of water risk indicators including baseline water stress, riverine flood risk, and drought risk. Modeled in Aqueduct 3.0 (2019).
Legend
No Data Low (0.0-0.2) Low - Medium (0.2-0.4) Medium (0.4-0.6) Medium - High (0.6-0.8) High (0.8-1.0)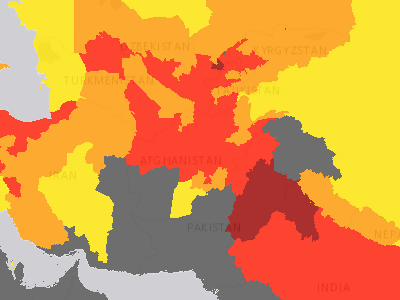
Groundwater Stress Rank by Province
Hazards and Events / Drought / Groundwater Stress / Groundwater Stress Rank by Province
Groundwater stress rank by province dataset shows the average exposure to water risk indicators including baseline water stress, riverine flood risk, and drought risk by the World Resources Institute's Aqueduct 3.0 water risk model.
Legend
No Data Low (0.0-0.2) Low - Medium (0.2-0.4) Medium (0.4-0.6) Medium - High (0.6-0.8) High (0.8-1.0)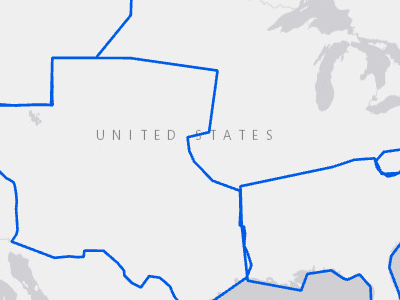
Recent Exposure - Drought
Hazards and Events / Drought / Recent Exposure - Drought
Geographic areas where people, infrastructure, or natural systems are at risk of avalanche.
Legend
(no label)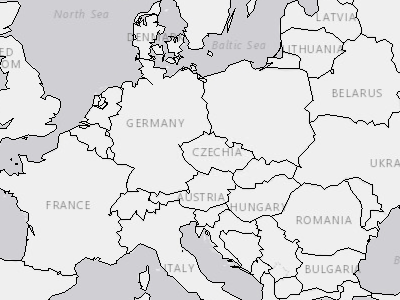
Seasonal Precipitation Anomaly (Current)
Hazards and Events / Drought / Seasonal Precipitation Anomaly (Current) / Countries
World Countries
Legend
(no label)
SmartAlerts - Drought
Hazards and Events / Drought / SmartAlerts - Drought
SmartAlert areas for drought hazards.
Legend
WARNING WATCH ADVISORY INFORMATIONHazards and Events / Earthquake (7)
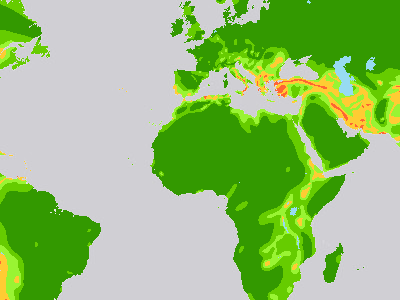
Earthquake Intensity Zones
Hazards and Events / Earthquake / Earthquake Intensity Zones
Earthquake intensity zones.
Legend
 IX and above
 VIII
 VII
 VI
 V and below
 Water body
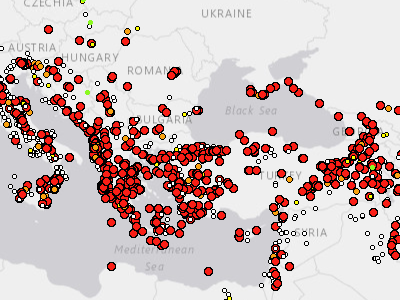
Historical Earthquakes
Hazards and Events / Earthquake / Historical Earthquake / Historical Earthquakes
Global historical earthquakes.
Legend
 Not Recorded
 Less than 4.0
 4.0 - 4.5
 4.5 - 5.0
 Greater than 5.0
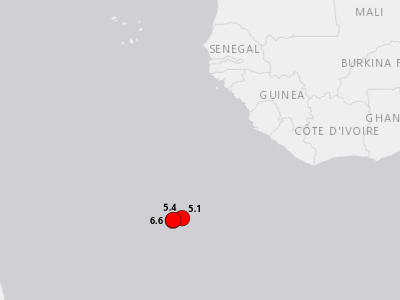
Locations and Magnitude
Hazards and Events / Earthquake / Locations and Magnitude
Earthquakes from the past 48 hours
Legend
 Less than 4.0
 4.0 - 4.5
 4.5 - 5.0
 Greater than 5.0
Recent Exposure - Earthquake
Hazards and Events / Earthquake / Recent Exposure - Earthquake
No active data when this snapshot was taken — service has data but none was visible at the chosen frame.
PDC Hazard Exposure area for Earthquake Hazards.
Legend
(no label)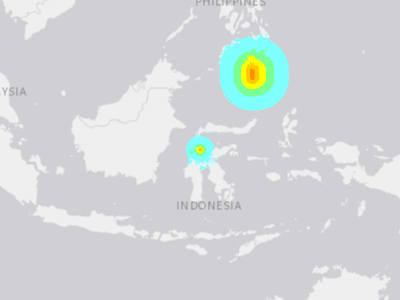
Shaking Intensity (ShakeMap Model)
Hazards and Events / Earthquake / Shaking Intensity (ShakeMap Model)
Earthquake shaking intensity for large earthquake events (Modified Mercalli Intensity - MMI IV and greater).
Legend
 IV (Light)
 V (Moderate)
 VI (Strong)
 VII (Very Strong)
 VIII (Severe)
 IX (Violent)
 X+ (Extreme)
SmartAlerts - Earthquake
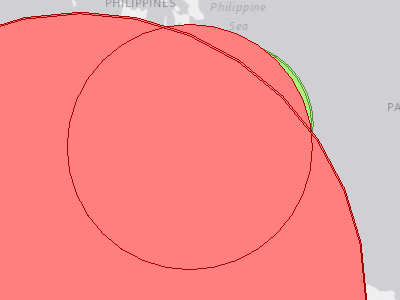
Hazards and Events / Earthquake / SmartAlerts - Earthquake
SmartAlert areas for earthquake hazards.
Legend
WARNING WATCH ADVISORY INFORMATION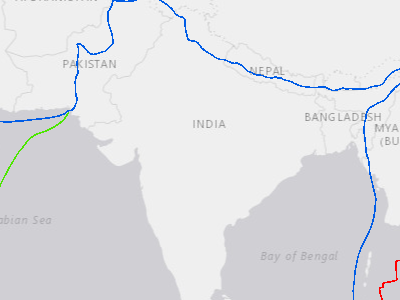
Tectonic Plate Boundaries
Hazards and Events / Earthquake / Tectonic Plate Boundaries
Present day tectonic plate boundaries.
Legend
 Ridge
 Transform
 Trench
Hazards and Events / Extreme Temperature (5)
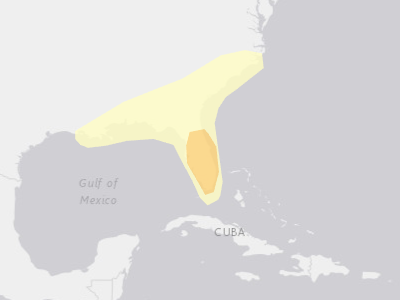
Above Average Temperature Probability
Hazards and Events / Extreme Temperature / Above Average Temperature Probability
Probability of weather hazard occurrences, based on Global Tropics Hazards Outlook (GTH) from NOAA. Probabilities are valid for the specified 2-week window, and data is updated regularly (see metadata).
Legend
 ≤ 50%
 ≤ 65%
 ≤ 80%
Below Average Temperature Probability
Hazards and Events / Extreme Temperature / Below Average Temperature Probability
Service returned zero features at the time of this snapshot — the service exists but is currently empty.
Probability of weather hazard occurrences, based on Global Tropics Hazards Outlook (GTH) from NOAA. Probabilities are valid for the specified 2-week window, and data is updated regularly (see metadata).
Legend
 ≤ 50%
 ≤ 65%
 ≤ 80%
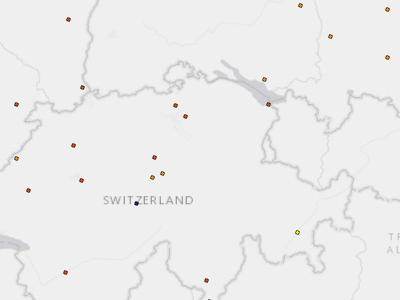
Global Weather Observations (METAR)
Hazards and Events / Extreme Temperature / Global Weather Observations (METAR)
Temperature in Celsius, recorded at Aviation Weather Center (AWC) stations as part of the AWC METAR dataset. Additional global weather observation METAR data fields include dewpoint, wind speed, wind direction, visibility and sky cover.
Legend
 < -25 °C
 -25 - -20 °C
 -20 - -15 °C
 -15 - -10 °C
 -10 - -5 °C
 -5 - 0 °C
 0 - 5 °C
 5 - 10 °C
 10 - 15 °C
 15 - 20 °C
 20 - 25 °C
 25 - 30 °C
… +2 more
Recent Exposure - Extreme Temperature
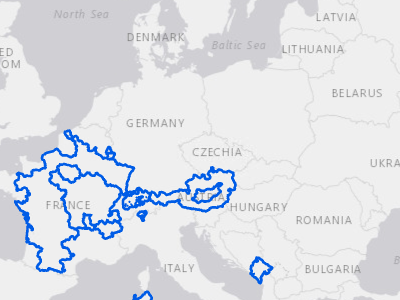
Hazards and Events / Extreme Temperature / Recent Exposure - Extreme Temperature
pdcrds.richter_incidents.exposure_active
Legend
(no label)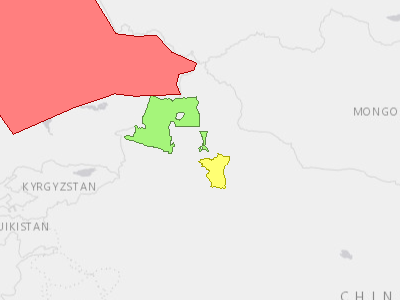
SmartAlerts - Extreme Temperature
Hazards and Events / Extreme Temperature / SmartAlerts - Extreme Temperature
SmartAlert areas for extreme temperature hazards.
Legend
WARNING WATCH ADVISORY INFORMATIONHazards and Events / Flood (21)
Above Average Precipitation Probability
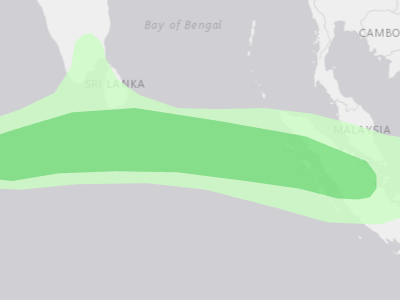
Hazards and Events / Flood / Above Average Precipitation Probability
Probability of weather hazard occurrences, based on Global Tropics Hazards Outlook (GTH) from NOAA. Probabilities are valid for the specified 2-week window, and data is updated regularly (see metadata).
Legend
 ≤ 50%
 ≤ 65%
 ≤ 80%
Flash Flood Hazard Zone
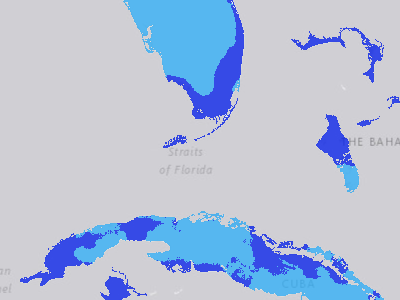
Hazards and Events / Flood / Flash Flood Hazard Zone
Flash flood hazard zones globally. Any area with erosivity density greater than 1 has at least moderate flash flood hazard. Greater than 3 is high hazard, and greater than 6 is extreme hazard.
Legend
 Low
 Moderate
 High
 Extreme
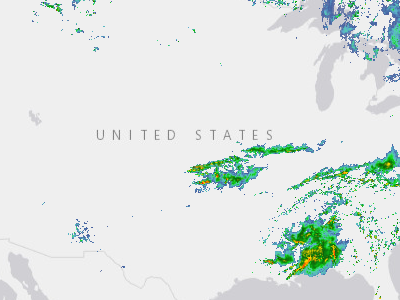
Doppler Radar (USA)
Hazards and Events / Flood / Flood (USA) / Doppler Radar (USA)
The Radar Base Reflective Time Imagery Service consists of data from Multi-Radar/MULTI-Sensor System (MRMS). It provides weather radar information for all the composite Weather Service Doppler Radars (WSR 88-D). This image service has a four-hour moving time slider window. It has data for the Continental United States, Alaska, The Caribbean, Guam, and Hawaii. This radar base reflectivity image service also has WMS capabilities. </p
Legend
 Red: Band_1
 Green: Band_2
 Blue: Band_3
Flood Warning Areas (USA)
Hazards and Events / Flood / Flood (USA) / Flood Warning Areas (USA)
No active data when this snapshot was taken — service has data but none was visible at the chosen frame.
Active flood warnings for the United States.
Legend
 (no label)
Observed River Stages (USA)
Hazards and Events / Flood / Flood (USA) / Observed River Stages (USA)
No active data when this snapshot was taken — service has data but none was visible at the chosen frame.
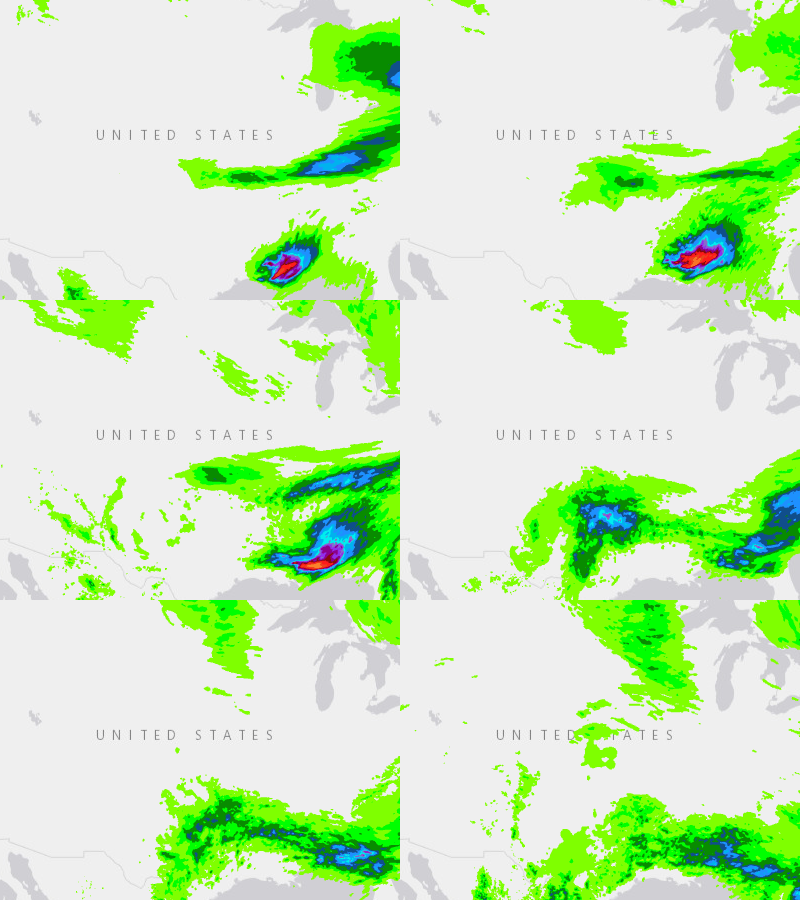
Precipitation Forecast (USA)
Hazards and Events / Flood / Flood (USA) / Precipitation Forecast (USA) / 0 - 6 Hour
NOAA/NWS's experimental total amount of liquid precipitation (rainfall and melted snow/ice pellets) that is forecasted to fall during specified 6-hour periods out to 3 days.
Legend
 18 symbols (indexed, e.g. heading / course)
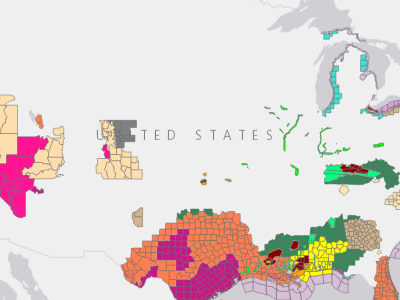
U.S. Watches, Warnings and Advisories
Hazards and Events / Flood / Flood (USA) / U.S. Watches, Warnings and Advisories
Legend
 911 Telephone Outage Administrative Message
 Air Quality Alert Air Stagnation Advisory
 Ashfall Advisory
 Ashfall Warning
 Avalanche Advisory
 Avalanche Warning
 Avalanche Watch
 Beach Hazards Statement
 Blizzard Warning
 Blowing Dust Advisory
… +99 more
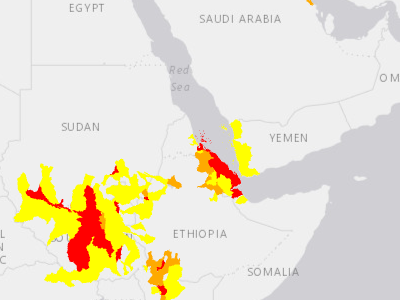
Global Flood Watershed Severities
Hazards and Events / Flood / Global Flood Watershed Severities
Current Global Watershed Flood severities sourced from the NASA Model of Models.
Legend
Warning Watch Advisory
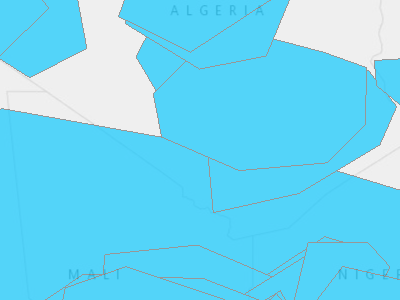
Historical Large Floods
Hazards and Events / Flood / Historical Flood / Historical Large Floods
Global historical flood events from 1985 to present. Flood events are considered "large" based on factors including "significant damage to structures or agriculture, long (decades) reported intervals since the last similar event, and/or fatalities" (Dartmouth Flood Observatory, 2022).
Legend
 Historical Large Floods
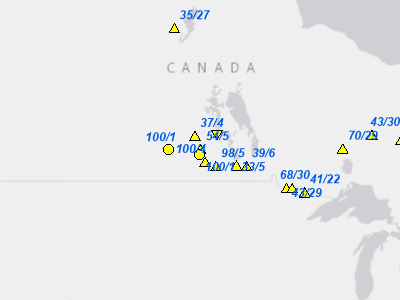
Flood Reporting Points
Hazards and Events / Flood / Precipitation Forecasts (GloFAS) / Flood Reporting Points
This data set contains key locations at which the GloFAS flood forecast shows probability of exceeding the 2-year, 5-year and 20-year return period is > 20%. Colors representing the return period and the labels display numbers showing the exceedance percentage and days to reach flood peak. Shape denotes rising (upward triangle), decreasing (downward triangle), or stagnant (circle) trend of the ensemble mean discharge within the forecast horizon.
Legend
 2 Year
 5 Year
 20 Year
 Rising
 Rising
 Rising
 Falling
 Falling
 Falling
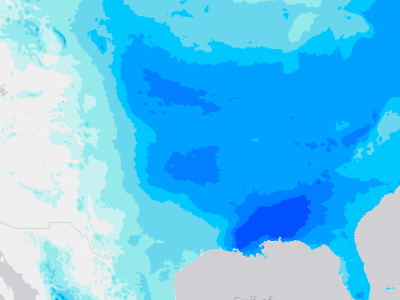
Precipitation Forecast (10 Day Accumulation)
Hazards and Events / Flood / Precipitation Forecasts (GloFAS) / Precipitation Forecast (10 Day Accumulation)
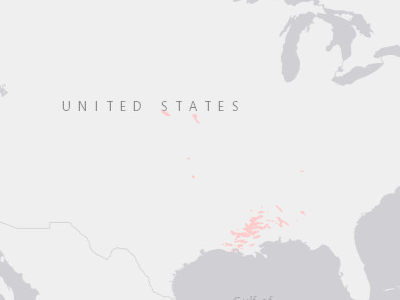
Probability of Precipitation (12in /300mm)
Hazards and Events / Flood / Precipitation Forecasts (GloFAS) / Probability of Precipitation (12in /300mm)
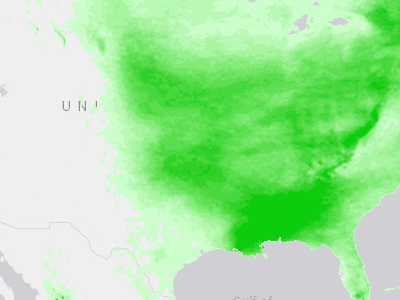
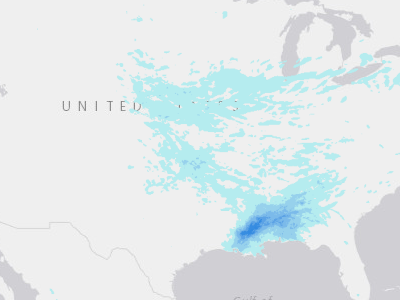
Probability of Precipitation (2in /50mm)
Hazards and Events / Flood / Precipitation Forecasts (GloFAS) / Probability of Precipitation (2in /50mm)
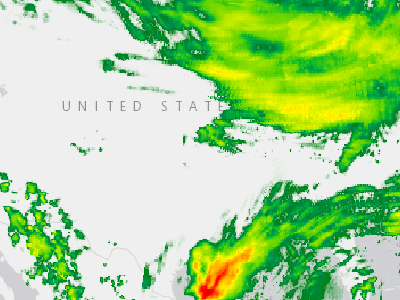
Probability of Precipitation (6in /150mm)
Hazards and Events / Flood / Precipitation Forecasts (GloFAS) / Probability of Precipitation (6in /150mm)
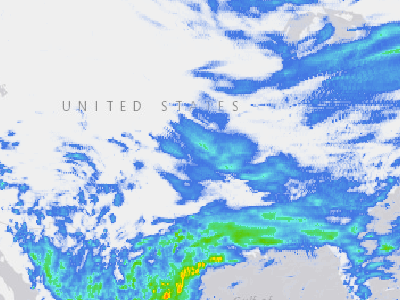
Rainfall Accumulation (1 Day)
Hazards and Events / Flood / Rainfall Accumulation (IMERG) / Rainfall Accumulation (1 Day)
Rainfall Accumulation (3 Day)
Hazards and Events / Flood / Rainfall Accumulation (IMERG) / Rainfall Accumulation (3 Day)
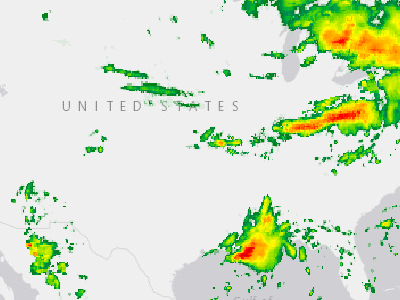
Rainfall Accumulation (3 Hour)
Hazards and Events / Flood / Rainfall Accumulation (IMERG) / Rainfall Accumulation (3 Hour)
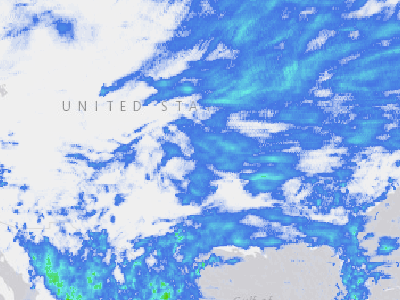
Rainfall Accumulation (7 Day)
Hazards and Events / Flood / Rainfall Accumulation (IMERG) / Rainfall Accumulation (7 Day)
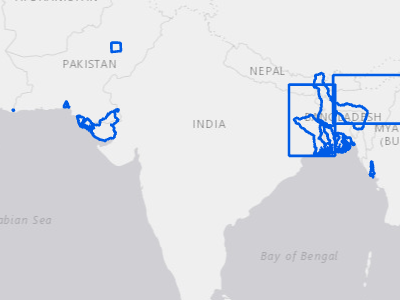
Recent Exposure - Flood
Hazards and Events / Flood / Recent Exposure - Flood
Geographic areas where people, infrastructure, or natural systems are at risk of flooding.
Legend
(no label)
Riverine Flood Hazard Zone
Hazards and Events / Flood / Riverine Flood Hazard Zone
No active data when this snapshot was taken — service has data but none was visible at the chosen frame.

SmartAlerts - Flood
Hazards and Events / Flood / SmartAlerts - Flood
SmartAlert areas for flood hazards.
Legend
WARNING WATCH ADVISORY INFORMATIONHazards and Events / Geopolitical Incidents (18)
Recent Exposure - Accident
Hazards and Events / Geopolitical Incidents / Accident / Recent Exposure - Accident
No active data when this snapshot was taken — service has data but none was visible at the chosen frame.
Geographic areas where people, infrastructure, or natural systems are at risk of impacts from accidents.
Legend
(no label)
SmartAlerts - Accident
Hazards and Events / Geopolitical Incidents / Accident / SmartAlerts - Accident
SmartAlerts - Accident
Legend
WARNING WATCH ADVISORY INFORMATION
Recent Exposure - Active Shooter
Hazards and Events / Geopolitical Incidents / Active Shooter / Recent Exposure - Active Shooter
No active data when this snapshot was taken — service has data but none was visible at the chosen frame.
Geographic areas where people, infrastructure, or natural systems are at risk of impacts from accidents.
Legend
(no label)
SmartAlerts - Active Shooter
Hazards and Events / Geopolitical Incidents / Active Shooter / SmartAlerts - Active Shooter
SmartAlert areas for active shooters.
Legend
WARNING WATCH ADVISORY INFORMATIONRecent Exposure - Civil Unrest
Hazards and Events / Geopolitical Incidents / Civil Unrest / Recent Exposure - Civil Unrest
No active data when this snapshot was taken — service has data but none was visible at the chosen frame.
Geographic areas where people, infrastructure, or natural systems are at risk of impacts from civil unrest.
Legend
(no label)
SmartAlerts - Civil Unrest
Hazards and Events / Geopolitical Incidents / Civil Unrest / SmartAlerts - Civil Unrest
SmartAlert areas for civil unrest.
Legend
WARNING WATCH ADVISORY INFORMATION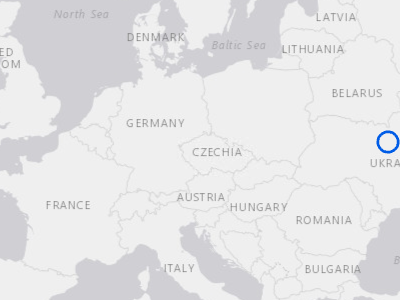
Recent Exposure - Combat
Hazards and Events / Geopolitical Incidents / Combat / Recent Exposure - Combat
Geographic areas where people, infrastructure, or natural systems are at risk of impacts from combat.
Legend
(no label)
SmartAlerts - Combat
Hazards and Events / Geopolitical Incidents / Combat / SmartAlerts - Combat
SmartAlert areas for combat.
Legend
WARNING WATCH ADVISORY INFORMATIONSmartAlerts - Cyber
Hazards and Events / Geopolitical Incidents / Cyber / SmartAlerts - Cyber
Service returned zero features at the time of this snapshot — the service exists but is currently empty.
SmartAlert areas for cyber attacks.
Legend
WARNING WATCH ADVISORY INFORMATIONRecent Exposure - Occurrence
Hazards and Events / Geopolitical Incidents / Occurrence / Recent Exposure - Occurrence
Service returned zero features at the time of this snapshot — the service exists but is currently empty.
Geographic areas where people, infrastructure, or natural systems are at risk of impacts from occurrence.
Legend
(no label)SmartAlerts - Occurrence
Hazards and Events / Geopolitical Incidents / Occurrence / SmartAlerts - Occurrence
Service returned zero features at the time of this snapshot — the service exists but is currently empty.
SmartAlert areas for occurrences.
Legend
WARNING WATCH ADVISORY INFORMATIONRecent Exposure - Political Conflict
Hazards and Events / Geopolitical Incidents / Political Conflict / Recent Exposure - Political Conflict
Service returned zero features at the time of this snapshot — the service exists but is currently empty.
Geographic areas where people, infrastructure, or natural systems are at risk of impacts from political conflict.
Legend
(no label)SmartAlerts - Political Conflict
Hazards and Events / Geopolitical Incidents / Political Conflict / SmartAlerts - Political Conflict
Service returned zero features at the time of this snapshot — the service exists but is currently empty.
SmartAlert areas for political conflict.
Legend
WARNING WATCH ADVISORY INFORMATION
Recent Exposure - Geopolitical
Hazards and Events / Geopolitical Incidents / Recent Exposure - Geopolitical
Geographic areas where people, infrastructure, or natural systems are at risk of impacts from geopolitical incidents.
Legend
(no label)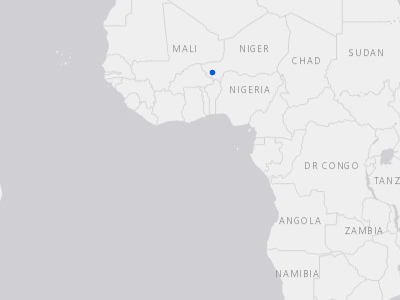
Recent Exposure - Terrorism
Hazards and Events / Geopolitical Incidents / Terrorism / Recent Exposure - Terrorism
No active data when this snapshot was taken — service has data but none was visible at the chosen frame.
Geographic areas where people, infrastructure, or natural systems are at risk of impacts from terrorism.
Legend
(no label)
SmartAlerts - Terrorism
Hazards and Events / Geopolitical Incidents / Terrorism / SmartAlerts - Terrorism
SmartAlert areas for terrorism.
Legend
WARNING WATCH ADVISORY INFORMATIONRecent Exposure - Weapons
Hazards and Events / Geopolitical Incidents / Weapons / Recent Exposure - Weapons
Service returned zero features at the time of this snapshot — the service exists but is currently empty.
Geographic areas where people, infrastructure, or natural systems are at risk of impacts from weapons.
Legend
(no label)SmartAlerts - Weapons
Hazards and Events / Geopolitical Incidents / Weapons / SmartAlerts - Weapons
Service returned zero features at the time of this snapshot — the service exists but is currently empty.
SmartAlert areas for weapons of mass destruction.
Legend
WARNING WATCH ADVISORY INFORMATIONHazards and Events / High Surf (3)
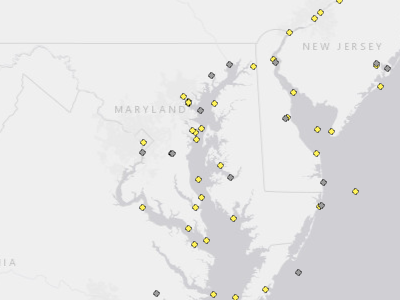
Ocean Buoys
Hazards and Events / High Surf / Ocean Buoys
Ocean buoys and coastal stations with near real-time marine observations and meteorological data. Data published by the National Buoy Data Center.
Legend
 Active
 No Data
Recent Exposure - High Surf
Hazards and Events / High Surf / Recent Exposure - High Surf
No active data when this snapshot was taken — service has data but none was visible at the chosen frame.
Geographic areas where people, infrastructure, or natural systems are at risk of impacts from high surf.
Legend
(no label)
SmartAlerts - High Surf
Hazards and Events / High Surf / SmartAlerts - High Surf
SmartAlert areas for high surf hazards.
Legend
WARNING WATCH ADVISORY INFORMATIONHazards and Events / High Wind (2)
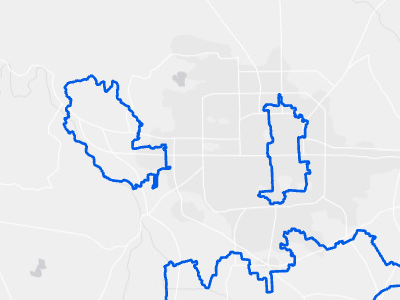
Recent Exposure - High Wind
Hazards and Events / High Wind / Recent Exposure - High Wind
Geographic areas where people, infrastructure, or natural systems are at risk of impacts from high wind.
Legend
(no label)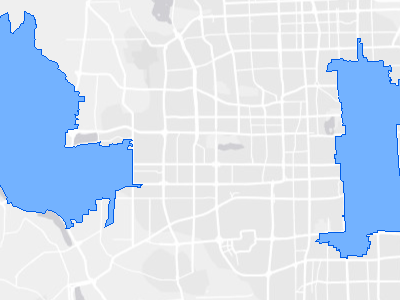
SmartAlerts - High Wind
Hazards and Events / High Wind / SmartAlerts - High Wind
SmartAlert areas for high wind hazards.
Legend
WARNING WATCH ADVISORY INFORMATIONHazards and Events / Landslide (3)
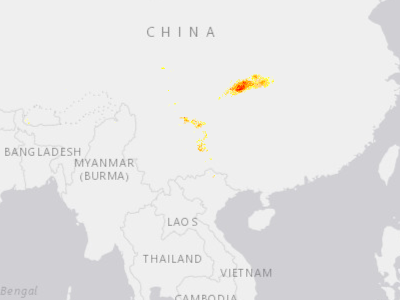
Global Landslide Probabilities
Hazards and Events / Landslide / Global Landslide Probabilities
Active Global Landslide Probability sourced from the NASA LHASA Landslide Model.
Legend
 50% to 59.9% Landslide Probability 60% to 69.9% Landslide Probability
 70% to 79.9% Landslide Probability
 80% to 89.9% Landslide Probability 90% or greater Landslide Probability
Recent Exposure - Landslide
Hazards and Events / Landslide / Recent Exposure - Landslide
Geographic areas where people, infrastructure, or natural systems are at risk of landslide.
Legend
(no label)
SmartAlerts - Landslide
Hazards and Events / Landslide / SmartAlerts - Landslide
SmartAlert areas for landslide hazards.
Legend
WARNING WATCH ADVISORY INFORMATIONHazards and Events / Manmade (2)
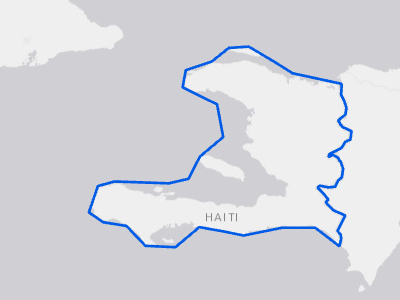
Recent Exposure - Manmade
Hazards and Events / Manmade / Recent Exposure - Manmade
Geographic areas where people, infrastructure, or natural systems are at risk of impacts from manmade hazards.
Legend
(no label)
SmartAlerts - Manmade
Hazards and Events / Manmade / SmartAlerts - Manmade
SmartAlert areas for manmade hazards.
Legend
WARNING WATCH ADVISORY INFORMATIONHazards and Events / Marine (3)
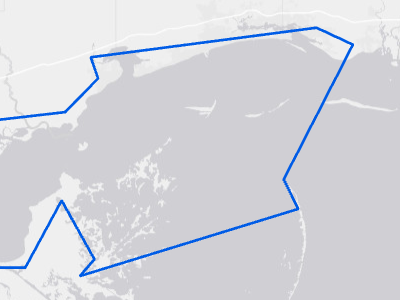
Recent Exposure - Marine
Hazards and Events / Marine / Recent Exposure - Marine
Geographic areas where people, infrastructure, or natural systems are at risk of impacts from marine hazards.
Legend
(no label)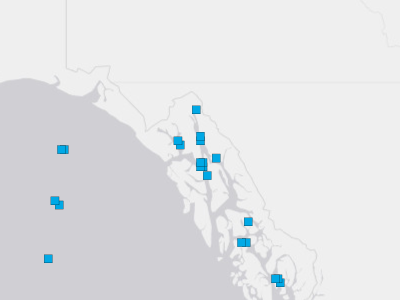
Ship Observations
Hazards and Events / Marine / Ship Observations
Near real-time observation data collected from ships in open water. Data published by the National Data Buoy Center.
Legend
 (no label)
SmartAlerts - Marine
Hazards and Events / Marine / SmartAlerts - Marine
SmartAlert areas for marine hazards.
Legend
WARNING WATCH ADVISORY INFORMATIONHazards and Events / Severe Weather (4)
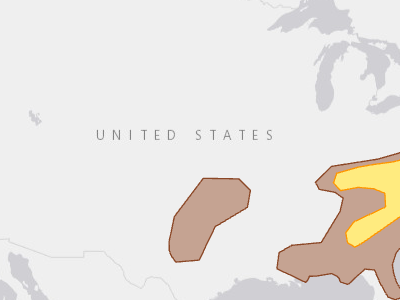
Damaging Wind Probability Day 1 (USA)
Hazards and Events / Severe Weather / Damaging Wind Probability Day 1 (USA)
Legend
 5%
 15%
 30%
 45%
 60%
 75%
 90%
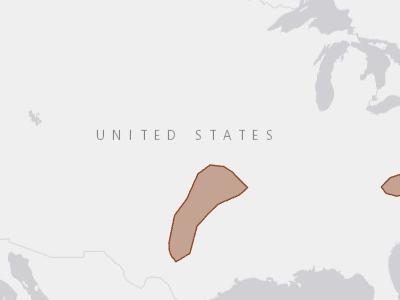
Hail Probability Day 1 (USA)
Hazards and Events / Severe Weather / Hail Probability Day 1 (USA)
Legend
5% 15% 30% 45% 60%
Recent Exposure - Severe Weather
Hazards and Events / Severe Weather / Recent Exposure - Severe Weather
Geographic areas where people, infrastructure, or natural systems are at risk of impacts from severe weather.
Legend
(no label)
SmartAlerts - Severe Weather
Hazards and Events / Severe Weather / SmartAlerts - Severe Weather
SmartAlert areas for severe weather hazards.
Legend
WARNING WATCH ADVISORY INFORMATIONHazards and Events / Storm (2)
Recent Exposure - Storm
Hazards and Events / Storm / Recent Exposure - Storm
Geographic areas where people, infrastructure, or natural systems are at risk of impacts from storm hazards.
Legend
(no label)
SmartAlerts - Storm
Hazards and Events / Storm / SmartAlerts - Storm
SmartAlert areas for storm hazards.
Legend
WARNING WATCH ADVISORY INFORMATIONHazards and Events / Tornado (4)
Recent Exposure - Tornado
Hazards and Events / Tornado / Recent Exposure - Tornado
Geographic areas where people, infrastructure, or natural systems are at risk of impacts from tornadoes.
Legend
(no label)
SmartAlerts - Tornado
Hazards and Events / Tornado / SmartAlerts - Tornado
SmartAlert areas for tornado hazards.
Legend
WARNING WATCH ADVISORY INFORMATION
Tornado Probability Day 1 (USA)
Hazards and Events / Tornado / Tornado Probability Day 1 (USA)
Legend
 2%
 5%
 10%
 15%
 30%
 45%
 60%

Tornado Watch or Warning
Hazards and Events / Tornado / Tornado Watch or Warning
A tornado watch indicates that tornadoes are possible in and near the watch area. A tornado warning indicates that a tornado has been sighted or indicated by weather radar.
Legend
WATCH WARNING
Hazards and Events / Tropical Cyclone (57)
Tropical Cyclone Forecast Uncertainty
Hazards and Events / Tropical Cyclone / Forecast Uncertainty (3 day)
Service returned zero features at the time of this snapshot — the service exists but is currently empty.
Tropical cyclone track uncertainty cone at 3- and 5-day horizons. Aggregated from PDC's individual Forecast Uncertainty layers into one animated time series.
Legend
 (no label)
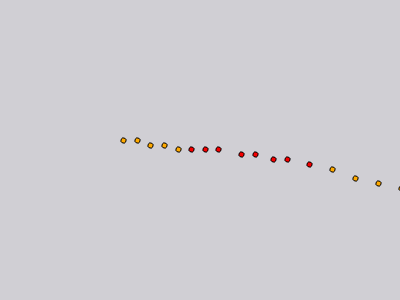
Tropical Cyclone Forecast Model (HAFS)
Hazards and Events / Tropical Cyclone / Forecast/Outlook / Hurricane Analysis and Forecast System (HAFS) / Tropical Cyclone Forecast Model (HAFS) / Invest Positions
Potential storm formation and paths during the next 126 hours. Positions show the location every 3 hours. Data is updated every 6 hours from the NOAA HAFS model.
Legend
 Major Hurricane / Typhoon (> 150 mph)
 Hurricane/ Typhoon (74 - 150 mph)
 Tropical Storm (39 - 73 mph)
 Tropical Depression (< 39 mph)
Tropical Cyclone Rainfall Forecast (5 Day) (HAFS)
Hazards and Events / Tropical Cyclone / Forecast/Outlook / Hurricane Analysis and Forecast System (HAFS) / Tropical Cyclone Rainfall Forecast (5 Day) (HAFS)
No active data when this snapshot was taken — service has data but none was visible at the chosen frame.
Tropical Cyclone Formation Probability
Hazards and Events / Tropical Cyclone / Forecast/Outlook / Tropical Cyclone Formation Probability
Probability of weather hazard occurrences, based on Global Tropics Hazards Outlook (GTH) from NOAA. Probabilities are valid for the specified 2-week window, and data is updated regularly (see metadata).
Legend
 ≤ 20%
 ≤ 40%
 ≤ 60%
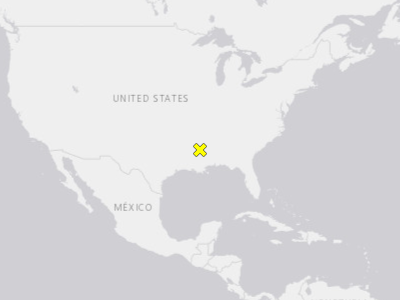
Tropical Weather 2 Day Forecast (GTWO)
Hazards and Events / Tropical Cyclone / Forecast/Outlook / Tropical Weather 2 Day Forecast (GTWO)
Tropical cyclone formation potential for Eastern Pacific Ocean and Atlantic Ocean. The graphic displays all currently active tropical cyclones, and disturbances with tropical cyclone formation potential over the next 2 days, with associated formation probabilities.
Legend
 Low
 Medium
 High
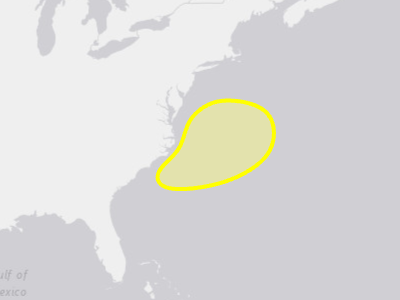
Tropical Weather 7 Day Forecast (GTWO)
Hazards and Events / Tropical Cyclone / Forecast/Outlook / Tropical Weather 7 Day Forecast (GTWO) / Tropical Weather 7 Day Forecast (GTWO) - Area
Tropical cyclone formation potential for Eastern Pacific Ocean and Atlantic Ocean. The graphic displays all currently active tropical cyclones, and disturbances with tropical cyclone formation potential over the next 7 days, with associated formation probabilities.
Legend
 Low
 Medium
 High
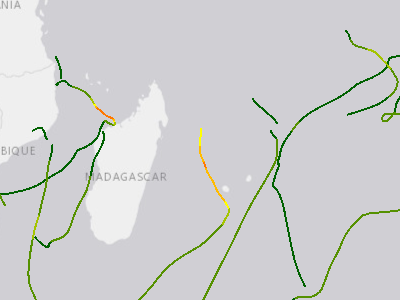
Historical Cyclone Tracks - 2014
Hazards and Events / Tropical Cyclone / Historical Cyclone Tracks / Historical Cyclone Tracks - 2014
Cyclone tracks for 2014 events.
Legend
 -1
 0
 1
 2
 3
 4
 5
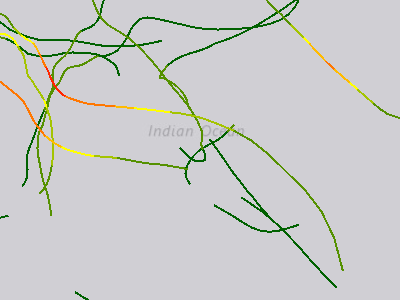
Historical Cyclone Tracks - 2015
Hazards and Events / Tropical Cyclone / Historical Cyclone Tracks / Historical Cyclone Tracks - 2015
Cyclone tracks for 2015 events.
Legend
-1 0 1 2 3 4 5
Historical Cyclone Tracks - 2016
Hazards and Events / Tropical Cyclone / Historical Cyclone Tracks / Historical Cyclone Tracks - 2016
Cyclone tracks for 2016 events.
Legend
-1 0 1 2 3 4 5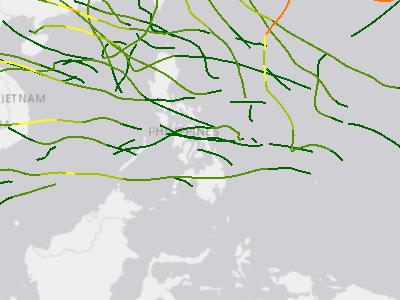
Historical Cyclone Tracks - 2017
Hazards and Events / Tropical Cyclone / Historical Cyclone Tracks / Historical Cyclone Tracks - 2017
Cyclone tracks for 2017 events.
Legend
-1 0 1 2 3 4 5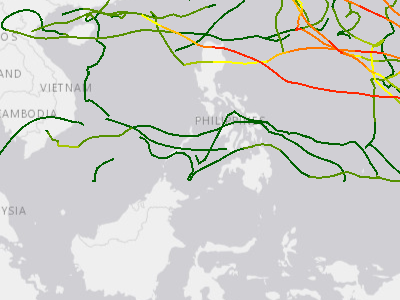
Historical Cyclone Tracks - 2018
Hazards and Events / Tropical Cyclone / Historical Cyclone Tracks / Historical Cyclone Tracks - 2018
Cyclone tracks for 2018 events.
Legend
Tropical Depression ( < 34 knots) Tropical Storm (34 < 64 knots) Category 1 Hurricane (64 < 83 knots) Category 2 Hurricane (83 < 96 knots) Category 3 Hurricane (96 < 113 knots) Category 4 Hurricane (113 < 137 knots) Category 5 Hurricane ( > 137 knots)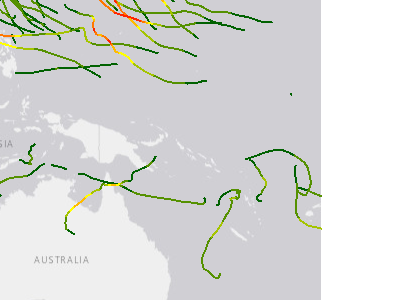
Historical Cyclone Tracks - 2019
Hazards and Events / Tropical Cyclone / Historical Cyclone Tracks / Historical Cyclone Tracks - 2019
Cyclone tracks for 2019 events.
Legend
-1 0 1 2 3 4 5
Historical Cyclone Tracks - 2020
Hazards and Events / Tropical Cyclone / Historical Cyclone Tracks / Historical Cyclone Tracks - 2020
Cyclone tracks for 2020 events.
Legend
Tropical Depression: (< 34 knots) Tropical Storm: (34 < 64 knots) Category 1 Hurricane (64 < 83 knots) Category 2 Hurricane (83 < 96 knots) Category 3 Hurricane (96 < 113 knots) Category 4 Hurricane (113 < 137 knots) Category 5 Hurricane ( > 137 knots)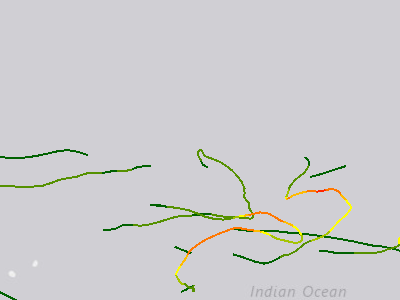
Historical Cyclone Tracks - 2021
Hazards and Events / Tropical Cyclone / Historical Cyclone Tracks / Historical Cyclone Tracks - 2021
Cyclone tracks for 2021 events.
Legend
Tropical Depression: (< 34 knots) Tropical Storm: (34 < 64 knots) Category 1 Hurricane (64 < 83 knots) Category 2 Hurricane (83 < 96 knots) Category 3 Hurricane (96 < 113 knots) Category 4 Hurricane (113 < 137 knots) Category 5 Hurricane ( > 137 knots)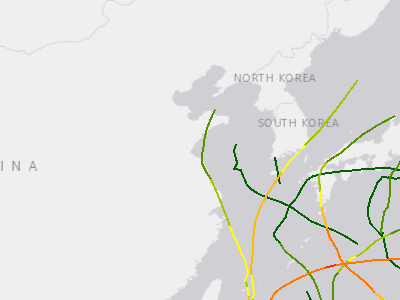
Historical Cyclone Tracks - 2022
Hazards and Events / Tropical Cyclone / Historical Cyclone Tracks / Historical Cyclone Tracks - 2022
Cyclone tracks for 2022 events.
Legend
Tropical Depression: (< 34 knots) Tropical Storm: (34 < 64 knots) Category 1 Hurricane (64 < 83 knots) Category 2 Hurricane (83 < 96 knots) Category 3 Hurricane (96 < 113 knots) Category 4 Hurricane (113 < 137 knots) Category 5 Hurricane ( > 137 knots)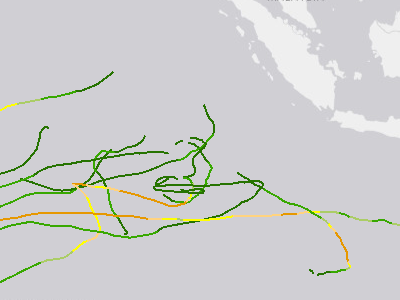
Historical Cyclone Tracks - 2023
Hazards and Events / Tropical Cyclone / Historical Cyclone Tracks / Historical Cyclone Tracks - 2023
Cyclone tracks for 2023 events.
Legend
 Tropical depression (W<34)
 Tropical storm [34<W<64]
 Category 1 [64<=W<83] Category 2 [83<=W<96]
 Category 3 [96<=W<113]
 Category 4 [113<=W<137]
 Category 5 [W >= 137]
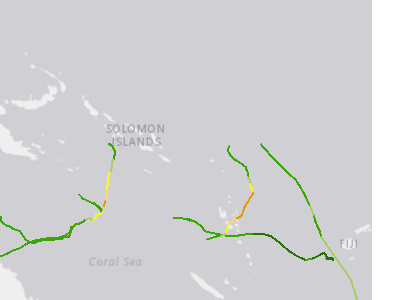
Historical Cyclone Tracks - 2024
Hazards and Events / Tropical Cyclone / Historical Cyclone Tracks / Historical Cyclone Tracks - 2024
Cyclone tracks for 2024 events.
Legend
Tropical depression (W<34) Tropical storm [34<W<64] Category 1 [64<=W<83] Category 2 [83<=W<96] Category 3 [96<=W<113] Category 4 [113<=W<137] Category 5 [W >= 137]
Positions and Segments
Hazards and Events / Tropical Cyclone / Positions and Segments / Storm Positions
Forecast, current and previous positions and segments of current tropical cyclones.
Legend
 Forecast Hurricane/Typhoon > 150 mph
 Forecast Hurricane/Typhoon > 74 mph
 Forecast Tropical Storm
 Forecast Tropical Depression
 Current Hurricane/Typhoon > 150 mph
 Current Hurricane/Typhoon > 74 mph
 Current Tropical Storm
 Current Tropical Depression
 Previous Hurricane/Typhoon > 150 mph
 Previous Hurricane/Typhoon > 74 mph
 Previous Tropical Storm
 Previous Tropical Depression
Tropical Cyclone Estimated Rainfall
Hazards and Events / Tropical Cyclone / Potential Impacts / Tropical Cyclone Estimated Rainfall
Estimated tropical cyclone rainfall amounts cumulative over the forecasted 5 day period. (Estimated Rainfall forecasted by Kinetic AC).
Legend
 >24 in (60.96 cm)
 12-24 in (30.48 - 60.96 cm)
 9-12 in (22.86 - 30.48 cm)
 6-9 in (15.24 - 22.86 cm)
 3-6 in (7.62 - 15.24 cm)
 1-3 in (2.54 - 7.62 cm)
 < 1 in (2.54 cm)
Tropical Cyclone Estimated Still Water Storm Surge
Hazards and Events / Tropical Cyclone / Potential Impacts / Tropical Cyclone Estimated Still Water Storm Surge
Estimated maximum still water levels which may occur during the forecasted 5 day period. Estimated water levels do NOT include wave run-up. (Estimated Still Water Storm Surge forecasted by Kinetic AC).
Legend
 >20 ft (6.10 m)
 15-20 ft (4.57 - 6.10 m) 12-15 ft (3.66 - 4.57 m)
 9-12 ft (2.74 - 3.66 m) 6-9 ft (1.82 - 2.74 m)
 3-6 ft (0.91 - 1.82 m)
 1-3 ft (0.3 - 0.91 m)
Tropical Cyclone Estimated Wind Impacts
Hazards and Events / Tropical Cyclone / Potential Impacts / Tropical Cyclone Estimated Wind Impacts
Estimated tropical cyclonic wind impacts which may occur over the forecasted 5 day period. (Wind hazard and impacts forecasted by Kinetic AC).
Legend
 Catastrophic Damage
 Severe Damage
 Widespread Damage
 Moderate Damage 5% of value
 Minor Damage; power out
 Trees Down; some power loss
 Branches Breaking
 Large Trees Sway
 Small Trees Sway
Recent Exposure - Tropical Cyclone
Hazards and Events / Tropical Cyclone / Recent Exposure - Tropical Cyclone
No active data when this snapshot was taken — service has data but none was visible at the chosen frame.
Geographic areas where people, infrastructure, or natural systems are at risk of impacts from tropical cyclones.
Legend
(no label)SmartAlerts - Cyclone
Hazards and Events / Tropical Cyclone / SmartAlerts - Cyclone
No active data when this snapshot was taken — service has data but none was visible at the chosen frame.
Branch: 14Sept_AS_Core_Migration
Legend
WARNING WATCH ADVISORY INFORMATION WARNING WATCH ADVISORY INFORMATION WARNING WATCH ADVISORY INFORMATION… +120 more
Storm Surge Risk (Category 1) - Belize, Guatemala, Honduras, Yucatán
Hazards and Events / Tropical Cyclone / Storm Surge Risk / Belize, Guatemala, Honduras, Yucatán / Storm Surge Risk (Category 1) - Belize, Guatemala, Honduras, Yucatán
No active data when this snapshot was taken — service has data but none was visible at the chosen frame.
Storm Surge Risk (Category 2) - Belize, Guatemala, Honduras, Yucatán
Hazards and Events / Tropical Cyclone / Storm Surge Risk / Belize, Guatemala, Honduras, Yucatán / Storm Surge Risk (Category 2) - Belize, Guatemala, Honduras, Yucatán
No active data when this snapshot was taken — service has data but none was visible at the chosen frame.
Storm Surge Risk (Category 3) - Belize, Guatemala, Honduras, Yucatán
Hazards and Events / Tropical Cyclone / Storm Surge Risk / Belize, Guatemala, Honduras, Yucatán / Storm Surge Risk (Category 3) - Belize, Guatemala, Honduras, Yucatán
No active data when this snapshot was taken — service has data but none was visible at the chosen frame.
Storm Surge Risk (Category 4) - Belize, Guatemala, Honduras, Yucatán
Hazards and Events / Tropical Cyclone / Storm Surge Risk / Belize, Guatemala, Honduras, Yucatán / Storm Surge Risk (Category 4) - Belize, Guatemala, Honduras, Yucatán
No active data when this snapshot was taken — service has data but none was visible at the chosen frame.
Storm Surge Risk (Category 5) - Belize, Guatemala, Honduras, Yucatán
Hazards and Events / Tropical Cyclone / Storm Surge Risk / Belize, Guatemala, Honduras, Yucatán / Storm Surge Risk (Category 5) - Belize, Guatemala, Honduras, Yucatán
No active data when this snapshot was taken — service has data but none was visible at the chosen frame.
Storm Surge Risk (Category 1) - Gulf and East Coasts (USA)
Hazards and Events / Tropical Cyclone / Storm Surge Risk / Gulf and East Coasts (USA) / Storm Surge Risk (Category 1) - Gulf and East Coasts (USA)
No active data when this snapshot was taken — service has data but none was visible at the chosen frame.
Storm Surge Risk (Category 2) - Gulf and East Coasts (USA)
Hazards and Events / Tropical Cyclone / Storm Surge Risk / Gulf and East Coasts (USA) / Storm Surge Risk (Category 2) - Gulf and East Coasts (USA)
No active data when this snapshot was taken — service has data but none was visible at the chosen frame.
Storm Surge Risk (Category 3) - Gulf and East Coasts (USA)
Hazards and Events / Tropical Cyclone / Storm Surge Risk / Gulf and East Coasts (USA) / Storm Surge Risk (Category 3) - Gulf and East Coasts (USA)
No active data when this snapshot was taken — service has data but none was visible at the chosen frame.
Storm Surge Risk (Category 4) - Gulf and East Coasts (USA)
Hazards and Events / Tropical Cyclone / Storm Surge Risk / Gulf and East Coasts (USA) / Storm Surge Risk (Category 4) - Gulf and East Coasts (USA)
No active data when this snapshot was taken — service has data but none was visible at the chosen frame.
Storm Surge Risk (Category 5) - Gulf and East Coasts (USA)
Hazards and Events / Tropical Cyclone / Storm Surge Risk / Gulf and East Coasts (USA) / Storm Surge Risk (Category 5) - Gulf and East Coasts (USA)
No active data when this snapshot was taken — service has data but none was visible at the chosen frame.
Storm Surge Risk (Category 1) - Hawai'i
Hazards and Events / Tropical Cyclone / Storm Surge Risk / Hawai'i / Storm Surge Risk (Category 1) - Hawai'i
No active data when this snapshot was taken — service has data but none was visible at the chosen frame.
Storm Surge Risk (Category 2) - Hawai'i
Hazards and Events / Tropical Cyclone / Storm Surge Risk / Hawai'i / Storm Surge Risk (Category 2) - Hawai'i
No active data when this snapshot was taken — service has data but none was visible at the chosen frame.
Storm Surge Risk (Category 3) - Hawai'i
Hazards and Events / Tropical Cyclone / Storm Surge Risk / Hawai'i / Storm Surge Risk (Category 3) - Hawai'i
No active data when this snapshot was taken — service has data but none was visible at the chosen frame.
Storm Surge Risk (Category 4) - Hawai'i
Hazards and Events / Tropical Cyclone / Storm Surge Risk / Hawai'i / Storm Surge Risk (Category 4) - Hawai'i
No active data when this snapshot was taken — service has data but none was visible at the chosen frame.
Storm Surge Risk (Category 1) - Hispaniola
Hazards and Events / Tropical Cyclone / Storm Surge Risk / Hispaniola / Storm Surge Risk (Category 1) - Hispaniola
No active data when this snapshot was taken — service has data but none was visible at the chosen frame.
Storm Surge Risk (Category 2) - Hispaniola
Hazards and Events / Tropical Cyclone / Storm Surge Risk / Hispaniola / Storm Surge Risk (Category 2) - Hispaniola
Storm Surge Risk (Category 3) - Hispaniola
Hazards and Events / Tropical Cyclone / Storm Surge Risk / Hispaniola / Storm Surge Risk (Category 3) - Hispaniola
No active data when this snapshot was taken — service has data but none was visible at the chosen frame.
Storm Surge Risk (Category 4) - Hispaniola
Hazards and Events / Tropical Cyclone / Storm Surge Risk / Hispaniola / Storm Surge Risk (Category 4) - Hispaniola
No active data when this snapshot was taken — service has data but none was visible at the chosen frame.
Storm Surge Risk (Category 5) - Hispaniola
Hazards and Events / Tropical Cyclone / Storm Surge Risk / Hispaniola / Storm Surge Risk (Category 5) - Hispaniola
No active data when this snapshot was taken — service has data but none was visible at the chosen frame.
Storm Surge Risk (Tropical Storm) - Hispaniola
Hazards and Events / Tropical Cyclone / Storm Surge Risk / Hispaniola / Storm Surge Risk (Tropical Storm) - Hispaniola
No active data when this snapshot was taken — service has data but none was visible at the chosen frame.
Storm Surge Risk (Category 1) - Puerto Rico
Hazards and Events / Tropical Cyclone / Storm Surge Risk / Puerto Rico / Storm Surge Risk (Category 1) - Puerto Rico
No active data when this snapshot was taken — service has data but none was visible at the chosen frame.
Storm Surge Risk (Category 2) - Puerto Rico
Hazards and Events / Tropical Cyclone / Storm Surge Risk / Puerto Rico / Storm Surge Risk (Category 2) - Puerto Rico
No active data when this snapshot was taken — service has data but none was visible at the chosen frame.
Storm Surge Risk (Category 3) - Puerto Rico
Hazards and Events / Tropical Cyclone / Storm Surge Risk / Puerto Rico / Storm Surge Risk (Category 3) - Puerto Rico
No active data when this snapshot was taken — service has data but none was visible at the chosen frame.
Storm Surge Risk (Category 4) - Puerto Rico
Hazards and Events / Tropical Cyclone / Storm Surge Risk / Puerto Rico / Storm Surge Risk (Category 4) - Puerto Rico
No active data when this snapshot was taken — service has data but none was visible at the chosen frame.
Storm Surge Risk (Category 5) - Puerto Rico
Hazards and Events / Tropical Cyclone / Storm Surge Risk / Puerto Rico / Storm Surge Risk (Category 5) - Puerto Rico
No active data when this snapshot was taken — service has data but none was visible at the chosen frame.
Storm Surge Risk (Category 1) - U.S. Virgin Islands
Hazards and Events / Tropical Cyclone / Storm Surge Risk / U.S. Virgin Islands / Storm Surge Risk (Category 1) - U.S. Virgin Islands
No active data when this snapshot was taken — service has data but none was visible at the chosen frame.
Storm Surge Risk (Category 2) - U.S. Virgin Islands
Hazards and Events / Tropical Cyclone / Storm Surge Risk / U.S. Virgin Islands / Storm Surge Risk (Category 2) - U.S. Virgin Islands
No active data when this snapshot was taken — service has data but none was visible at the chosen frame.
Storm Surge Risk (Category 3) - U.S. Virgin Islands
Hazards and Events / Tropical Cyclone / Storm Surge Risk / U.S. Virgin Islands / Storm Surge Risk (Category 3) - U.S. Virgin Islands
No active data when this snapshot was taken — service has data but none was visible at the chosen frame.
Storm Surge Risk (Category 4) - U.S. Virgin Islands
Hazards and Events / Tropical Cyclone / Storm Surge Risk / U.S. Virgin Islands / Storm Surge Risk (Category 4) - U.S. Virgin Islands
No active data when this snapshot was taken — service has data but none was visible at the chosen frame.
Storm Surge Risk (Category 5) - U.S. Virgin Islands
Hazards and Events / Tropical Cyclone / Storm Surge Risk / U.S. Virgin Islands / Storm Surge Risk (Category 5) - U.S. Virgin Islands
No active data when this snapshot was taken — service has data but none was visible at the chosen frame.
Coastline Watch-Warnings
Hazards and Events / Tropical Cyclone / Tropical Cyclone (USA) / Coastline Watch-Warnings
No active data when this snapshot was taken — service has data but none was visible at the chosen frame.
Legend
 Hurricane Watch
 Hurricane Warning
 Tropical Storm Watch
 Tropical Storm Warning
Potential Storm Surge Flooding (USA)
Hazards and Events / Tropical Cyclone / Tropical Cyclone (USA) / Potential Storm Surge Flooding (USA)
No active data when this snapshot was taken — service has data but none was visible at the chosen frame.
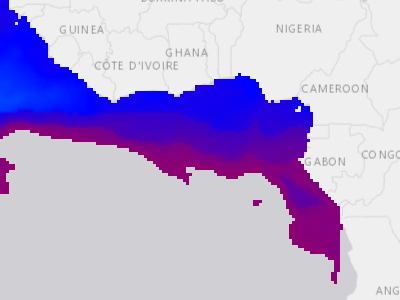
Tropical Cyclone Heat Potential
Hazards and Events / Tropical Cyclone / Tropical Cyclone Heat Potential
global/pdc_global_tropical_cyclone_heat_potential_dyn
Legend
Red: Band_1 Green: Band_2 Blue: Band_3Wind Radii
Hazards and Events / Tropical Cyclone / Wind Radii
Service returned zero features at the time of this snapshot — the service exists but is currently empty.
Estimated extent of 34 knot, 50 knot and 64 knot winds at current and forecast positions for current tropical cyclones.
Legend
 Winds >= 64 Knots (73 mph)
 Winds >= 50 Knots (58 mph)
 Winds greater than or equal to (>=) 34 Knots (39 mph)
Hazards and Events / Tsunami (7)
Estimated First Wave Arrival Times
Hazards and Events / Tsunami / Estimated First Wave Arrival Times
Estimated first wave arrival time forecasts for a pre-determined set of coastal locations from current time, updated every 5 minutes in real-time during a tsunami event. The time unit is expressed in hours, positive numbers for forward forecasts, and negative numbers for those locations where first waves have already passed.
Legend
 0 - 3 hours
 3 - 6 hours
 Greater than 6 hours
Historical Tsunami Events
Hazards and Events / Tsunami / Historical Tsunami / Historical Tsunami Events
Origination points of global historical tsunami events.
Legend
 (no label)
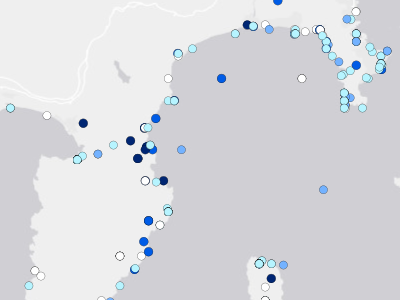
Historical Tsunami Run-Up
Hazards and Events / Tsunami / Historical Tsunami / Historical Tsunami Run-Up
Locations where tsunami waves were observed by eyewitnesses, reconnaissance surveys, tide gauges, and deep-ocean sensors.
Legend
 Not Recorded
 0 - 1.5 m / 0 - 5 ft
 1.5 - 3 m / 5 - 10 ft
 3 - 6 m / 10 - 20 ft
 6 - 15 m / 20 - 50 ft
 15 - 25 m / 50 - 82 ft
 Above 25 m / 82 ft
SmartAlerts - Tsunami
Hazards and Events / Tsunami / SmartAlerts - Tsunami
SmartAlert areas for tsunami hazards.
Legend
WARNING WATCH ADVISORY INFORMATION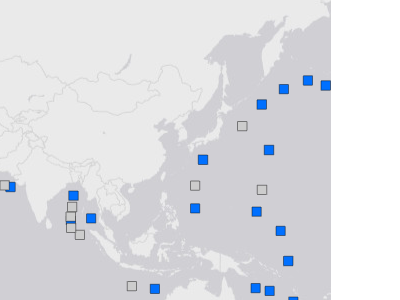
Tsunami Monitoring Stations (DART Buoys)
Hazards and Events / Tsunami / Tsunami Monitoring Stations (DART Buoys)
List of Deep-ocean Assessment and Reporting of Tsunami (DART) stations at sites in regions with a history of generating destructive tsunamis. Locations and links to display pages showing the operational status and raw data streams from individual stations.
Legend
 Active
 No recent data
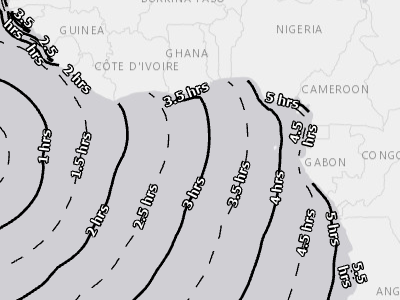
Tsunami Travel Time
Hazards and Events / Tsunami / Tsunami Travel Time
The tsunami travel time layer represents the expected travel time from earthquake epicenter to coastal locations. The contour lines are generated at half-hour intervals. This information uses message received from the Pacific Tsunami Warning Center to run the Tsunami Travel Time (TTT) model to generate the contours.
Legend
 Hour
 Half Hour
 <all other values>

Tsunami Watch and Warning Zones
Hazards and Events / Tsunami / Tsunami Watch and Warning Zones
Breakdowns of tsunami travel times into four impact zones: post-impact zone where first wave is already passed, warning zone where first wave is expected between 0 to 3 hours, watch zone where first wave is expected between 3 to 6 hours, and beyond 6 hours.
Legend
 Wave passed
 Warning (Within 3 hours of first wave)
 Watch (Within 3-6 hours of first wave)
 Beyond 6 hours of first wave
Hazards and Events / Volcano (7)
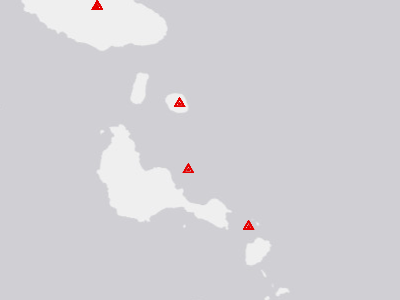
Historical Volcanic Eruptions
Hazards and Events / Volcano / Historical Volcano / Historical Volcanic Eruptions
Global historical volcanic eruptions.
Legend
 Volcanic Eruption
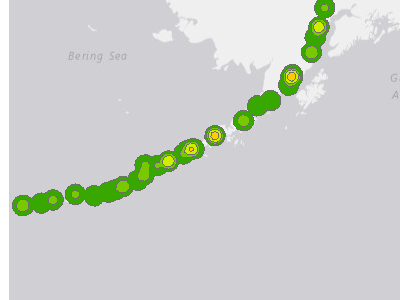
Volcano Density
Hazards and Events / Volcano / Historical Volcano / Volcano Density
Density of Volcanic eruptions.
Legend
Very High High
 Medium/High
 Medium
 Low/Medium
 Low

Recent Exposure - Volcano
Hazards and Events / Volcano / Recent Exposure - Volcano
PDC Hazard Exposure area for Volcano Hazards.
Legend
(no label)
SmartAlerts - Volcano
Hazards and Events / Volcano / SmartAlerts - Volcano
SmartAlert areas for volcano hazards.
Legend
WARNING WATCH ADVISORY INFORMATION
Ash Clouds Forecast
Hazards and Events / Volcano / Volcano Ash Clouds / Ash Clouds 12 Hour
No active data when this snapshot was taken — service has data but none was visible at the chosen frame.
Volcanic ash cloud forecast at 6-, 12-, and 18-hour horizons. Aggregated from PDC's individual Ash Clouds layers into one animated time series.
Legend
 (no label)
Ash Clouds Initial
Hazards and Events / Volcano / Volcano Ash Clouds / Ash Clouds Initial
No active data when this snapshot was taken — service has data but none was visible at the chosen frame.
Advisories issued by Volcanic Ash Advisory Centers (VAAC) supporting monitoring of volcano ash activities. Features show forecast area and flight level of initial forecast T+0.
Legend
 (no label)
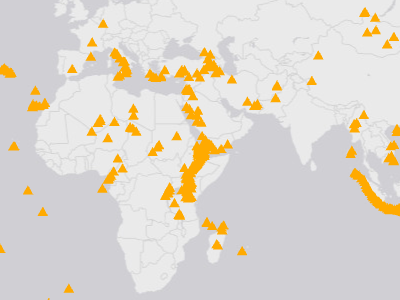
Volcano Locations
Hazards and Events / Volcano / Volcano Locations
Volcano locations of the world.
Legend
 (no label)
Hazards and Events / Wildfire (16)
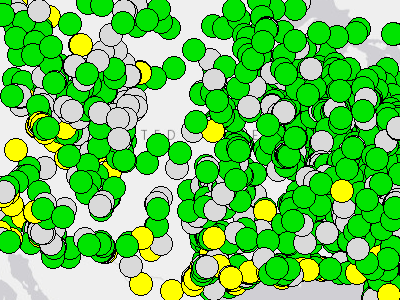
Air Quality Index (AQI)
Hazards and Events / Wildfire / Air Quality Index (AQI)
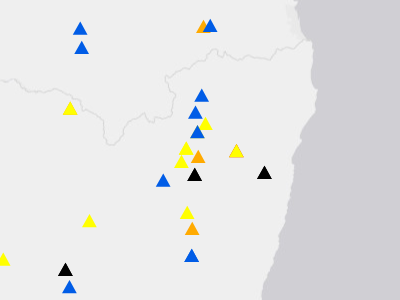
Historical Large Fires
Hazards and Events / Wildfire / Historical Wildfire / Historical Large Fires
Global historical fires.
Legend
 Warning
 Watch
 Advisory
 Information
 No Severity Information
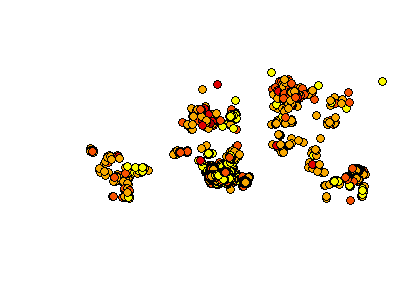
Potential Large/Intense Wildfires
Hazards and Events / Wildfire / Potential Large/Intense Wildfires
Potential Wildfire Perimeters (24 Hours)
Hazards and Events / Wildfire / Potential Wildfire Perimeters (24 Hours)
No active data when this snapshot was taken — service has data but none was visible at the chosen frame.
Recent Exposure - Wildfire
Hazards and Events / Wildfire / Recent Exposure - Wildfire
Geographic areas where people, infrastructure, or natural systems are at risk of impacts from wildfire.
Legend
(no label)
SmartAlerts - Wildfire
Hazards and Events / Wildfire / SmartAlerts - Wildfire
SmartAlert areas for wildlife hazards.
Legend
WARNING WATCH ADVISORY INFORMATION
Current Wildfire Incidents (USA)
Hazards and Events / Wildfire / Wildfire (USA) / Current Wildfire Incidents (USA)
Current Wildfire Perimeters (USA)
Hazards and Events / Wildfire / Wildfire (USA) / Current Wildfire Perimeters (USA)
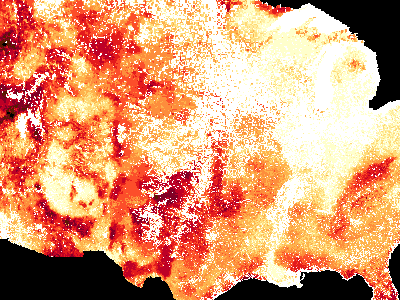
Wildfire Burn Probability (USA)
Hazards and Events / Wildfire / Wildfire (USA) / Wildfire Burn Probability (USA)
National data on burn probability (BP) were generated for the conterminous United States (CONUS), Alaska, and Hawaii using a geospatial Fire Simulation (FSim) system developed by the USDA Forest Service Missoula Fire Sciences Laboratory. The FSim system includes modules for weather generation, wildfire occurrence, fire growth, and fire suppression. FSim is designed to simulate the occurrence and growth of wildfires under tens of thousands of hypo
Legend
 0
 0 to 1-in-10,000
 1-in-10,000 to 1-in-4,643
 1-in-4,643 to 1-in-2,154
 1-in-2,154 to 1-in-1,000
 1-in-1,000 to 1-in-464
 1-in-464 to 1-in-215
 1-in-215 to 1-in-100
 1-in-100 to 1-in-46
 1-in-46 to 1-in-22
 1-in-22 to 1-in-10
 1-in-10 to 1-in-8
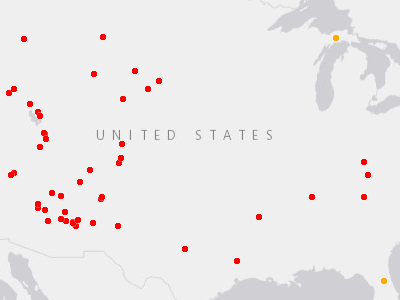
Wildfire New Starts (Last 24 Hours) (USA)
Hazards and Events / Wildfire / Wildfire (USA) / Wildfire New Starts (Last 24 Hours) (USA)
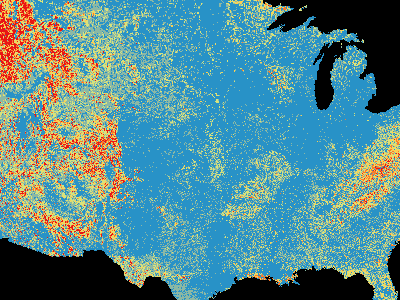
Wildfire Suppression Difficulty Index (USA)
Hazards and Events / Wildfire / Wildfire (USA) / Wildfire Suppression Difficulty Index (USA)
Wildfire Suppression Difficulty Index (SDI) 97th Percentile is a rating of relative difficulty in performing fire control work under regionally appropriate fuel moisture and 20 mph uphill winds (@ 20 ft); Wildfire Suppression Difficulty Index (SDI) 90th Percentile is a rating of relative difficulty in performing fire control work under regionally appropriate fuel moisture and 15 mph uphill winds (@ 20 ft). Wildfire Suppression Difficulty Index (SDI) 80th Percenti
Legend
 Lowest Difficulty (0-10)
 10-20
 20-40
 40-70
 70-100
 Highest Difficulty (>100)
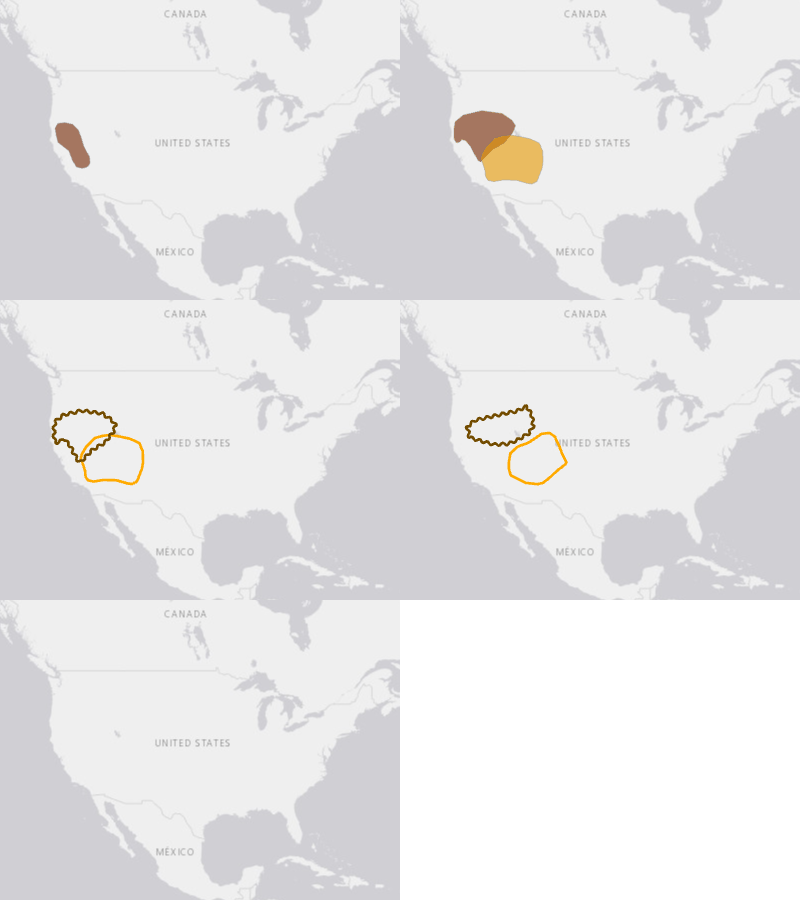
Wildfire Weather Outlook (USA)
Hazards and Events / Wildfire / Wildfire (USA) / Wildfire Weather Outlook (USA) / Day 1
The Fire Weather Outlooks are intended to delineate areas of the continental U.S. where pre-existing fuel conditions, combined with forecast weather conditions during the next 8 days, will result in a significant threat for the ignition and/or spread of wildfires.
Legend
 Elevated
 Critical
 Extreme
 Iso DryT Scattered DryT Elevated Critical Extreme Iso DryT Scattered DryT
 Marginal (10%)
 Critical (40%)
… +22 more
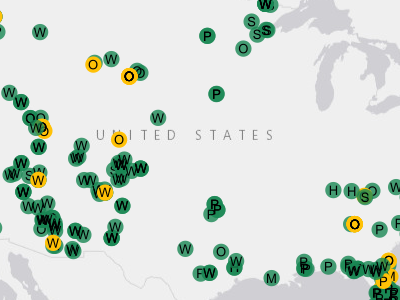
Wildfire Weather Spot Forecast (USA)
Hazards and Events / Wildfire / Wildfire (USA) / Wildfire Weather Spot Forecast (USA)
NWS Fire Weather Spot Web Services is made up of Site-specific (SPOT) forecasts . The web service is updated every 15 minutes. Spot Forecast are issued by WFOs in support of wildfire management, and natural resource management. These forecasts aid the land management and fire control agencies in protec
Legend
 W = Wildfire Pending
 W = Wildfire Completed
 P = Prescribed Pending
 P = Prescribed Completed
 M = Marine Pending
 M = Marine Completed
 H = Hazmat Pending
 H = Hazmat Completed
 S = SAR Pending
 S = SAR Completed
 O = Other Pending
 O = Other Completed
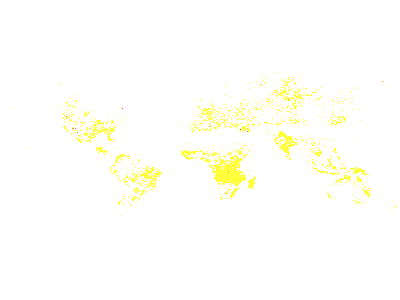
Wildfire Hotspot Intensity Grid (24 Hours)
Hazards and Events / Wildfire / Wildfire Hotspot Intensity Grid (24 Hours)
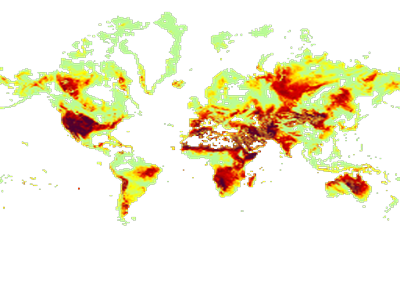
Wildfire Initial Spread Index
Hazards and Events / Wildfire / Wildfire Initial Spread Index
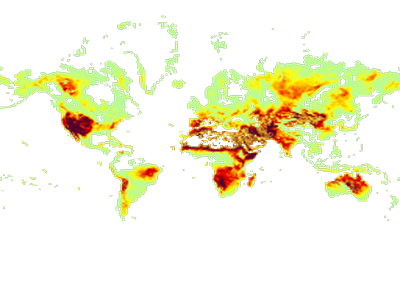
Wildfire Weather Index
Hazards and Events / Wildfire / Wildfire Weather Index
Hazards and Events / Winter Storm (3)
Recent Exposure - Winter Storm
Hazards and Events / Winter Storm / Recent Exposure - Winter Storm
Service returned zero features at the time of this snapshot — the service exists but is currently empty.
Geographic areas where people, infrastructure, or natural systems are at risk of impacts from winter storms.
Legend
(no label)SmartAlerts - Winter Storm
Hazards and Events / Winter Storm / SmartAlerts - Winter Storm
Service returned zero features at the time of this snapshot — the service exists but is currently empty.
SmartAlert areas for winterstorm hazards.
Legend
WARNING WATCH ADVISORY INFORMATIONWinter Storm Warning Areas (USA)
Hazards and Events / Winter Storm / Winter Storm Warning Areas (USA)
No active data when this snapshot was taken — service has data but none was visible at the chosen frame.
Active winter storm warnings for the United States.
Legend
(no label)PDC Composite (1)
PDC Active Hazards (styled)
PDC Composite
Live active hazards from the DAE V2 API rendered as colored severity badges with type icons.
Legend
 Warning
 Watch
 Advisory
 Information
 Termination
(white icon inside indicates hazard type — flood, wildfire, cyclone, etc.)
User layers (2)
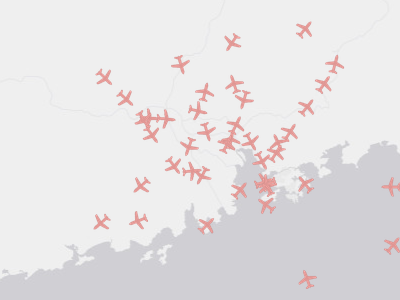
Live Flights
User layers
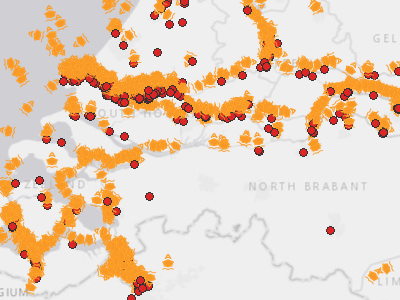
Live Ships
User layers
Ready to Integrate?
Pick the layers most relevant to your use case and our team will configure access.