


DisasterAWARE Weekly Intelligence Brief — October 29 to November 7, 2026
In the early hours of November 5 the Toccoa River rose about 15 feet in nine hours and went past a record that had stood since 1990. A mesonet site near Blue Ridge, Georgia measured 11.19 inches of rain in 12 hours, 10.28 of them in six, and NWS Atlanta said both totals exceeded the 1-in-1,000-year values in NOAA's rainfall atlas. The National Weather Service gauge at Copperhill, Tennessee, where the Toccoa becomes the Ocoee, crested at 18.05 feet at 11:00 UTC (6:00 a.m. Eastern), 4 feet above major flood stage and above the 17.75-foot record of February 1990. Every other crest in that gauge's history is under 10 feet. The Atlanta and Morristown forecast offices issued five flash flood warnings and one river flood warning for the storm, and raised three of them to flash flood emergencies, the first at 03:47 UTC, nearly five hours before the river reached major stage. One woman died when her car was swept away in Murray County, and state emergency officials counted about 100 rescues, nearly all in Fannin County.
The same system then ran up the Atlantic coast. Elsewhere this week: a flash flood emergency each for Pearl River County, Mississippi and Brevard County, Florida, 51 flash-flood reports in Arizona, Brazil's Paraná under a thunderstorm warning covering 38.5 million people as an F2 tornado cut power to more than 85,000 homes in Maringá, and a magnitude 6.1 earthquake off Japan's Pacific coast.
How to read every number in this brief. We keep two kinds of numbers apart. Alert-tier numbers are products an agency issued (warnings, watches, advisories): a forecast with a defined area and, in DisasterAWARE, an estimated population inside that footprint. Observed-tier numbers are measurements and reports of what happened: gauge readings, NWS Local Storm Reports, damage surveys. Where we compare them, the question is always the same: at the time and place of each impact, what warning was in force?
Alert tier (products issued, complete NWS record via the Iowa Environmental Mesonet, October 29 to November 7):
Observed tier (NWS Local Storm Reports via IEM, same window):
DisasterAWARE record: 266 active and 1,655 expired actual-event hazard records in the window after the weekly filter, with 11,482 Enterprise products attached.
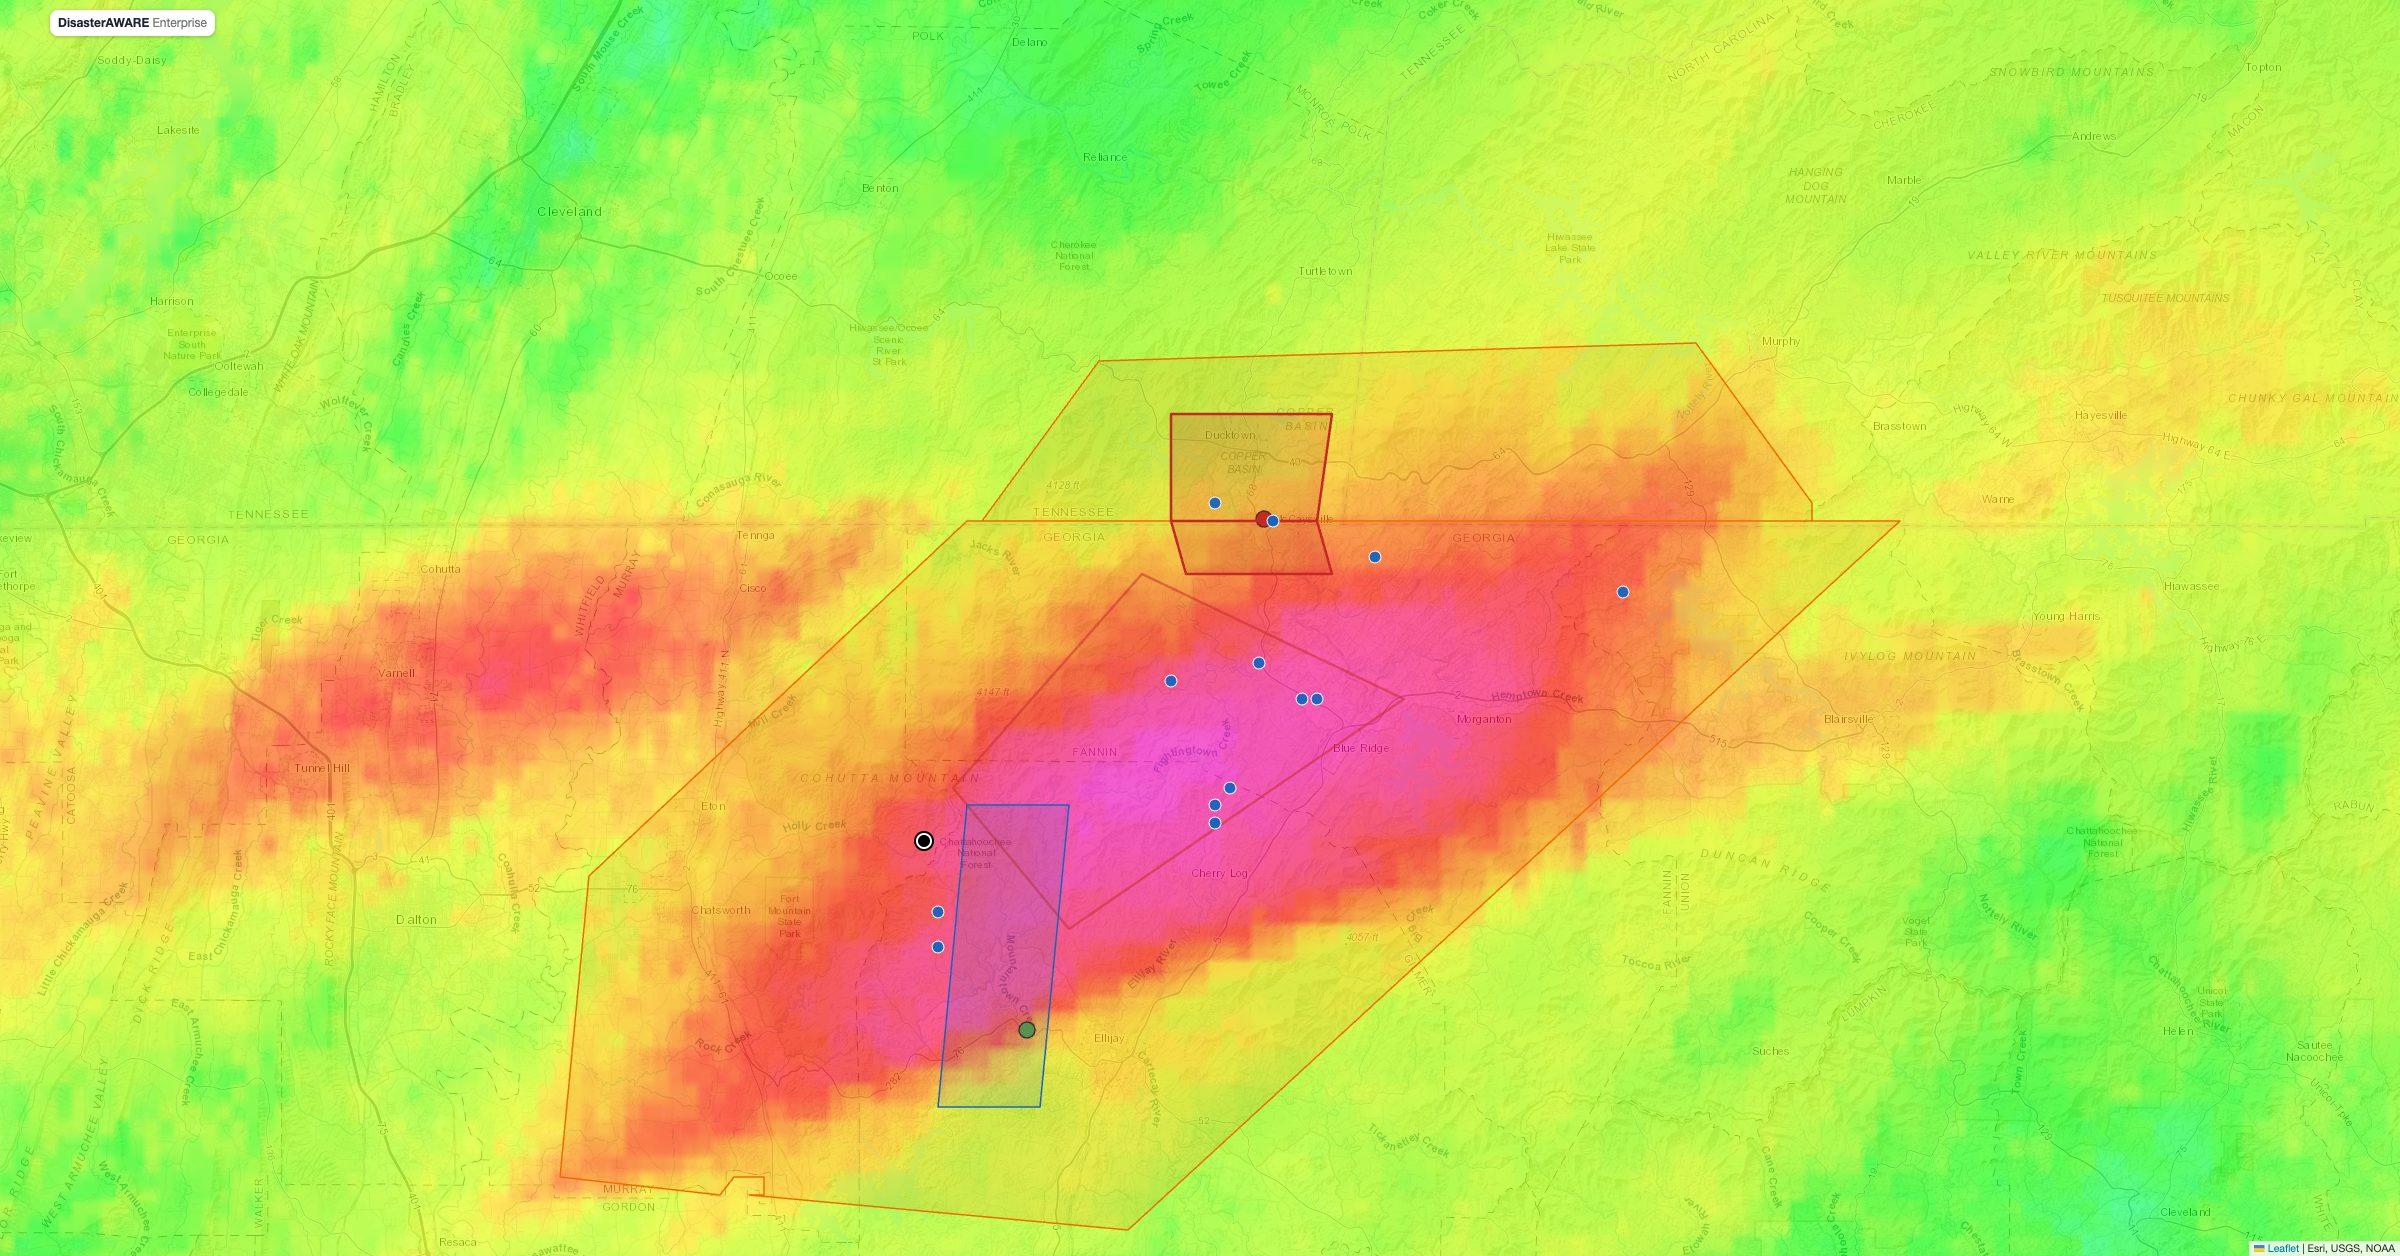
The map replays the night hour by hour. Drag the slider or press Play: warnings appear when they were issued and fade when they expired, storm reports appear when they were filed, and the two gauge markers change colour as the rivers climb through action, minor, moderate and major stage. The hydrographs on the right show the Copperhill and Mountaintown Creek readings against their flood categories and their previous records. The red band along the river through McCaysville and Copperhill is the National Weather Service's modelled inundation extent for the Copperhill gauge (the stage-based CatFIM library, mapped at one-foot stage intervals); it follows the gauge as you replay, growing from the 6-foot action band to the 18-foot band at the crest, and stays at the highest stage reached. It is a modelled extent, and the map labels it that way. At the crest a second layer appears on top of it: modelled flood depth in 10-metre cells, from a preview record built by the DisasterAWARE flood enhancer for this brief using the same NWS CatFIM library and the Copperhill crest. Through the centre of McCaysville and Copperhill it maps depths of two to six feet between the river and the main streets, which agrees with the storm report of two to three feet at Tennessee Avenue and Blue Ridge Drive; the deepest class is mostly the river channel. It is a model, not a measurement, and the map says so on every hover.
Explore the map. The modelled depth at the crest, the CatFIM inundation, warnings, storm reports, fatality and two main gauges are on by default. Five more layers are off so the picture stays readable. Open the layer switcher at the top right and turn on:
Every feature has a hover label and a click popup naming its source and tier. Deep links work: #t=2026-11-05T09:00Z jumps the clock, #layers=mrms,nfhl turns layers on.
Rain began over the Blue Ridge on the evening of November 4 and fell at its heaviest between about 8 p.m. and 2 a.m. Eastern, according to a mesonet report from Mineral Bluff. The first storm report came from McCaysville at 02:45 UTC (10:45 p.m.): "flooding reported". By 03:15 UTC roads near Mountaintown were under water; at 04:06 UTC water was in a home on Old CCC Camp Road in Murray County; at 04:27 and 04:38 UTC homes near Cherry Log were flooding and Boardtown Road was blocked by a mudslide; at 04:35 UTC swift water was approaching businesses on Blue Ridge Drive; at 04:47 UTC a water rescue was under way near Epworth. At 07:00 UTC (2:00 a.m.) a mesonet site two miles northwest of Blue Ridge reported 11.19 inches; a second site near Nottely Dam reported a storm total of 6.24 inches. NWS Atlanta's own statement put the Blue Ridge totals at 11.19 inches in 12 hours and 10.28 inches in six, and said both exceeded the 1-in-1,000-year rainfall values in NOAA Atlas 14, the Weather Service's national rainfall-frequency atlas.
The creeks answered first. Mountaintown Creek near Ellijay reached its record 14.9 feet at 06:30 UTC, nearly five feet above the 10.03-foot record set in December 2015 and just short of moderate stage. The Toccoa/Ocoee at Copperhill crossed major stage (14 feet) at 08:30 UTC, crested at 18.05 feet at 11:00 UTC and was still at 17.84 feet at 12:00 UTC; the gauge then reported nothing for three and a half hours and was at 12.43 feet when readings resumed at 15:30 UTC, so the timing of the recession is not known. Even so it is a flash-flood hydrograph on a reach that normally behaves like a mountain stream. The upper Toccoa near Dial, above Blue Ridge Lake, peaked at only 3.22 feet: the flood came from the tributaries below the dam, draining the ridges where the radar put the heaviest rain.
Downstream, McCaysville and Copperhill, two towns that share a state line and a river, took the crest through their centres: at 11:00 UTC, the hour of the crest, a storm report from McCaysville put water an estimated two to three feet deep near the intersection of Tennessee Avenue and Blue Ridge Drive, the one observed depth in the record. Cleanup reports on November 6 described businesses and homes along the river gutted by water and mud. Georgia's governor declared a state of emergency and the city of McCaysville declared its own.
See every warning next to what it verified
DisasterAWARE puts issued warnings and observed impacts on one map — with the people, households and infrastructure inside each footprint.
The warnings came early and escalated in step with the water. NWS Peachtree City (Atlanta) issued its first flash flood warning for the area at 01:55 UTC, fifty minutes before the first storm report. At 02:30 UTC (9:30 p.m.) it issued a second warning for northwest Fannin and north-central Gilmer counties, and at 03:47 UTC (10:47 p.m.) upgraded it to a flash flood emergency, the NWS's highest flood product, reserved for severe threats to life and catastrophic damage. A river flood warning for Mountaintown Creek followed at 06:27 UTC, reporting 14.5 feet against the 2015 record of 10.0 feet. NWS Morristown warned Polk County, Tennessee and Cherokee County, North Carolina at 07:19 UTC and issued a separate flash flood emergency for the Copperhill area at 08:58 UTC, half an hour after the gauge crossed major stage; Atlanta issued a third emergency for Fannin at 10:08 UTC, an hour before the crest. In DisasterAWARE the first two products arrived within minutes as warning-grain records with exposure: the combined Morristown and Peachtree City flash flood warning record, covering the basin from 01:55 to 14:15 UTC, held an estimated 4,890 people, 1,960 households and $380 million of infrastructure; the Gilmer County river warning 3,940 people and $179 million. A third record, for the Fannin County extension issued at 13:57 UTC, held 3,150 people and $251 million.
The death. Julie Barrs, 56, of Ellijay, died when her car was swept away on Old CCC Camp Road in Murray County; the county medical examiner identified her on November 6, and the sheriff's incident report, cited by the Atlanta Journal-Constitution, puts the time shortly before 10 p.m. Eastern on November 4 (about 02:50 UTC), with her body found about noon the next day two miles downstream. Checked against the warning polygons, the location (the map places it at the 04:06 UTC storm report on the same block, so it is approximate) was inside the 01:55 UTC flash flood warning, issued 55 minutes earlier, and inside the DisasterAWARE alert footprint for the event. It was outside all three emergency polygons, which covered Fannin, Gilmer and Polk counties to the east; the nearest, the Fannin and Gilmer emergency, began about 2 km to the east and did not exist until an hour after she was swept away. That pattern, a fatal crossing inside a warning but outside the emergency upgrade, is the same one we found twice in New Mexico in October: the flood that kills is often the one on the small creek at the edge of the warned area, not the one on the river making the headlines.
The rescues. Georgia's emergency management director put the count at 100 rescues in Georgia, 97 of them in Fannin County, which was under an emergency from 03:47 UTC. Tennessee's emergency agency told WSMV that 68 people were rescued in Polk County. The one rescue in the storm-report record (Epworth at 04:47 UTC) falls inside the emergency polygon in force at that time.
What the gauges add. A flash flood emergency is an alert-tier product; the 18.05-foot reading is observed, and it settles the argument about scale. The Copperhill gauge's crest record goes back to the 1940s with only one crest above 10 feet before this week, the 17.75 feet of February 16, 1990. Thursday's crest beat it by 0.3 feet on a single night's rain.
The same storm, farther south and east. NWS New Orleans issued a flash flood emergency for Pearl River County, Mississippi at 02:47 UTC on November 1, and NWS Melbourne one for Brevard County, Florida at 12:56 UTC on November 2 as the system crossed the Gulf coast and the peninsula. Florida and Louisiana each logged 23 flash-flood reports. The river flood warning for Florida's Treasure Coast on November 3 carried the largest US flood-warning footprint of the week in DisasterAWARE: an estimated 906,000 people and $98 billion of infrastructure.
Arizona and New Mexico, the long tail. The October pattern that produced our last brief ended with 51 flash-flood reports in Arizona and 45 river-flood reports in New Mexico in this window. NWS Flagstaff issued 17 flash flood warnings, the most of any office nationwide, and a central Arizona flash flood warning on October 31 covered an estimated 419,000 people.
Southern Brazil. INMET kept thunderstorm warnings over the South and Southeast through the window. The largest, issued November 2 for Paraná, São Paulo and Mato Grosso do Sul, covered 38.5 million people, 13.9 million households and $2.19 trillion of infrastructure. In the early hours of that day a tornado crossed Maringá: the state meteorological service Simepar classified it on November 3 as an F2 with a 15 km track and winds of 180 to 250 km/h, per the Paraná state news agency. About 85,000 to 88,000 homes lost power, the city declared a state of public calamity and the fire department's headquarters lost its roof.
Japan. A magnitude 6.1 earthquake struck 144 km southeast of Hasaki, Chiba Prefecture at 10:39 UTC on November 6 at a depth of 29 km, per the USGS's revised location. The Japan Meteorological Agency issued no tsunami warning or advisory, only a forecast of slight sea-level change, and no immediate damage was reported.
Also this week. Syria's emergency ministry had a flash flood warning covering 14 governorates and the Jazira region, 17.3 million people, from October 27 to 30. The Mekong River Commission kept riverine flood watches in force for My Thuan and Can Tho in Vietnam, 19.5 million people in the footprint. A heat warning for the Sahel issued November 5 covers 118 million people for the coming week. Heavy snow of 20 to 50 cm was forecast for Tajikistan, eastern Afghanistan and northern Pakistan.
Every product in this brief, from a 30-minute flash flood warning for one county to an INMET warning covering 38.5 million people, arrives in DisasterAWARE as a geocoded record with its footprint, the population, households and infrastructure inside it, and the issuing agency's text. For the Toccoa flood that meant warning records with exposure estimates within minutes of the first two products, which is what an emergency manager or an insurer with assets in Fannin County needed at 9:30 p.m. The observed layer, gauges, storm reports and the rainfall field, is what this brief adds afterwards, and it is the layer that tells you which warnings verified.
How high did the Toccoa River get at McCaysville?
The NWS gauge at Copperhill, Tennessee, just across the state line from McCaysville, crested at 18.05 feet at 11:00 UTC (6:00 a.m. Eastern) on November 5, 2026. Major flood stage there is 14 feet. The previous record was 17.75 feet on February 16, 1990.
Was the November 2026 Georgia flood really a 1,000-year event?
NWS Atlanta said the Blue Ridge rainfall, 11.19 inches in 12 hours and 10.28 inches in six, exceeded the 1-in-1,000-year values in NOAA Atlas 14, which means rainfall with roughly a 0.1 percent chance of occurring in any given year at that location, not something that happens once a millennium. The measured facts are those totals and a river crest above a 36-year-old record.
Were people warned before the Toccoa flooded?
Yes. NWS Peachtree City issued a flash flood warning at 01:55 UTC, before the first storm report, and upgraded its Fannin and Gilmer warning to a flash flood emergency at 03:47 UTC, nearly five hours before the river at Copperhill reached major flood stage. The one death, in Murray County at about 02:50 UTC, occurred inside the 01:55 UTC warning area, before any emergency existed and outside the emergency polygons issued later for the counties to the east.
What is the difference between a flash flood warning and a flash flood emergency?
Both are alert-tier NWS products. A flash flood warning means flash flooding is imminent or occurring in the warned area. A flash flood emergency is an upgrade the forecast office adds when it has reports of a severe threat to human life and catastrophic damage; it is rare, and five were issued nationwide this week.
Sources: NWS warnings, flash flood emergency upgrades and warning polygons via the Iowa Environmental Mesonet VTEC archive; NWS Local Storm Reports via IEM; NOAA National Water Prediction Service gauge observations, flood categories and historic crests (provisional); NWS stage-based categorical flood inundation maps (CatFIM, experimental, HAND-based) for the Copperhill gauge; modelled depth at the crest from a DisasterAWARE flood-enhancer preview record (CatFIM/HAND, USGS 03559500 stage, 10 m cells, built 2026-11-07, not yet in the historical archive); NOAA MRMS radar-estimated 24-hour precipitation via IEM; FEMA National Flood Hazard Layer; DisasterAWARE Enterprise warning records and exposure estimates; USGS National Earthquake Information Center; INMET, the Mekong River Commission and the Syrian emergency ministry as ingested by DisasterAWARE; CNN, the Associated Press, the Atlanta Journal-Constitution, Fox 5 Atlanta, WSMV, and Paraná's state news agency (AEN) and meteorological service (Simepar) for impact reporting as cited. Exposure figures are estimates for the alert footprint at issuance, not damage counts.



Decision-ready intelligence for understanding what's happening, what is impacted, and what to do next. Global hazard, severe weather, catastrophe, and physical risk intelligence trusted by governments, enterprises, insurers, humanitarian organizations, and technology platforms worldwide.
Request DemoContact Us

