


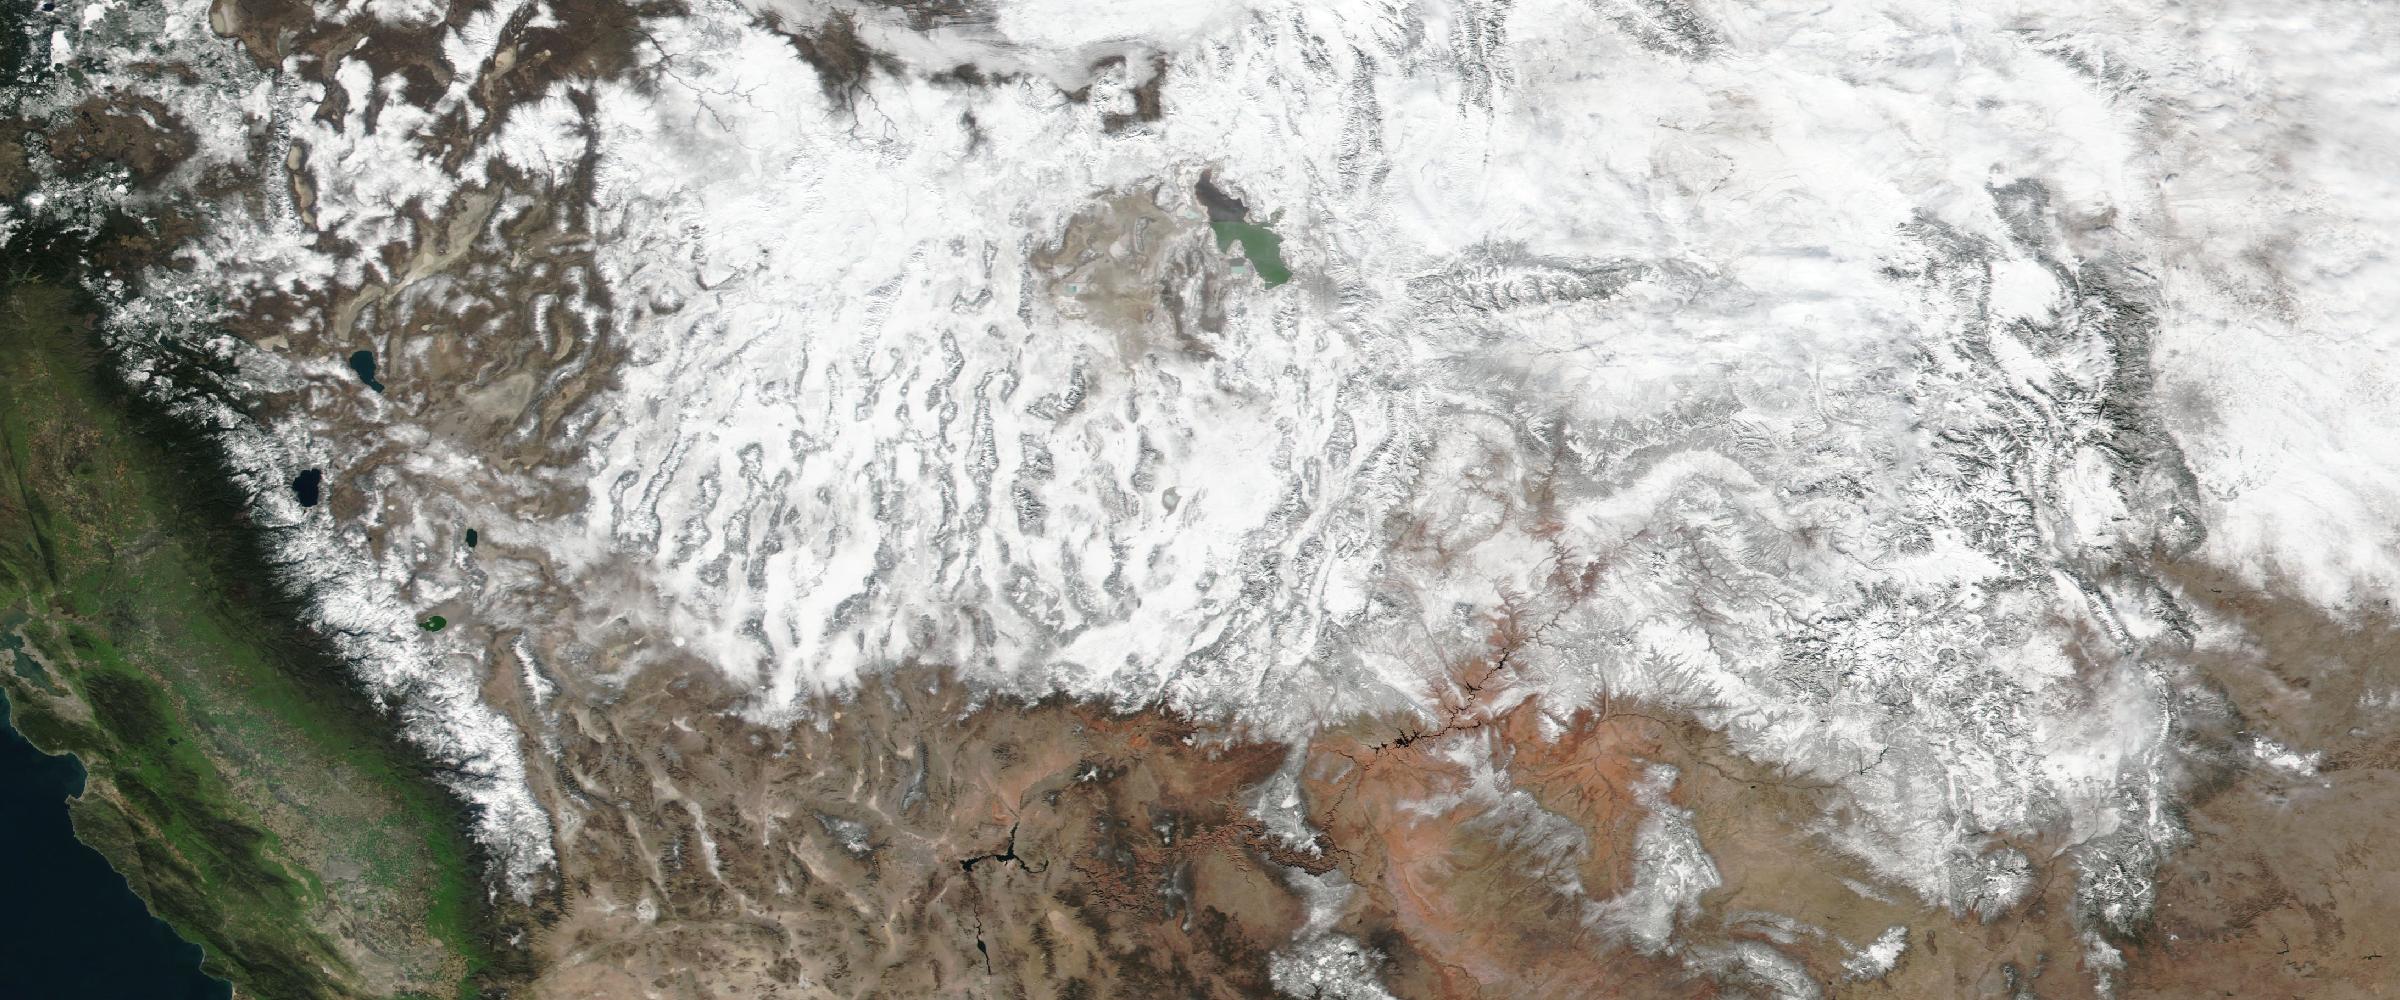
We checked the snowpack near 17 ski regions in every strong El Niño winter since 1972. The pattern is real, the exceptions are big, and one of the winners has a famous bust.
A very strong El Niño is on the way this winter — NOAA gives a 75% chance it becomes the strongest on its official index since 1950 (our full El Niño explainer covers the forecasts and the jet-stream mechanics). For skiers, the question is simpler: where will it snow?
To answer it, we pulled the April 1 snowpack — the standard end-of-season measure of how much water the snow holds — from public USDA snow-monitoring stations near 17 ski regions, for every strong El Niño winter since 1972, and compared each one with that station's 1991–2020 median. The short version:
Each row is a ski region; each dot is one strong El Niño winter; the black tick is the median. Two things stand out. The medians line up from wettest in the Southwest to driest in Washington, just as the textbook El Niño pattern predicts. And the spread in almost every region is enormous — which is the more useful thing to know if you are planning a trip.
Six winters since 1972 count as strong El Niños on NOAA's official relative index: 1972-73, 1982-83, 1991-92, 1997-98, 2009-10 and 2015-16. We show 2023-24 separately, as a hollow circle, because it only reached moderate strength on that index.
Median April 1 snowpack in strong El Niño winters: Stevens Pass 76%, Mt Baker 79%, Crystal and Paradise 84%, Mt Hood 98%.
This is the strongest and most consistent signal in the data. The Mt Baker and Stevens Pass regions came in below normal in every strong El Niño winter with data, mostly well below, and no station there has finished a strong El Niño winter above 110% of normal. The mechanism is the one in every El Niño explainer: the storm track shifts south, and the storms that do arrive carry milder Pacific air.
Mt Hood is the partial exception, near normal in 1982-83, 1997-98 and 2015-16 — but its worst year, 1991-92, came in at 42% across its two stations.
The recent memory is 2023-24, a moderate El Niño on NOAA's official index. On New Year's Eve, the station near Mt Baker held just 35% of its normal snowpack for the date. Stevens Pass pushed back its planned December 1 opening for lack of snow, and Washington declared a statewide drought in April 2024 with snowpack at 68% of normal.
Big Sky 89%, Jackson Hole and the Tetons 96%, Sun Valley 96%.
Not a disaster, but a tilt the wrong way — and a notable flip from La Niña winters, when the same stations have typically run around 110% of normal. The spread is wide. 1982-83 was huge across the region (Sun Valley's Mount Baldy course recorded the highest April 1 value in its 76-year record); 1991-92 and 2009-10 were poor. Big Sky's Lone Mountain station finished 2023-24 at 75%, in the bottom tenth of its 35-year record.
Cottonwood Canyons 108%, Park City and Deer Valley 98%, Summit County and Vail 97%, Wolf Creek and the San Juans 111%.
If you ski the Wasatch or the I-70 corridor, strong El Niño winters tell you close to nothing. Summit County's strong-El-Niño median is essentially the same as its La Niña and neutral medians. In the Cottonwood Canyons — measured at Snowbird, Brighton and Big Cottonwood — strong El Niño winters ranged from 63% (1991-92) to 161% (1982-83), and 2023-24 was a big year at 129%.
Park City and Deer Valley sit on the other side of the ridge, where storms have already dropped much of their moisture on the Cottonwoods. The station there, Thaynes Canyon at 9,260 feet on Park City Mountain, normally holds about 21 inches of water in its snowpack on April 1, against about 37 at Snowbird. But the El Niño pattern is the same on both sides. Measured against each side's own normal, the two move almost in lockstep: across the 37 winters since 1989-90, their April 1 readings correlate at 0.96. In the four strong El Niño winters the Park City station has recorded, it finished at 75%, 124%, 94% and 101% of normal — no more predictable than the Cottonwoods, and no worse off.
Southern Colorado leans a little wetter, as the southern storm track would suggest, with big years in 1972-73 and 1982-83. But the two most recent strong-ish events, 2015-16 and 2023-24, both came in slightly below normal at Wolf Creek and the San Juans.
North Lake Tahoe 129%, South Lake Tahoe 138%, Mammoth 137%.
The north shore figure combines stations at Palisades Tahoe, Independence Lake near Truckee and Mt Rose; the south shore, Heavenly and Echo Summit near Sierra-at-Tahoe. The two shores move together — the south has simply run a little deeper in most strong El Niño winters.
Those medians flatter a region whose outcomes are all over the map. 1982-83 was historic — the Palisades Tahoe snow course recorded the highest April 1 value in its 71-year record, and Mammoth Pass reached 218% of normal. 1972-73 and 1997-98 were also big, at roughly 140–170% of normal. But 1991-92, a strong El Niño, was a drought year, with the north shore at 62% of normal and the south at 55%. 2009-10 and 2015-16 were mixed — Tahoe near to above normal, Mammoth at 88% in 2015-16 — and 2023-24 was near normal to modestly above.
The US Geological Survey makes the same point with a longer record: the Central Sierra Snow Lab near Donner Pass received above-average snowfall in half of the El Niño winters since 1950, and in two of the four strongest.
Arizona Snowbowl 167%, Taos 156%, White Mountains of Arizona 148%.
The White Mountains station usually melts out by April 1, so its figure compares each winter's peak snowpack with the normal peak instead.
This is where strong El Niño winters have paid off most often. Arizona Snowbowl's snow course recorded 247% of normal in 1972-73 and 195% in 1982-83; Taos was well above normal in most strong winters.
Then there is 2015-16, the strongest El Niño on the traditional index and the season that shows why no single number should drive your plans.
At Red River Pass, near Taos and Red River, the snowpack was 122% of normal on February 1, 2016. A warm, dry February and March followed, and by April 1 it was down to 8%. Arizona Snowbowl finished that season at 58% and Taos at 44%. A great December does not lock in a great season in the Southwest — spring warmth can take it back.
The El Niño pattern extends north and east of the US West:
The most damaging El Niño effect for skiers in the north is not fewer storms — it is storms that arrive too warm, so they fall as rain at lower elevations and snow only up high.
The data shows that pattern clearly even though it cannot measure snow levels directly. In the Cascades, the lower stations run much worse than the higher ones in strong El Niño winters. In 1991-92, the Alpine Meadow snow course at 3,480 feet finished at 14% of normal and Red Hill at 4,410 feet at 19%, while Mt Hood's station at 5,380 feet held 65%. British Columbia's 2016 numbers tell the same story: near normal overall, and less than half of normal below 1,000 meters.
If you are planning a northern trip in an El Niño winter, elevation matters more than latitude.
Two things could make 2026-27 behave differently from the classic pattern.
First, NOAA's own outlook flags that the three biggest El Niños since 1950 all coincided with a positive Pacific Decadal Oscillation, a slow North Pacific ocean pattern that reinforces El Niño. This year it is strongly negative, which NOAA says "may dampen the typical impacts of a strong El Niño in certain areas."
Second, NOAA's December–February outlook already reflects the El Niño pattern: the best odds of above-normal precipitation run from California across the southern states, and the best odds of a warm winter sit over the interior Northwest and the northern tier.
We will update this guide through the season as NOAA's outlooks and the actual snowpack come in. The next NOAA seasonal outlook is due October 15.
Know what the season actually did, not what it was supposed to do
DisasterAWARE Historical Event Intelligence holds 546,000+ hazard records, including winter storms, floods and avalanches, with footprints and exposure for every one.
Explore the historical record
Decades of reconstructed, verified catastrophes — browse the Historical Event Intelligence overview, or request sample data for your own portfolio.
Is El Niño good for skiing? It depends on where. In strong El Niño winters since 1972, median April 1 snowpack in Arizona and New Mexico has run roughly 150–170% of normal, while the Washington Cascades have typically run 76–84%. Utah and Colorado have shown little difference from other years.
Does El Niño mean a big snow year at Tahoe and Mammoth? Sometimes. Strong El Niño winters at Tahoe have ranged from 55–62% of normal (1991-92) to more than 200% on both shores (1982-83). The median is above normal, but the Central Sierra Snow Lab near Donner Pass saw below-average snowfall in half of the El Niño winters since 1950.
Will the Pacific Northwest have a bad ski season in 2026-27? The odds lean that way. In every strong El Niño winter with data, the Mt Baker and Stevens Pass stations finished below normal on April 1, and NOAA's outlook favors a warmer-than-normal winter for the region. A single storm cycle can still change a season, and higher-elevation areas fare better than lower ones.
How does El Niño affect Utah and Colorado snow? Barely, on average. Strong El Niño winters have produced both excellent and poor seasons in the Cottonwood Canyons, Park City and Summit County, and their medians sit close to normal. Park City and the Cottonwoods move almost in lockstep, even though the Cottonwoods get far more snow.









-min.png)

.png)


.png)




Decision-ready intelligence for understanding what's happening, what is impacted, and what to do next. Global hazard, severe weather, catastrophe, and physical risk intelligence trusted by governments, enterprises, insurers, humanitarian organizations, and technology platforms worldwide.
Request DemoContact Us

