


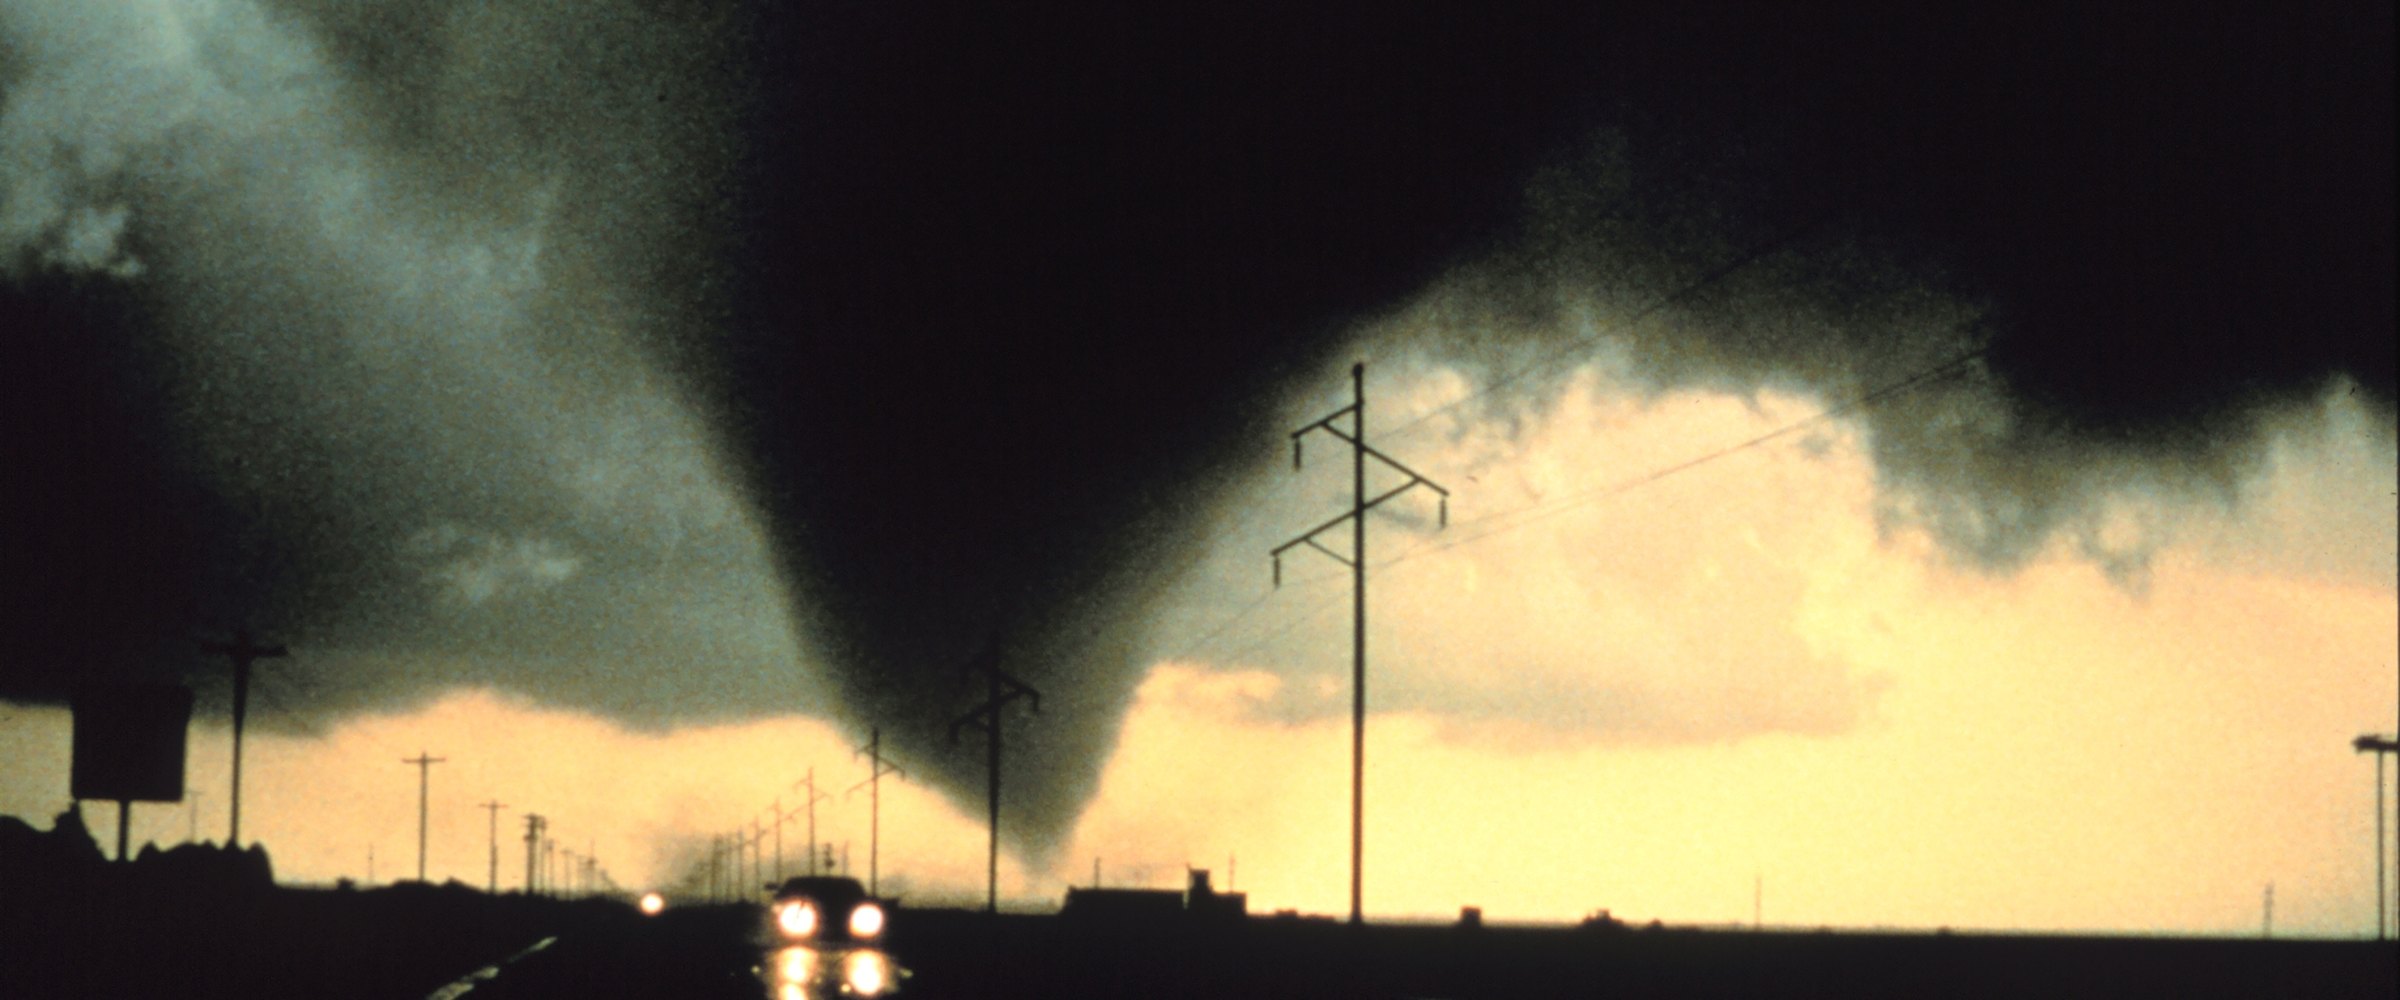
The rating debate, with the evidence on each side — mapped and sourced.
Which tornadoes should have been rated EF5? The most-cited cases are El Reno, Oklahoma (May 31, 2013), rated EF3 even though a mobile radar measured winds of at least 295 mph, and Greenfield, Iowa (May 21, 2024), rated EF4 while a Doppler on Wheels radar team calculated gusts of 309–318 mph. Behind them are 15 EF4 tornadoes, including Rolling Fork, Mississippi (2023) and Rochelle–Fairdale, Illinois (2015), that NOAA National Severe Storms Laboratory researchers identify as "EF5 candidates": they would have reached the top of the scale if a well-built home swept off its foundation still counted as top-tier damage, as it did on the original Fujita scale. The newest case is from this year. The official Storm Data entry for the April 23, 2026 Enid, Oklahoma tornado, rated EF4, says EF5-class winds were "very highly likely". None of these tornadoes is officially an EF5, because the Enhanced Fujita scale rates the damage a tornado leaves, not the wind it produces.
The EF scale, used by the National Weather Service since February 2007, is a damage scale. Survey teams match what they find against 28 damage indicators, such as homes, schools, towers and trees, and each indicator's degree of damage implies a wind range. An EF5 means damage indicating winds above 200 mph; EF4 covers 166–200 mph.
Three features of that design produce the debate:
Mobile radar does not settle it either. NWS guidance explicitly prohibits using mobile-radar data to assign a final rating, as the same paper notes. Radars also measure the speed of debris and raindrops in a volume of air tens of meters above the ground. That is not the 3-second gust near the surface that EF wind values describe, as the radar teams themselves stress.
El Reno, Oklahoma — May 31, 2013 (EF3). The widest tornado on record, 2.6 miles across, killed 8 people, all in vehicles. Two research radars sampled it. NWS Norman reports that both measured winds above 200 mph and that the University of Oklahoma's RaXPol radar "shows winds of at least 295 mph very close to the surface", inside small sub-vortices. A peer-reviewed analysis of the RaXPol data (Snyder and Bluestein, Weather and Forecasting, 2014) found radar-relative velocities above 135 m/s (about 300 mph) "in rural areas essentially devoid of structures from which damage ratings can be made." NWS Norman upgraded it to EF5 on June 4, 2013 on the strength of the mobile-radar velocity data. The National Weather Service returned it to EF3 at the end of August 2013. News reports at the time (Dallas Observer, September 3, 2013; National Geographic, October 25, 2013) describe the EF5 as rejected by NWS headquarters, with NOAA saying that NWS ratings rest on surveys of ground damage. The official record lists it as EF3.
Greenfield, Iowa — May 21, 2024 (EF4). NWS Des Moines rated it EF4 with peak winds of 175–185 mph; it killed 5 and injured 35. A Doppler on Wheels (DOW) radar scanning over the town at 100–160 feet measured Doppler velocities of 263–271 mph. The DOW team's FARM facility statement of June 23, 2024 calculated peak ground-relative gusts of 309–318 mph in a narrow swath. The team called the values preliminary and said the peak gusts likely lasted less than a second at any one spot.
For contrast, radar has helped confirm a top rating before. The May 24, 2011 El Reno–Piedmont tornado is an official EF5. Its rating rested on damage to an oil rig together with RaXPol data, with no standard EF5 damage indicator, according to Lyza and colleagues. The F5 Bridge Creek–Moore tornado of May 3, 1999 is one of only three tornadoes, with El Reno 2013 and Greenfield, in which the DOW team has derived peak winds above 300 mph: first reported at 302 mph, revised to 321 mph in 2021.
In 2025, Lyza, Brooks and Krocak (NOAA National Severe Storms Laboratory and University of Oklahoma), writing in the Bulletin of the American Meteorological Society, listed every EF4 since 2007 with a final NWS wind estimate of 190–200 mph. Nearly all were rated from homes swept from their foundations. One value has since changed: in June 2026 NWS Norman corrected its survey estimate for the Shawnee, Oklahoma (2013) tornado from 190 to 175 mph, noting that the 190 mph "was in error". We list Shawnee as the paper did. By the authors' analysis, these tornadoes would rate EF5 under the old F-scale treatment of that damage, or, at their published winds, if the EF5 threshold dropped 11 mph to 190.
| # | Date | Tornado | Official rating | NWS peak wind estimate | Deaths |
|---|---|---|---|---|---|
| 1= | May 24, 2011 | Chickasha–Blanchard–Newcastle, OK | EF4 | 200 mph | 1 |
| 1= | May 24, 2011 | Washington–Goldsby, OK | EF4 | 200 mph | 0 |
| 1= | Apr 9, 2015 | Rochelle–Fairdale, IL | EF4 | 200 mph | 2 |
| 4 | Mar 24, 2023 | Rolling Fork–Silver City, MS | EF4 | 195 mph | 17 |
| 5 | Jun 16, 2014 | Pilger, NE | EF4 | 191 mph | 1 |
| 6= | Apr 27, 2011 | Cullman, AL | EF4 | 190 mph | 6 |
| 6= | Apr 27, 2011 | Section–Flat Rock (Pisgah), AL | EF4 | 190 mph | 14 |
| 6= | Apr 27, 2011 | Tuscaloosa–Birmingham, AL | EF4 | 190 mph | 64 |
| 6= | Apr 27, 2011 | New Harmony, TN | EF4 | 190 mph | 4 |
| 6= | Apr 27, 2011 | Ringgold, GA–Apison, TN | EF4 | 190 mph | 20 |
| 6= | Nov 17, 2013 | Washington, IL | EF4 | 190 mph | 3 |
| 6= | Apr 27, 2014 | Mayflower–Vilonia, AR | EF4 | 190 mph | 16 |
| 6= | Apr 12, 2020 | Bassfield–Soso, MS | EF4 | 190 mph | 7 |
| 6= | Dec 10, 2021 | Mayfield (Quad-State), TN–KY | EF4 | 190 mph | 57 |
| 15 | May 19, 2013 | Shawnee, OK | EF4 | 175 mph* | 2 |
Candidates and wind estimates: Lyza, Brooks and Krocak (2025), Table 2, checked against NOAA NCEI Storm Events and the NWS Damage Assessment Toolkit. *Shawnee: the paper lists 190 mph; NWS Norman corrected its survey estimate to 175 mph in June 2026. We list Shawnee as the paper did, ranked here by the corrected value. Deaths: NOAA Storm Prediction Center tornado database. Tornado names follow NWS Storm Data; the paper lists the tornadoes by a single town.
Three of them show how close the line can be:
The paper's list ends in 2023. Since then, two more EF4s have carried 190-mph NWS estimates: Diaz, Arkansas (March 14, 2025), which NWS Little Rock called "consistent with an EF4 rating", and Marion, Illinois (May 16, 2025), where a home swept off its foundation supported EF4 with 190-mph peak winds, according to Storm Data. On June 20, 2025, Enderlin, North Dakota ended the EF5 gap, after first being rated EF3 at 160 mph.
The most direct statement is the newest. NWS Norman rated the Enid, Oklahoma tornado of April 23, 2026 EF4, with peak winds of 175–180 mph. The NOAA Storm Data entry for that tornado adds research calculations by National Severe Storms Laboratory and University of Illinois researchers. Two treefall-pattern analyses gave median peak winds above 205 mph and of 210 mph, and modeling of an RV thrown about 300 yards gave 204–217 mph. The entry concludes that "it is very highly likely that this tornado produced winds that would be classified as an EF5 tornado in the vicinity of Southgate Road." Its official rating remains EF4, so it is still 2026's strongest rated tornado (Tornadoes of 2026).
The debate runs both ways. Jarrell, Texas (May 27, 1997) is not on this list: it is already an F5, rated on the old scale, and killed 27 people. But engineers have argued that its extreme damage could reflect F3-range winds, given how long the winds lasted at each spot and how the homes were attached to their foundations (Phan and Simiu, 1998, as summarized by Lyza and colleagues). The same review recounts how the 2002 La Plata, Maryland tornado was upgraded to F5 and then returned to F4 after an engineer found structural flaws in the "F5" homes. It also notes that an ASCE analysis found none of Joplin's 22 swept homes required EF5 winds, although the rating was kept on other evidence. The EF scale was built to stop that kind of over-rating. The question now is whether it over-corrected.
Between Moore, Oklahoma (May 20, 2013) and Enderlin (June 20, 2025), no US tornado was rated EF5, the longest gap since official records began in 1950. Lyza and colleagues calculated that, at the historical rate, the chance of ten straight years without an F5/EF5 (2014–2023) was 0.3%. Their conclusion: the gap is "less due to a weakening of tornadoes" and "likely attributable to stricter application of the enhanced Fujita scale." Counting their 15 candidates as EF5s, about 44% of years from 1880 to 2023 (64 of 144) would have at least one 5-rated tornado, essentially the 44.0% of years that had one over 1880–2013, before the gap. The paper states the same comparison the other way round, as the share of years with no 5-rated tornado: 55.6% versus 56.0%.
Enderlin shows what it now takes. NWS Grand Forks upgraded it to EF5 on October 6, 2025 from forensic estimates of tipped, fully loaded grain hopper cars and an empty tanker car thrown about 475 feet, with winds "greater than 210 mph." At a nearby farmstead swept clean, the statement notes, "issues surrounding the lack of proper anchoring will limit the overall rating in this area." A train was needed to prove what the houses could not.
A fix is in progress. Since 2014, the American Society of Civil Engineers and the American Meteorological Society (ASCE/SEI/AMS) have been developing a consensus standard, Wind Speed Estimation in Tornadoes. It would formally standardize the EF scale and add chapters on radar measurements, treefall patterns, forensic engineering and in-situ data. A 2022 paper by committee members (Marshall et al.) described it as forthcoming. We could not confirm a publication or NWS adoption date as of October 9, 2026.
Explore the map: switch on more layers with the layers icon at the bottom right of the map: NWS damage-survey points (21 tornadoes, 2011 onward), the survey evidence behind each rating; the NWS tornado warnings in effect at the time (an alert, not an observation; 22 tornadoes, 2002 onward); hail and wind reports within 50 km; NEXRAD reflectivity and velocity for all 24, near each tornado's peak, or at touchdown for New Harmony, Jarrell and Bridge Creek (velocity for 1997 and 1999 is not storm-relative); and radar-estimated hail swaths and rotation tracks for the 8 tornadoes since 2020.
The map shows 24 tornadoes: the 15 candidates (Shawnee at its NWS-corrected 175 mph), three since 2024 (Diaz, Marion, Enid), the two radar cases, and four rated F5/EF5 for reference (Jarrell, Bridge Creek–Moore, Moore 2013, Enderlin). Paths for 13 tornadoes are NWS Damage Assessment Toolkit surveyed paths. The other 11, all from 2014 or earlier, are SPC straight start-to-end tracks; that includes Cullman and Moore 2013, whose toolkit paths carry a lower peak wind (175 mph) or no rating. Click a dot for the rating, wind evidence and sources. The NWS survey EF contours (16 tornadoes) and each path's surveyed maximum width are on at load.
Read the evidence, not just the rating
DisasterAWARE Historical Event Intelligence links NWS warnings, damage-survey points and storm reports into event-level records — queryable by place, date, and severity.
Our distinct-tornado record (2015 to September 2026) holds one EF5, Enderlin. Six EF4s carry NWS peak-wind estimates of 190 mph or more, ranked here by that estimate. For the tornadoes our warning archive covers, the table also shows the NWS tornado warning that was in effect where and when the tornado touched down, as surveyed in the NWS Damage Assessment Toolkit.
| Rank | Tornado | NWS peak wind (survey estimate) | Warning in effect at touchdown (alert) | Lead time |
|---|---|---|---|---|
| 1 | Rochelle–Fairdale, IL — Apr 9, 2015 | 200 mph | — (not in our warning archive, which is sparse before 2016) | — |
| 2 | Rolling Fork–Silver City, MS — Mar 24, 2023 | 195 mph | NWS Jackson #27 | 12 min |
| 3= | Bassfield–Soso, MS — Apr 12, 2020 | 190 mph | NWS Jackson #33 | 32 min |
| 3= | Mayfield (Quad-State) — Dec 10, 2021 | 190 mph | NWS Memphis #66 | 21 min |
| 3= | Diaz, AR — Mar 14, 2025 | 190 mph | NWS Little Rock #24 | 21 min |
| 3= | Marion, IL — May 16, 2025 | 190 mph | NWS Paducah #129 | 7 min |
Peak winds: NWS survey estimates (NWS Damage Assessment Toolkit; Storm Data). Warnings and lead times: NWS storm-based tornado warnings (archived by the Iowa Environmental Mesonet) whose polygon contained the start point of the NWS Damage Assessment Toolkit surveyed path; lead time = that path's start (touchdown) time minus warning issue time. Storm Data start times can differ by a few minutes: for Mayfield they give 26 minutes instead of 21. Each listed warning is held in the DisasterAWARE Historical Hazards archive, queried October 9, 2026. Warnings are alerts, not tornadoes. For comparison, by the same Damage Assessment Toolkit touchdown times, Greenfield (2024) touched down 19 minutes after NWS Omaha warning #77 was issued, Enderlin (2025) 20 minutes after NWS Grand Forks #16, and Enid (2026) 12 minutes after NWS Norman #36.
The rating is a floor on damage, not a measurement of wind. An EF number records the worst damage to a rated indicator that happened to be in the path. A peer-reviewed study of Doppler on Wheels measurements in 120 tornadoes (Wurman et al., PNAS, 2021) found that, for tornadoes documented by both, NWS EF and wind ratings run 1.2 to 1.5 categories below the radar observations. It also found that about 20% of supercell tornadoes are capable of EF4–EF5 damage. For a portfolio, the question is not whether a tornado was "officially" an EF5. It is what wind actually reached each insured location, and what it did to the buildings there.
The losses don't wait for the rating. The outbreaks behind several candidates rank among NOAA's billion-dollar disasters (CPI-adjusted, NOAA NCEI Billion-Dollar Disasters 1980–2024):
These are outbreak totals across all perils. None of them would change if a single tornado were re-rated.
Ratings drift, and models inherit the drift. The EF5 gap was, on the NSSL authors' evidence, largely a change in how damage is rated, not in tornadoes. Any frequency–severity view calibrated to EF-rating counts carries that artifact. Ratings also move after the fact: Rolling Fork went from 170 to 195 mph, and Enderlin from EF3 to EF5 almost four months later. Enid's official entry now argues above its own rating.
What event-level data exists. Below the headline number sit the NWS Damage Assessment Toolkit's per-point surveys (damage indicator, degree of damage and wind estimate for each structure), warning polygons, Storm Data narratives and, for some events, research radar. DisasterAWARE assembles these per event. For Rolling Fork, our archive record links NWS Jackson tornado warnings #27 and #28 to the tornado's four Storm Data county entries (17 deaths, $96.4 million in estimated property damage) and 598 NWS damage-survey points from the warned storm, 39 of them rated EF4. That makes it possible to ask what a tornado did at a specific address, not just what it was called. See how this works in Historical Event Intelligence, browse the tornado data hub, or download a sample tornado dataset.
Explore the historical record
Decades of reconstructed, verified catastrophes — browse the Historical Event Intelligence overview, or request sample data for your own portfolio.
What tornadoes should have been rated EF5? The most-cited cases are El Reno, Oklahoma (2013), rated EF3 despite RaXPol radar winds of at least 295 mph, and Greenfield, Iowa (2024), rated EF4 despite DOW-derived gusts of 309–318 mph. NOAA researchers also list 15 EF4s whose NWS wind estimates were 190–200 mph when they compiled the list (one, Shawnee 2013, has since been corrected to 175 mph) as "EF5 candidates", including Rolling Fork (2023), Rochelle–Fairdale (2015), Mayfield (2021) and two Oklahoma tornadoes on May 24, 2011. All remain officially below EF5.
Why was the El Reno tornado downgraded to EF3? Because EF ratings come from damage surveys, and El Reno's strongest winds crossed open country. NWS Norman found no damage that supported a rating above EF3 on the scale's damage indicators, despite the measured radar winds. NWS guidance does not allow mobile-radar data to set the final rating.
Why were there no EF5 tornadoes between 2013 and 2025? NOAA National Severe Storms Laboratory researchers (Lyza, Brooks and Krocak, 2025) concluded the gap was likely due to stricter application of the EF scale, not weaker tornadoes. Under the EF scale, a well-built home swept off its foundation implies 200 mph, the top of EF4, so homes alone rarely prove EF5. The gap ended with Enderlin, North Dakota (June 20, 2025), upgraded to EF5 on October 6, 2025.
What is the strongest tornado wind ever measured? Only radar has captured winds this strong, and the DOW team counts three tornadoes above 300 mph: Bridge Creek–Moore, Oklahoma (May 3, 1999; first reported at 302 mph, revised to 321 mph), El Reno, Oklahoma (May 31, 2013; 291–336 mph reported by Wurman et al. 2014 and 313 mph by Bluestein et al. 2015, in very small, fast-moving sub-vortices) and Greenfield, Iowa (May 21, 2024; 309–318 mph). These are radar-derived values, not anemometer readings, and each carries uncertainty.
Will radar ever be used to rate tornadoes? Possibly. The ASCE/SEI/AMS Wind Speed Estimation in Tornadoes standard in development includes a radar-measurement chapter alongside the EF scale. As of October 9, 2026 we could not confirm its publication or adoption by the National Weather Service.
Sources: Lyza, Brooks and Krocak, "Where Have the EF5s Gone?", Bulletin of the American Meteorological Society 106(8), 2025; Wurman, Kosiba, White and Robinson, PNAS 118(14), 2021; Snyder and Bluestein, Weather and Forecasting 29(4), 2014; Marshall et al., "On the Current Revision of the Enhanced Fujita (EF) Scale", 30th AMS Conference on Severe Local Storms, 2022; FARM/Doppler on Wheels Greenfield statement (June 23, 2024); NWS Public Information Statements from Norman, Des Moines, Jackson, Chicago, Little Rock and Grand Forks; NWS Norman El Reno event page; NWS Damage Assessment Toolkit; NOAA NCEI Storm Events Database; NOAA Storm Prediction Center tornado database (1950–2025); NOAA NCEI Billion-Dollar Disasters (1980–2024); NWS storm-based warnings via Iowa Environmental Mesonet; DisasterAWARE distinct-tornado record (2015–September 2026) and Historical Hazards archive (queried October 9, 2026).




Decision-ready intelligence for understanding what's happening, what is impacted, and what to do next. Global hazard, severe weather, catastrophe, and physical risk intelligence trusted by governments, enterprises, insurers, humanitarian organizations, and technology platforms worldwide.
Request DemoContact Us

