


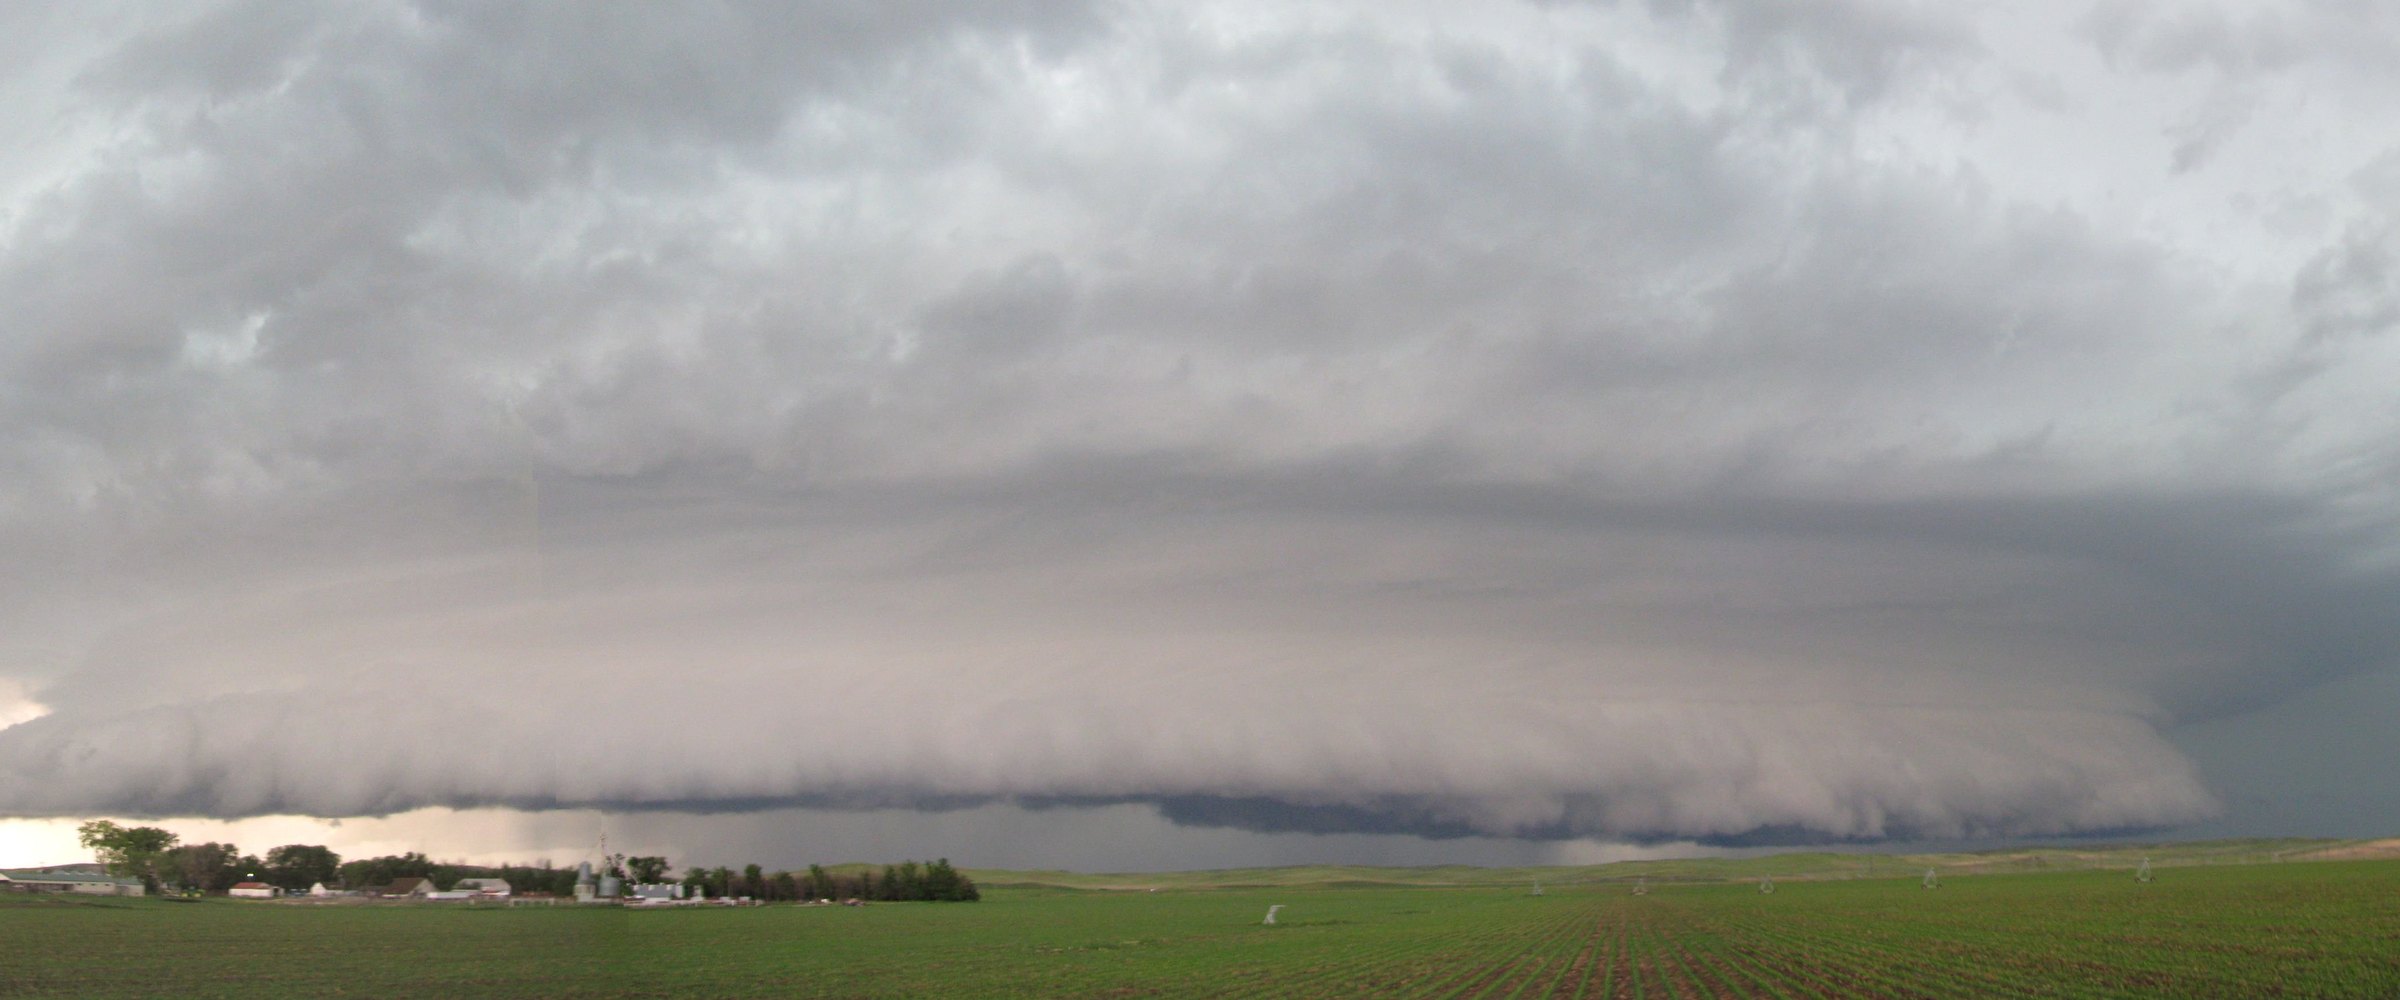
The costliest, deadliest and strongest derechos on record, ranked from the Storm Prediction Center's derecho archive and the US billion-dollar disaster database, with every wind report mapped.
What was the worst derecho in US history? The Iowa derecho of August 10, 2020. It cost $11.0 billion at the time, or $14.2 billion in 2026 dollars, which makes it the costliest derecho in the US billion-dollar disaster database by a factor of three. It flattened crops across central Iowa and tore through Cedar Rapids, where the National Weather Service estimated winds near 140 mph from the damage. The deadliest derecho is the June 29–30, 2012 storm that ran from Indiana to the Atlantic coast near Washington, D.C.: 22 people killed, according to the Storm Prediction Center (SPC). The most recent derecho came on August 11, 2026, from eastern Iowa through Chicago into Ohio; SPC has preliminarily confirmed it, along with one on June 10, 2026.
Below are three rankings (cost, deaths and the strongest measured gust), the longest derecho paths, the 2026 derechos, and a map of every wind report SPC assigns to each storm, measured and estimated.
A derecho is a widespread, long-lived windstorm produced by a fast-moving line or cluster of thunderstorms. SPC's current definition requires a swath of wind damage at least 250 miles (about 400 km) long, with gusts of at least 58 mph along its length and several well-separated gusts of 75 mph or more, from a storm system that moves faster than the mean wind. These requirements come from revisions published in 2016 (Corfidi and colleagues) and 2025 (Squitieri and colleagues).
In 2026, SPC and its partners published the first archive built on the revised definition: 173 cases from 1955 to 2025, each with its quality-checked wind reports. It splits them into 96 definitive and 13 likely derechos in the radar era (1996–2025), and 48 likely and 16 possible derechos from 1955 to 1995. Every ranking below starts from that archive, and the tables say when a storm commonly called a derecho is not in it. Five of the ten costliest are in it; four are not (among them December 2021), and one (2026) postdates it. Nor is the 2024 Houston derecho.
Two kinds of wind numbers appear in derecho records, and they are not interchangeable:
Ranking rule: every event in the US billion-dollar disaster database (now maintained by Climate Central, continuing NOAA's) whose name or summary identifies a derecho, ranked by total cost in 2026 dollars. These are whole-event totals: several include tornadoes and other storms on the same dates, not split out.
| # | Event (database name) | Dates | Cost, 2026 dollars | Cost at the time | Deaths (whole event) | In SPC's archive? |
|---|---|---|---|---|---|---|
| 1 | Central Severe Weather – Derecho (Iowa) | Aug 10, 2020 | $14.22 billion | $11.03 billion | 4 | Yes, definitive |
| 2 | Plains/East/Northeast Derecho | Jun 29–Jul 2, 2012 | $4.22 billion | $2.89 billion | 28 | Yes, definitive (Jun 29–30) |
| 3 | Midwest/Southeast Tornadoes and Derecho | Apr 4–5, 2011 | $4.11 billion | $2.78 billion | 9 | No |
| 4 | Central Derecho | Jun 13, 2022 | $3.61 billion | $3.20 billion | 1 | No |
| 5 | Midwest Derecho and Severe Storms | Aug 9–12, 2026 | $3.02 billion | $3.02 billion | 7 | Preliminary (Aug 11); archive ends in 2025 |
| 6 | Northern Plains and Great Lakes Derecho, Tornadoes | May 30–Jun 2, 1998 | $2.33 billion | $1.14 billion | 20 | Yes, definitive (May 31) |
| 7 | Midwest Derecho and Tornado Outbreak | Dec 15, 2021 | $2.14 billion | $1.78 billion | 1 | No |
| 8 | Midwest, South and East Severe Weather | Jun 9–12, 2009 | $2.06 billion | $1.33 billion | 0 | Yes, two (Jun 10–11 and Jun 12) |
| 9 | Southern Derecho and Eastern Severe Weather | Jul 21–23, 2003 | $1.84 billion | $1.01 billion | 7 | No |
| 10 | Rockies and Midwest Derecho | Jul 10–11, 2011 | $1.83 billion | $1.24 billion | 2 | Yes, two (Jul 10–11 and Jul 11) |
Source: US billion-dollar disaster database, Climate Central (continuing NOAA NCEI's), events page fetched 2026-10-09; total direct costs, insured and uninsured, CPI-adjusted to 2026 dollars. Archive status: SPC Derecho Archive (Squitieri et al. 2026).
Six more derecho events in the database fall below $1.83 billion: the May 2018 Northeast derecho (inside a $1.82 billion event), the 2024 Houston derecho ($1.64 billion), April 19–20, 2011 ($1.54 billion), the May 1989 Texas derecho ($1.49 billion), May 2009 ($1.34 billion) and the April 29, 2025 Ohio Valley–Northeast derecho ($1.29 billion).
Iowa 2020 stands apart. In 2026 dollars it is the second-costliest severe-storm event of any kind in the database, behind only the April 2011 tornado outbreak ($15.13 billion), out of 238 severe-storm events since 1980.
Ranking rule: all US deaths that NOAA attributes to the derecho's winds, direct and indirect, taken from SPC's own case write-up where SPC has one, and otherwise from NWS Storm Data (NCEI Storm Events, direct plus indirect thunderstorm-wind deaths). These counts differ from source to source, so the table shows the other NOAA counts where they disagree.
| # | Derecho | Deaths | Source of the count | Notes |
|---|---|---|---|---|
| 1 | June 29–30, 2012, Indiana to New Jersey and Washington, D.C. | 22 | SPC case write-up | Mostly falling trees; 5 million lost power. Storm Data on the reports in SPC's archive: 15; the billion-dollar event (Jun 29–Jul 2): 28 |
| 2 | July 4, 1969, Ohio and Lake Erie | 18 | SPC case write-up (in Ohio) | Falling trees and capsized boats during holiday fireworks; SPC's archive lists it only as a "possible" derecho |
| 3 | July 19, 2018, Kansas to Arkansas | 17 | NCEI Storm Events: 17 direct | A tour boat sank on Table Rock Lake, Missouri; NWS's service assessment calls the storm a derecho. Not in SPC's 2026 archive |
| 4= | May 16, 2024, Houston | 8 | NCEI Storm Events: 4 direct, 4 indirect | A ninth death, from a lightning fire, is listed separately. Not in SPC's archive table |
| 4= | April 4–5, 2011, Southeast | 8 | NCEI Storm Events: 4 direct, 4 indirect | SPC's write-up says only "several wind-related deaths". Not in SPC's 2026 archive |
| 6= | July 12–13, 1995, "Right Turn" derecho, North Dakota to Ohio | 7 | SPC case write-up | NCEI Storm Events: 6 (Ohio 3, Michigan 3). Longest path in SPC's archive (below) |
| 6= | March 12–13, 1993, Florida | 7 | SPC case write-up | Florida only; SPC adds 10 deaths in Cuba. Includes embedded tornadoes; not in SPC's 2026 archive |
| 8= | July 14–15, 1995, "Ontario–Adirondacks" derecho, Michigan to New England | 6 | SPC case write-up | New York 5, Massachusetts 1 (NCEI the same); SPC adds one in Ontario. SPC's archive: likely |
| 8= | August 10, 2020, Iowa to Indiana | 6 | NCEI Storm Events: 4 direct, 2 indirect | No SPC case write-up. Storm Data on the reports in SPC's archive: 4 |
| 8= | May 17, 1986, southeast Texas | 6 | SPC case write-up | Six boaters drowned, five of them on Lake Livingston; NCEI Storm Events: 9 (Polk and Tyler counties). Not in SPC's 2026 archive |
| 8= | July 4–5, 1980, "More Trees Down" derecho | 6 | SPC case write-up | Four of the six died when boats overturned; Storm Data on the reports in SPC's archive: 3 |
Sources: SPC "About Derechos" case pages; SPC Derecho Archive; NCEI Storm Events Database (1980–2020 files of 2026-03-23; 2024 file of 2026-07-28); NWS Table Rock Lake service assessment.
Death counts before the mid-1990s are incomplete: NOAA's Storm Data often did not record wind deaths, and SPC has written up only selected older derechos, so older storms may be missing from this list.
The pattern is consistent: derecho deaths come from trees falling on people, in homes, cars and tents, and from boats capsized on lakes. May 31, 1998 killed five in the US (SPC; a sixth in Ontario). The two Labor Day derechos of September 7, 1998 killed seven between them (SPC's case write-up; neither is in SPC's 2026 archive). The billion-dollar database gives higher multi-day tolls (21 for May 1–6, 1989; 20 for May 30–June 2, 1998), but they include tornado deaths: the violent Spencer, South Dakota tornado of May 30, 1998 alone killed six.
Ranking rule: for every case in SPC's archive, the highest wind report coded "Measured", ranked by the archive's value in knots. The archive codes a report as measured when Storm Data does; before 2000 reports are assumed estimated unless the record says otherwise. The table gives what each report says about the instrument, because "measured" ranges from an Air Force base to a farmer's wind gauge.
| # | Derecho | Measured gust | Where | What the report says |
|---|---|---|---|---|
| 1 | Apr 22, 1997, Ark-La-Tex | 125 kt (144 mph) | Barksdale AFB, Bossier City, LA | The base's weather observation: peak wind 125 kt from the west-northwest at 13:08 UTC (METAR "PK WND 300125/08"); Storm Data: "clocked at 144 mph". Shreveport's airport, 16 km away, peaked at 41 mph: a very localized macroburst |
| 2= | May 31, 1998, southern Great Lakes | 111 kt (128 mph) | Near Lebanon, Dodge Co., WI | "Peak gust of 128 mph measured"; also cited by SPC |
| 2= | May 17, 1996, Northern Plains (SPC: likely) | 111 kt in the archive (128 mph); the report says 126 mph | South of Heil, ND | A farmer's recording equipment, before it was destroyed |
| 4 | Jul 10, 2011, North Dakota–Minnesota | 110 kt (121–127 mph) | Near Straubville, ND | Six sensors on a temporary wind-energy tower, 130–200 ft above ground (the WMO standard height for wind sensors is 10 m) |
| 5= | Jun 29, 1998, Corn Belt | 109 kt (126 mph stated) | Washington, IA | "Unofficial wind speed measured at 126 mph" |
| 5= | Aug 10, 2020, Iowa | 109 kt (126 mph stated) | Atkins, Benton Co., IA | "maximum measured unofficial wind gust"; a home weather station |
| 7 | Jun 22, 2015, South Dakota–Wisconsin | 106 kt ("over 120 mph") | Hayes, SD | A home wind system |
| 8 | Jul 8–9, 1993, Nebraska (SPC: likely) | 105 kt in the archive (121 mph); the report says 125 mph | York, NE | "Thunderstorm winds measured at 125 mph" |
| 9 | Jul 31, 2008, Dakotas–Minnesota | 100 kt (115 mph) | Hiland, SD | "measured with a wind meter" |
| 10 | Jun 7–8, 2005, Dakotas | 98 kt ("over 110 mph") | Onida, SD | Two planes flipped at the airport |
Source: SPC Derecho Archive per-case report files (Squitieri et al. 2026), all 173 cases. Knots as stored in the archive; mph in brackets is the converted value unless the report states its own figure ("stated"). Where the report's own figure and the archive's knots disagree (Heil 1996, York 1993), both are shown; ranked by the archive's value. Storm Data also codes a 98-kt report at Shallow Water, Kansas (July 22, 2000) as measured, but the report names no instrument ("Irrigation sprinkler destroyed"), so it is left out.
Two lessons from this table. First, most of the very highest readings come from unofficial instruments. The top of the list is a single Air Force base observation in a macroburst; then come a farmer's gauge, a tall wind-energy tower and home weather stations. Below Barksdale, airport sensors in the same archive top out lower: 106 mph at the Bemidji, Minnesota airport (June 21, 2025), 100 mph at Salina, Kansas (May 19, 2024) and 96 mph at Omaha's Eppley Airfield (July 10, 2021). Second, the strongest winds are usually not measured at all. The Iowa derecho's most famous number, about 140 mph in Cedar Rapids, is an NWS damage-survey estimate, and so is the "100 to 110 mph" in northwest Indiana in 2026.
By the archive's track length, the distance between the first and last wind report:
The Iowa derecho of 2020 covered 1,111 km in 13 hours by the same measure, and the June 2012 derecho 1,124 km in 12 hours.
SPC confirms each year's derechos once that year's Storm Data is final, so 2026's official list will come in 2027. Two 2026 storms have already been preliminarily confirmed by SPC, according to the NWS offices that covered them, and NWS Norman has described a third as a derecho:
The map plots the wind reports SPC assigns to each ranked derecho: blue dots are measured gusts, orange dots are observers' estimates of 75 mph or more (beneath measured). Red outlines are drawn 20 km around every report: derived, not surveyed damage swaths. Purple dots are the June 10 and August 11, 2026 reports (preliminary); dark-red markers are every ranked derecho plus other SPC-archive and 2026 derechos. A radar snapshot shows the 2020 storm over Cedar Rapids.
Explore the map: switch on more layers with the layers icon at the bottom right of the map: NEXRAD radar frames from 1995; SPC watches (from 1997) and discussions (from 2003) and NWS severe thunderstorm warnings (from 2003), all ALERT; NWS damage-survey points (survey estimates, not gusts) where logged, from 2011, at zoom 7 and closer; and the other wind reports in SPC's archive, from 1969.
In the DisasterAWARE historical hazard archive, severe thunderstorm alert records are enriched with the storm reports and NWS damage-survey points inside them. That makes it possible to separate what was measured from what was estimated, which is exactly where derecho data goes wrong.
A fresh pull (October 9, 2026) found 147 US severe thunderstorm alert records (144 warnings, 3 watches) with a wind value of 100 mph or more. Checked one by one against their own reports, only 44 of those values are measured gusts. 96 are NWS damage-survey wind estimates, and the other 7 are estimated gusts in storm reports that also come from NWS damage surveys. The highest value, 131 mph near Highmore, South Dakota (June 29, 2026), is a measured gust from a state mesonet station, held on a severe thunderstorm watch record; the next highest, 130 mph in Lea County, New Mexico (May 31, 2023) and Jones County, South Dakota (June 12, 2022), are both survey estimates. After merging duplicates, the 44 measured values are 37 distinct readings. Eleven of them came during derechos in SPC's archive, among them:
For the August 11, 2026 derecho, the archive's Chicago alert, which summarizes three NWS severe thunderstorm warnings, carries 138 storm reports (32 of them measured, peaking at the 99 mph Gary airport gust) and 342 NWS damage-survey points, the highest estimated at 110 mph. Every number here is labelled by tier: the warnings are alerts, the gust reports are observations, and the survey winds are estimates.
Every gust, warning and damage survey in one record
DisasterAWARE Historical Event Intelligence links severe thunderstorm alert records, measured and estimated gusts and NWS damage surveys into event-level records.
Derechos are a severe convective storm (SCS) peril, part of what the industry calls "secondary perils". The label is misleading: at $14.2 billion in 2026 dollars, the August 2020 derecho cost more than 46 of the 68 tropical cyclones in the billion-dollar database. Three features make them hard to price.
The losses are wide, shallow and mixed. In Iowa alone, insurers reported 200,597 claims and $1.61 billion paid by November 2, 2020, with more than $1 billion still held in reserve (Iowa Insurance Division). Farm losses then go on through a second channel: federal crop insurance paid $325.8 million in Iowa for "Wind/Excess Wind" losses in August 2020, $316.3 million of it on corn, across 1.38 million acres and 9,021 policies (USDA Risk Management Agency, cause-of-loss data).
The hazard data is mostly estimates. A derecho's record is hundreds of reports along a path of 1,000 km or more, mostly estimates, with a minority of instrument readings and damage surveys of the worst spots. The Iowa derecho has 569 reports in SPC's archive: 85 measured, 484 estimated. A model or a parametric trigger built on "the gust" will often be built on a spotter's estimate or a survey judgment without knowing it. Separating measured from estimated, and both from survey winds, changes the event: in our own archive it removes more than two-thirds of the "100 mph gusts".
Event boundaries are inconsistent. The billion-dollar database bundles derechos with tornado outbreaks and multi-day storms (2011, 2026); SPC's new archive leaves out storms that most people call derechos (Houston 2024, December 2021); and death and loss counts differ between sources by a factor of two (22, 15 or 28 deaths for June 2012). A portfolio's event set for this peril depends on which definition was used to build it.
DisasterAWARE's severe convective storm data links severe thunderstorm alert records to the storm reports and NWS damage-survey points inside them, with every value flagged as measured, estimated or surveyed. That is the event-level detail behind calibrating a wind vulnerability curve, back-testing a parametric SCS trigger, or reconstructing a derecho footprint over a portfolio. Historical Event Intelligence licenses the archive, and the sample datasets show the record format.
Explore the historical record
Decades of reconstructed, verified catastrophes — browse the Historical Event Intelligence overview, or request sample data for your own portfolio.
What was the worst derecho in US history? By cost, the Iowa derecho of August 10, 2020: $11.0 billion at the time, $14.2 billion in 2026 dollars, according to the US billion-dollar disaster database. By deaths, the June 29–30, 2012 derecho, which killed 22 people from the Midwest to the Mid-Atlantic, according to SPC.
When was the last derecho in the US? August 11, 2026, from eastern Iowa through Chicago and northwest Indiana toward Ohio and Kentucky. SPC preliminarily confirmed it (SPC statement quoted by NWS Northern Indiana), with a 99 mph gust measured at Gary/Chicago International Airport. SPC also preliminarily confirmed a derecho on June 10, 2026, and NWS Norman called the June 22, 2026 Oklahoma storms a derecho. Official 2026 derechos are confirmed once Storm Data is final, in 2027.
What is the strongest derecho wind ever recorded? The highest report coded as measured in SPC's derecho archive is 144 mph at Barksdale Air Force Base, Louisiana, on April 22, 1997: the peak wind in the base's own weather observation (125 kt) during a macroburst. SPC also cites 128 mph measured in eastern Wisconsin on May 31, 1998. Damage surveys have estimated winds of about 140 mph (Cedar Rapids, 2020), but those are estimates from the damage, not gust readings.
What was the worst derecho in Iowa history? August 10, 2020. In SPC's archive its Iowa wind reports run from 8:16 a.m. to 1:30 p.m. CDT. It flattened corn across central Iowa and hit Cedar Rapids hardest. Iowa insurers had paid $1.61 billion on 200,597 claims by November 2020, and federal crop insurance paid $325.8 million in Iowa for wind losses that August.
Sources: NOAA/NWS Storm Prediction Center, "About Derechos" (definition and case write-ups) and SPC Derecho Archive (Squitieri et al. 2026, files of 2026-05-28); Corfidi et al. (2016) and Squitieri et al. (2025), Bulletin of the American Meteorological Society; US billion-dollar disaster database, Climate Central (continuing NOAA NCEI's), fetched 2026-10-09; NCEI Storm Events Database; NWS Quad Cities August 10, 2020 derecho summary; NWS Chicago, Northern Indiana, Quad Cities and Milwaukee event summaries (2026); Iowa Insurance Division (claims as of November 2, 2020); USDA Risk Management Agency, Cause of Loss data, crop year 2020; Iowa Environmental Mesonet (storm reports, warnings and NEXRAD composites); NWS Norman Public Information Statement (June 22, 2026); WMO, Guide to Instruments and Methods of Observation (WMO-No. 8), Vol. I, Ch. 5, §5.9.1 (standard 10 m wind-sensor height); DisasterAWARE Historical Hazards API (queried 2026-10-09).




Decision-ready intelligence for understanding what's happening, what is impacted, and what to do next. Global hazard, severe weather, catastrophe, and physical risk intelligence trusted by governments, enterprises, insurers, humanitarian organizations, and technology platforms worldwide.
Request DemoContact Us

