


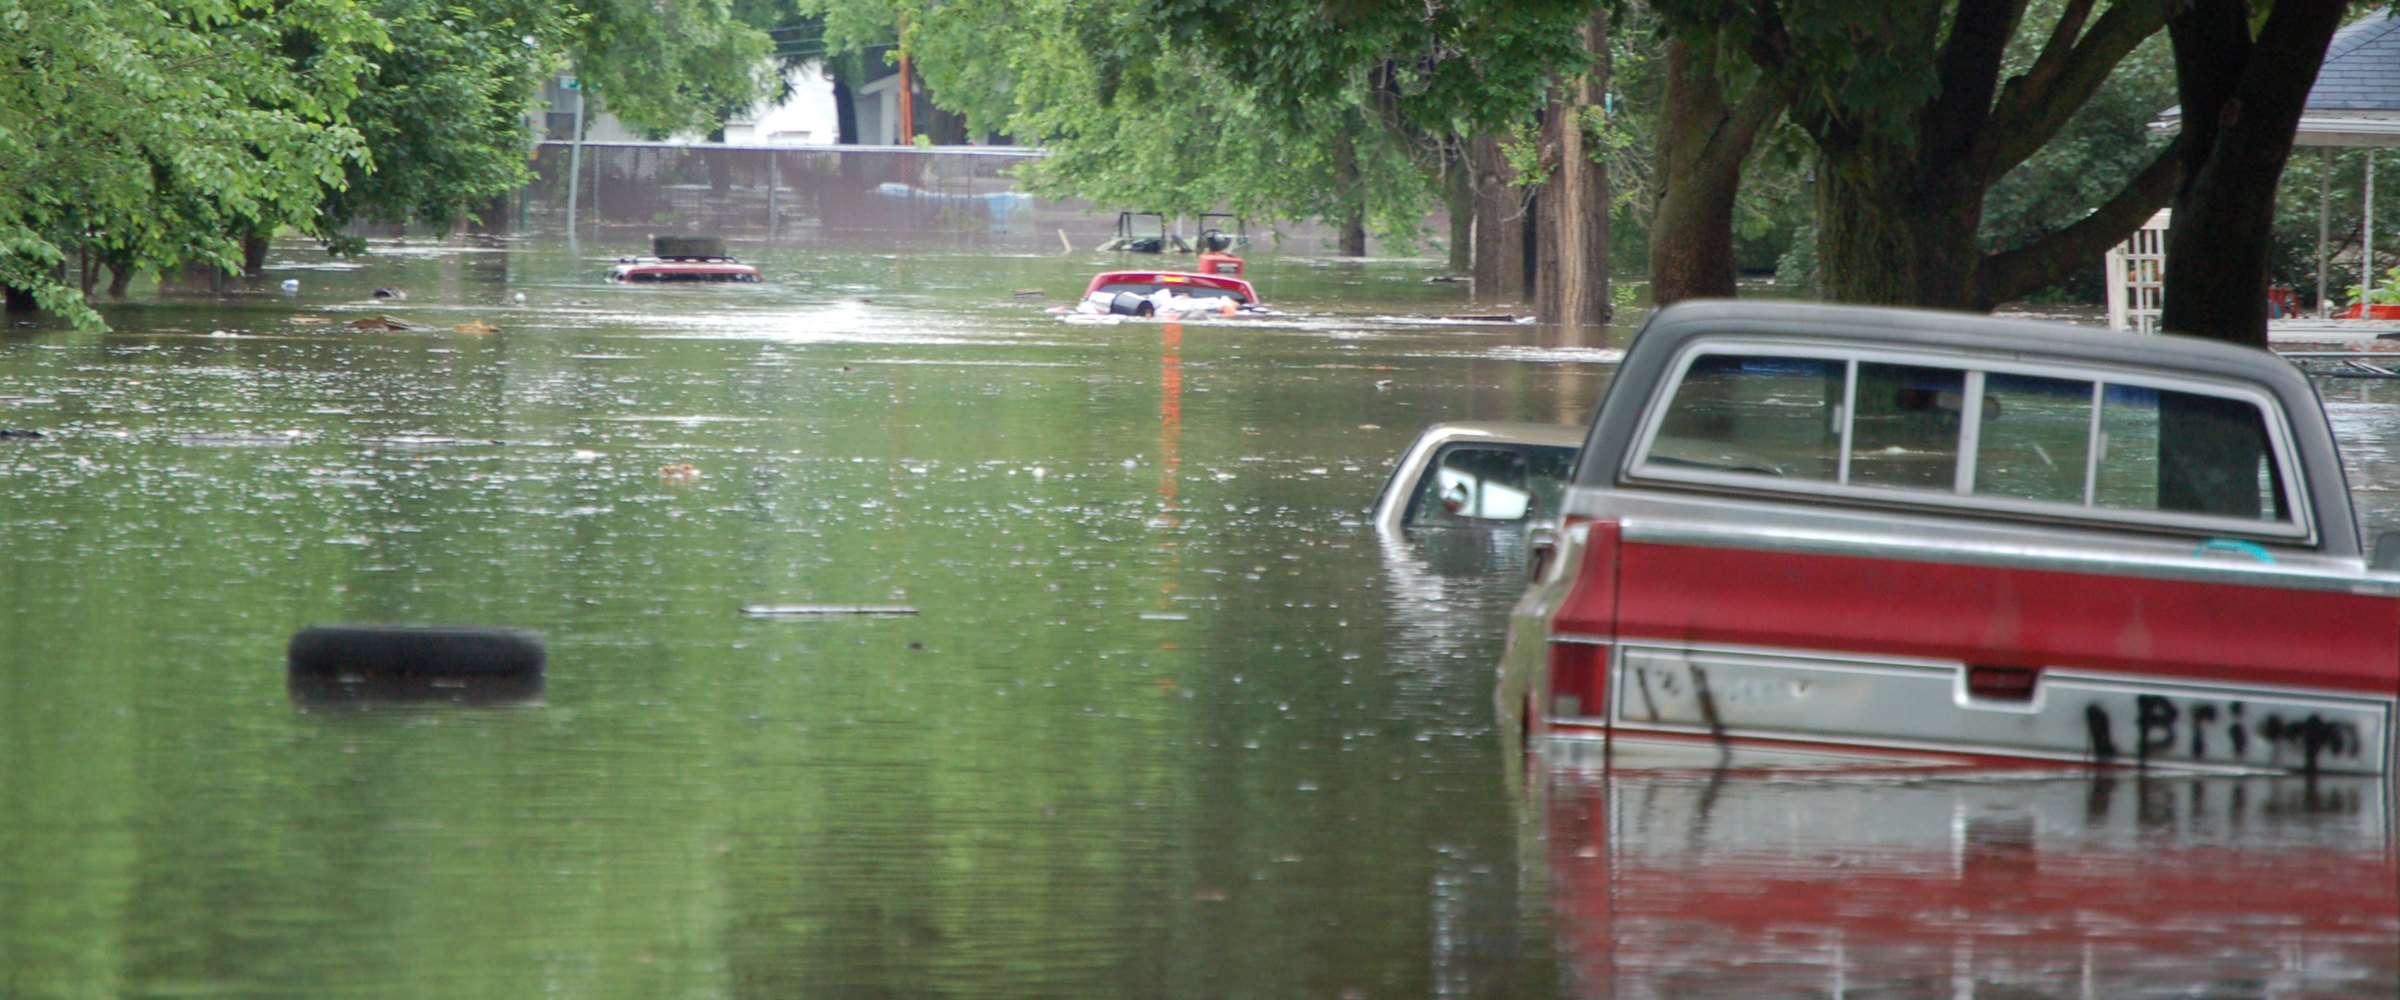
Four rankings, four rules: the deadliest floods, the biggest flood-insurance payouts, the costliest river and flash floods, and the floods that broke the most river records since 2006, with a map of every record-setting gauge.
What were the worst US floods of the last 20 years? By deaths, the July 4, 2025 flash flood in the Texas Hill Country: NOAA's Storm Events Database records 124 flood deaths in Texas, 117 of them in Kerr County, more than any other US flood since 2006. By flood-insurance losses, the worst is Hurricane Harvey in 2017: the National Flood Insurance Program (NFIP) paid $9.05 billion on 92,398 claims. By total cost of a flood that was not a hurricane, it is the 2008 Midwest floods, at $15.7 billion in 2026 dollars. And by river records, the remnants of Hurricane Irene in August 2011 pushed 68 long-record USGS gauges to the highest flows they had ever measured. Floods come as flash floods, river floods and storm surge, so each ranking below states its rule.
"Last 20 years" here means January 1, 2006 to October 9, 2026, so Hurricane Katrina (August 2005) falls just outside. No single official list ranks floods, so each table uses one public source:
DisasterAWARE archive figures are labelled alerts (issued warnings) or observed gauge readings.
Ranking rule: deaths (direct and indirect) in Storm Events entries of type Flash Flood, Flood, Coastal Flood, Storm Surge/Tide and Lakeshore Flood, 2006 to June 2026, joined into floods as above. The top six are the same if entries are joined more tightly (48 hours, 300 km) or more loosely (96 hours, 800 km); places 7 to 10 change.
| # | Flood | Dates | Deaths | Where (deaths) |
|---|---|---|---|---|
| 1 | Texas Hill Country flash flood (Guadalupe River) | Jul 4–5, 2025 | 124 | Texas 124 |
| 2 | Hurricane Helene, inland flooding | Sep 26–27, 2024 | 87 | North Carolina 67, Tennessee 17, South Carolina 2 |
| 3 | Hurricane Harvey | Aug 26–29, 2017 | 73 | Texas 73 |
| 4 | Remnants of Hurricane Ida | Aug 30 – Sep 2, 2021 | 54 | New Jersey 29, New York 18, Pennsylvania 4 |
| 5 | Hurricane Sandy, storm surge | Oct 28–29, 2012 | 46 | New York 39, New Jersey 7 |
| 6 | Eastern Kentucky flash floods | Jul 27–28, 2022 | 40 | Kentucky 40 |
| 7 | Midwest and South floods | Dec 23–31, 2015 | 38 | Missouri 17, Illinois 11, Tennessee 5 |
| 8 | Tennessee floods (Nashville) | Apr 30 – May 2, 2010 | 32 | Tennessee 22, Kentucky 4, Arkansas 2 |
| 9 | Texas–Oklahoma Memorial Day floods | May 23–25, 2015 | 29 | Texas 24, Oklahoma 4, Arkansas 1 |
| 10= | Hurricane Irene | Aug 27–28, 2011 | 27 | New York 10, New Jersey 9, Vermont 3 |
| 10= | Hurricane Matthew | Oct 8–13, 2016 | 27 | North Carolina 24, South Carolina 2, Virginia 1 |
Source: NOAA NCEI Storm Events Database, 2006–2026 detail files (2026 is preliminary, through June). Dates are when entries begin, local time. Places 10 and 11 are tied.
Two things stand out. Four of the six deadliest floods came from hurricanes or their remnants, but the deaths were mostly inland, in rain-fed flash floods far from the coast: Helene's 87 were almost all in the southern Appalachians of North Carolina and Tennessee (24 in Buncombe County alone), and 51 of Ida's 54 were in New Jersey, New York and Pennsylvania, far from where it came ashore in Louisiana. And the deadliest of all was not a hurricane: on July 4, 2025, the Guadalupe River rose before dawn in Kerr County. Sandy is the exception: its 46 deaths are coastal-flood (storm surge) entries: 23 on Staten Island, the rest elsewhere in New York City, on Long Island and in New Jersey.
These counts are what NOAA's database attributes to flooding. Deaths that state and local officials count over the following months, or that Storm Events files under another event type (a hurricane, high wind), are not in them, so official tolls differ: by July 23, 2025, officials had confirmed 108 deaths in Kerr County, with two people still missing, and more than 130 across Texas.
Ranking rule: all NFIP claims with a date of loss from 2006 on, grouped by the flood event FEMA assigns, ranked by building, contents and increased-cost-of-compliance payments (dollars of the year paid, not adjusted for inflation). Claims without an event name never add up to more than $0.31 billion in any month, so no unnamed flood is missing from the top 10.
| # | Event | NFIP paid | Claims | Largest states |
|---|---|---|---|---|
| 1 | Hurricane Harvey, 2017 | $9.05 billion | 92,398 | TX $9.03B, LA $15M |
| 2 | Hurricane Sandy, 2012 | $8.94 billion | 144,848 | NJ $4.37B, NY $4.21B |
| 3 | Hurricane Helene, 2024 | $6.77 billion | 58,090 | FL $6.49B, NC $220M |
| 4 | Hurricane Ian, 2022 | $4.91 billion | 48,824 | FL $4.86B, SC $44M |
| 5 | Hurricane Ike, 2008 | $2.70 billion | 58,126 | TX $2.23B, LA $334M |
| 6 | Louisiana floods (NFIP: "Mid-summer severe storms"), 2016 | $2.53 billion | 30,019 | LA $2.53B |
| 7 | Hurricane Ida, 2021 | $1.35 billion | 28,318 | LA $692M, NJ $354M |
| 8 | Hurricane Irene, 2011 | $1.34 billion | 52,493 | NJ $598M, NY $347M |
| 9 | Hurricane Milton, 2024 | $1.21 billion | 21,675 | FL $1.21B (nearly all) |
| 10 | Hurricane Irma, 2017 | $1.11 billion | 33,340 | FL $984M, GA $65M |
Source: FEMA OpenFEMA, NFIP Redacted Claims v3 (data as of September 7, 2026). Claims counts include claims closed without payment.
Hurricanes dominate this list because storm surge and hurricane rain flood thousands of insured homes at once. Katrina, just outside the 20-year window, is still the NFIP's largest flood: $16.21 billion paid on 208,348 claims. The only non-hurricane flood in the top 10 is Louisiana's August 2016 flood, when 20 to 30 inches of rain fell over several days (31.39 inches at Watson, according to Climate Central). The NFIP took 30,019 claims and paid $2.53 billion, 84% of it in East Baton Rouge, Livingston and Ascension parishes.
Helene shows the gap. Of its $6.77 billion in NFIP payouts, $6.49 billion went to Florida's Gulf Coast counties (Pinellas County alone: $3.23 billion). North Carolina, where 67 people died in the floods in the table above, accounts for $0.22 billion on 2,028 claims.
Ranking rule: every Climate Central billion-dollar event of type "flooding" that began in 2006 or later (30 events), by total cost in 2026 dollars. Hurricanes are a separate type in this database, so their floods are not in this table; their flood-insurance losses are in the one above.
| # | Flood | Dates | Total cost, 2026 dollars | Deaths |
|---|---|---|---|---|
| 1 | Midwest floods (Iowa hardest hit) | Apr 1 – Jun 30, 2008 | $15.7 billion | 24 |
| 2 | Missouri River and North Central floods | Mar 14–31, 2019 | $14.3 billion | 3 |
| 3 | Louisiana floods (Baton Rouge) | Aug 12–15, 2016 | $14.1 billion | 13 |
| 4 | Mississippi River, Midwest and Southern floods | Mar 15 – Jul 31, 2019 | $8.1 billion | 4 |
| 5 | California atmospheric-river floods | Dec 26, 2022 – Mar 19, 2023 | $5.0 billion | 22 |
| 6 | Mississippi River floods | Apr 1 – May 31, 2011 | $4.5 billion | 7 |
| 7 | Arkansas River floods | May 20 – Jun 14, 2019 | $3.9 billion | 5 |
| 8 | Houston floods | Apr 17–18, 2016 | $3.8 billion | 8 |
| 9 | Texas and Oklahoma floods and severe weather | May 23–26, 2015 | $3.6 billion | 31 |
| 10 | Tennessee–Kentucky floods and severe weather (Nashville) | Apr 30 – May 2, 2010 | $3.5 billion | 32 |
Source: Climate Central billion-dollar disasters (read October 9, 2026). Total direct cost, insured and uninsured.
The 30 flooding events since 2006 cost $115.1 billion in 2026 dollars and killed 356 people, by Climate Central's count. Three of the seven costliest were in a single year, 2019. In March, a powerful storm sped up snowmelt and flooded the Missouri River basin, severely flooding Offutt Air Force Base in Nebraska; high water then disrupted barge traffic on the Mississippi, and from May 20 into June levee failures and persistent rain flooded the Arkansas River basin, according to Climate Central's event summaries. The newest entry is the Hawaii Kona-low floods of March 9–23, 2026: back-to-back storms with rainfall totals above 20 inches on Oahu, Kauai and the Big Island and above 40 inches locally on Maui, at $1.0 billion. The deadliest flood of the 20 years, the Texas Hill Country flood of July 2025, is not in Climate Central's list at all.
How high did the water get? This is the measured view. USGS publishes annual peak flows for 5,695 stream gauges with at least 50 years of annual peaks. At 1,048 of them, the highest flow ever measured came in 2006 or later. Ranking rule: those record peaks, joined into one flood when they came within 7 days and 400 km of each other, ranked by the number of gauges that set an all-time record.
| # | Flood | Record peaks | Gauges at all-time record | Biggest new record (peak flow) |
|---|---|---|---|---|
| 1 | Remnants of Hurricane Irene | Aug 28–29, 2011 | 68 | Schoharie Creek at Breakabeen, NY: 134,000 cfs (gage height 22.37 ft); old record 88,000 cfs (1996) |
| 2 | Midwest floods | May 30 – Jun 21, 2008 | 37 | Iowa River at Wapello, IA: 188,000 cfs (gage height 32.15 ft); old record 111,000 cfs (1993) |
| 3 | Hurricane Harvey | Aug 26 – Sep 2, 2017 | 25 | Village Creek near Kountze, TX: 182,000 cfs (gage height 35.96 ft); old record 67,200 cfs (1940) |
| 4 | Hurricane Helene | Sep 27 – Oct 2, 2024 | 21 | Nolichucky River below Nolichucky Dam, TN: 179,000 cfs (gage height 66.03 ft), a USGS estimate; old record 73,500 cfs (1906) |
| 5 | Remnants of Hurricane Ida | Sep 1–2, 2021 | 19 | Perkiomen Creek at Graterford, PA: 64,400 cfs, a USGS estimate; old record 45,600 cfs (2020) |
| 6= | Missouri–Arkansas floods | Apr 29 – May 2, 2017 | 18 | Gasconade River at Jerome, MO: 197,000 cfs (gage height 35.06 ft); old record 140,000 cfs (2015) |
| 6= | Midwest floods | Apr 18–21, 2013 | 18 | Spoon River at Seville, IL: 42,500 cfs (gage height 35.80 ft); old record 37,300 cfs (1924) |
| 8 | Hurricane Ian | Sep 29 – Oct 1, 2022 | 16 | Peace River at Arcadia, FL: 50,800 cfs (gage height 23.70 ft); old record 43,000 cfs (1912) |
Source: USGS annual peak-flow files for all states and Puerto Rico (read October 9, 2026). Peaks coded as daily averages, dam failures, minimum values or opportunistic readings are excluded. Places 6 and 7 are tied. The file holds peaks for most gauges through September 2025 but almost none since; the July 2025 peaks at Hunt and Kerrville on the Guadalupe River and the March 2026 Hawaii peaks are not in it yet.
Irene ranks first under every joining rule we tried. On August 28–29, 2011, its rain set all-time records at gauges in nine states from Maryland and Delaware to Maine. In New York's Schoharie Valley, Schoharie Creek at Breakabeen ran at 134,000 cubic feet per second (cfs), half as much again as its 1996 record. The 2008 Midwest floods come second: the Cedar River at Cedar Rapids, Iowa peaked at 140,000 cfs on June 13, 2008, nearly double its 1961 record of 73,000 cfs, with a gage height of 31.12 feet. Ranks 9 to 12 are tied at 15 record gauges each: the Louisiana–Texas floods of March 2016, the Midwest floods of September 2008 (NFIP files their Illinois claims under Hurricane Ike), the New England floods of March 2010 and high runoff at Western mountain gauges in June 2010 (likely snowmelt).
The map shows the 11 deadliest floods (dark red, at the county with the most deaths, or one of the tied counties), the 10 largest NFIP payouts (blue, at the county paid most), and 1,047 of the 1,048 USGS gauges that set an all-time record peak since 2006 (teal for the 12 floods that broke the most records, grey for the rest; one gauge has no location in the USGS site service). Click any gauge for its record flow, the old record and how long it has been measured. Orange outlines are the 82 flash flood warnings the National Weather Service issued for Texas on July 3–6, 2025 (IEM VTEC archive); a purple layer (off by default) shows the 105 record crests (NWS crest history) on DisasterAWARE flood alerts for the eight floods in the archive table below. Also off at load: NWS flash and river flood warnings for five more floods (2016–2024), NWS river crests and storm reports for 12 floods (2010–2025), USGS high-water marks (2011–2025), FEMA declared counties for 12 floods (REPORTED) and Stage IV rainfall estimates for four floods (MODELED).
What the map can show. Gauge records cover every flood that reaches a river; storm surge shows up in claims and deaths instead. The warning polygons are where the National Weather Service told people to act, not the flooded area.
DisasterAWARE's historical hazard archive holds 128,945 flood records worldwide, 85,445 of them in the US. They are alerts (warnings and advisories). Of its 60,893 US flood warning records since 2014, 59,549 (98%) also carry a flood enhancement block: the river gauges inside the warning area with their measured crests (observed readings, labelled as such), storm reports, and the matching NOAA Storm Events and FEMA claims summaries. Here is what the archive holds for the floods above since 2014:
| Flood | Archive alert records (ALERT) | Gauges at major flood stage (OBSERVED) | Gauges at a record crest | Example crest (previous record) |
|---|---|---|---|---|
| Hawaii Kona-low floods, Mar 2026 | 59 Hawaii records, Mar 8–23 | 2 | 0 | Waikane Stream at Waikane, Oahu: 11.06 ft, 4.06 ft above flood stage |
| Texas Hill Country flash flood, Jul 2025 | 72 Texas records, Jul 3–6 | 10 | 1 | Guadalupe River at Hunt: 37.52 ft, a preliminary record (36.6 ft in 1932) |
| Hurricane Helene, Sep 2024 | 102 North Carolina and 37 Tennessee records, Sep 24 – Oct 1 | 22 (NC) and 4 (TN) | 12 | Pigeon River at Newport, Tennessee: 29.57 ft (23.4 ft in 1902) |
| Eastern Kentucky floods, Jul 2022 | 20 Kentucky records, Jul 25–29 | 2 | 2 | North Fork Kentucky River at Whitesburg: 22.04 ft (14.7 ft in 1957) |
| Remnants of Ida, Sep 2021 | 25 New Jersey records, Aug 31 – Sep 2 | 38 | 17 | Raritan River at Manville: 27.66 ft (27.1 ft in 1999) |
| Missouri River floods, Mar 2019 | 81 Nebraska records, Mar 12–25 | 25 | 19 | Platte River near Ashland: 24.32 ft (23.05 ft in 1997) |
| Hurricane Harvey, Aug 2017 | 302 Texas records, Aug 24 – Sep 3 | 66 | 37 | Village Creek near Kountze: 35.96 ft (34.0 ft in 1915) |
| Louisiana floods, Aug 2016 | 82 Louisiana records, Aug 10–16 | 21 | 17 | Amite River at Denham Springs: 46.2 ft (41.5 ft in 1983) |
Counts: FLOOD records in the state starting within the dates shown; each gauge counted once. A record crest is a record or preliminary record in the NWS crest history attached to the alert. Source: DisasterAWARE Historical Hazards API, queried October 9, 2026.
The Texas Hill Country flood, in the archive. The National Weather Service's first flash flood warning for Kerr County (with Bandera County) was issued at 1:14 a.m. CDT on July 4, 2025. The Guadalupe River at Hunt crested at 37.52 feet at 5:10 a.m., a preliminary record above its 36.6 feet of July 1932, and at Kerrville it reached 37.51 feet at 6:45 a.m., 28.51 feet above flood stage and just short of the 39.0-foot record set in 1932. Downstream at Comfort, USGS measured a peak flow of 177,000 cfs, the third highest in its record, after 1978 and 1900.
Every flood, every alert, one record
DisasterAWARE Historical Event Intelligence links flood warnings to the gauges, crests and footprints behind them — event by event, since 2014.
For flood, the gap between insured and total losses is wide, and the public data shows where it opens.
What event-level data exists. For a flood portfolio, the useful record joins the hazard to the exposure: which warnings were in force where and when, which gauges crested and how high relative to flood stage and to their records, and which claims followed. NOAA, USGS and FEMA publish the pieces separately. DisasterAWARE's archive adds the alerts themselves, each with its area, gauge readings, crest-history ranks and exposed population. Historical Event Intelligence licenses that archive across every hazard for back-testing, accumulation studies and event sets. The sample datasets show the record format with no signup, and the flood data page lists what each flood record carries.
Explore the historical record
Decades of reconstructed, verified catastrophes — browse the Historical Event Intelligence overview, or request sample data for your own portfolio.
What were the worst floods in the last 20 years in the US? By deaths, the July 4, 2025 Texas Hill Country flash flood (124 deaths in NOAA's Storm Events Database). By flood-insurance payouts, Hurricane Harvey in 2017 ($9.05 billion paid by the NFIP). By total cost of a non-hurricane flood, the 2008 Midwest floods ($15.7 billion in 2026 dollars, Climate Central). By river records, the remnants of Hurricane Irene in 2011, which set all-time peak flows at 68 long-record USGS gauges.
What was the deadliest flood in US history? If storm surge counts, the Galveston hurricane of September 1900: the National Hurricane Center says storm tides of 8 to 15 feet were largely responsible for its 8,000 deaths (estimates range from 6,000 to 12,000), the deadliest weather disaster in US history. The Johnstown Flood of May 31, 1889, when the South Fork Dam failed above Johnstown, Pennsylvania, killed 2,209 people, according to the National Park Service. Since 2006, the deadliest is the July 2025 Texas Hill Country flood.
What was the costliest flood in US history? Among events Climate Central classes as flooding, the Midwest floods of June to August 1993: $49.1 billion in 2026 dollars. By flood-insurance payouts, Hurricane Katrina in 2005: $16.21 billion paid by the NFIP.
Does homeowners insurance cover floods? Usually not. FEMA's FloodSmart says most homeowners insurance does not cover flood damage; flood needs a separate NFIP or private flood policy. About 2.9% of US residential structures have NFIP cover, and since 2006, 28% of NFIP claims have come from outside the high-risk flood zone.
Sources: NOAA NCEI Storm Events Database; FEMA OpenFEMA NFIP Redacted Claims v3 and NFIP Residential Penetration Rates; Climate Central billion-dollar disasters; USGS annual peak-flow data; National Park Service (Johnstown Flood National Memorial); NOAA National Hurricane Center; FEMA FloodSmart; DisasterAWARE Historical Hazards API (queried 2026-10-09).


Decision-ready intelligence for understanding what's happening, what is impacted, and what to do next. Global hazard, severe weather, catastrophe, and physical risk intelligence trusted by governments, enterprises, insurers, humanitarian organizations, and technology platforms worldwide.
Request DemoContact Us

