


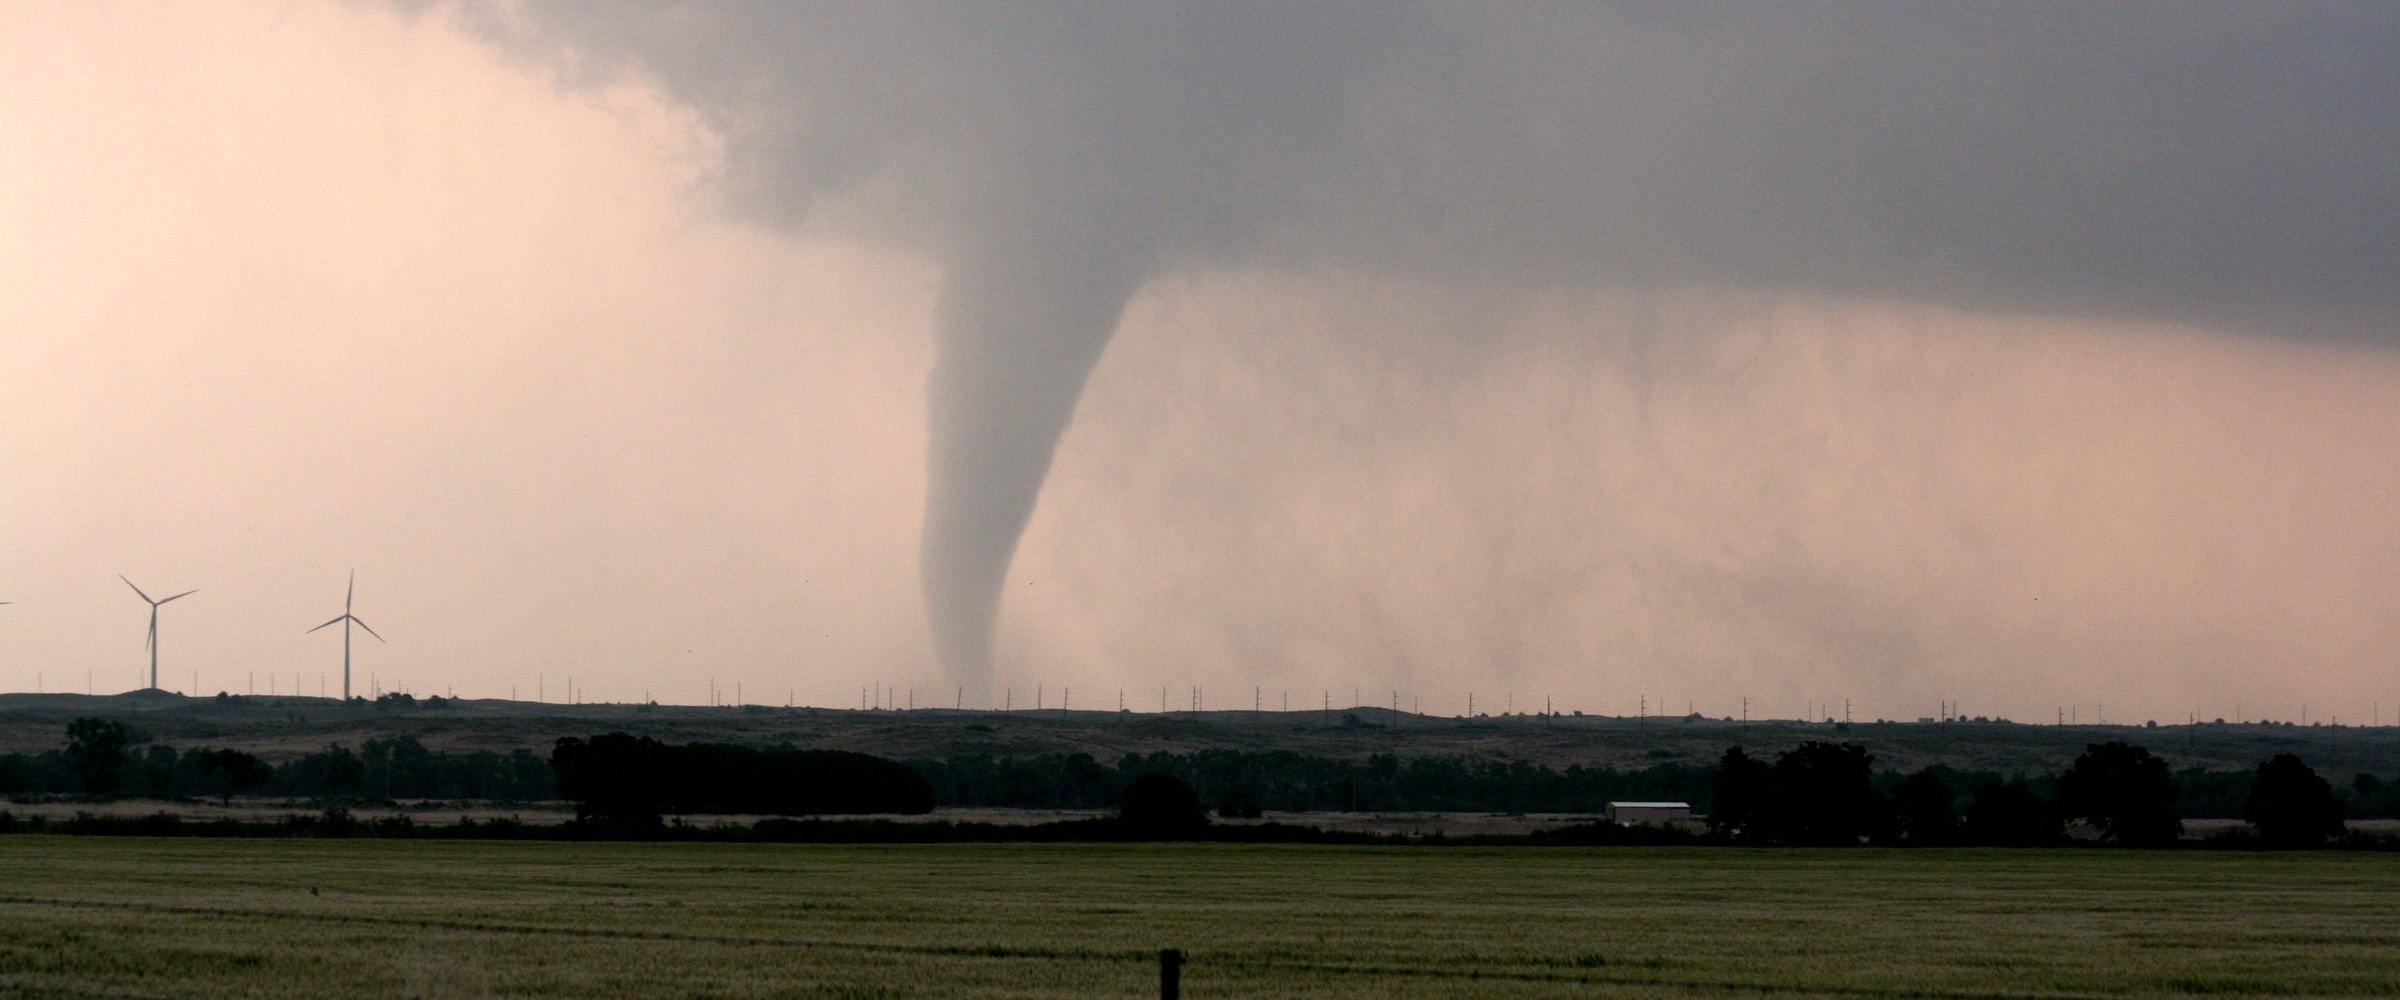
The record book for tornado outbreaks — every count is confirmed tornadoes, never warnings. Last updated: October 9, 2026.
The largest tornado outbreak in US history is the 2011 Super Outbreak of April 25–28, 2011: 355 confirmed tornadoes across 21 states in four days, 324 deaths, and 210 tornadoes on April 27 alone — the most on any single day in the official record. It is the biggest outbreak however you draw the window: one day, two, three, four or seven. The 1974 Super Outbreak (147 tornadoes, 310 deaths) held the single-day record for 37 years and still has more violent tornadoes than any outbreak since. The deadliest outbreak, though, came before modern records: the Tri-State outbreak of March 18, 1925 — its Tri-State tornado alone killed 695 people, still the deadliest tornado in US history.
And March 2026? Its two deadly outbreaks, five days apart — 32 tornadoes on March 5–7 and 109 on March 10–12 — were the year's defining severe weather, but they are not in the historical top tier: March 10–12 ranks 11th among three-day periods since 2015. (A third outbreak, March 15–16, produced 60 weaker tornadoes, none rated above EF1, and no deaths.)
A tornado outbreak is a cluster of tornadoes produced by one weather system, usually over one to three days. There is no single official threshold, so this page is explicit about every window:
The single-day record is the cleanest comparison, because it doesn't depend on where an outbreak starts and stops. These are the ten days with the most confirmed tornadoes in the SPC database since 1950 (each date runs midnight to midnight Central Standard Time):
| Rank | Date | Confirmed tornadoes | Outbreak |
|---|---|---|---|
| 1 | April 27, 2011 | 210 | 2011 Super Outbreak |
| 2 | April 3, 1974 | 128 | 1974 Super Outbreak |
| 3 | March 31, 2023 | 127 | March 31–April 1, 2023 outbreak |
| 4 | December 15, 2021 | 125 | Midwest derecho and tornado outbreak |
| 5 | May 5, 2007 | 97 | May 4–6, 2007 outbreak (Greensburg, KS) |
| 6 | June 24, 2003 | 95 | Northern Plains (Manchester, SD) |
| 7 | May 25, 2011 | 94 | May 21–26, 2011 sequence |
| 8= | April 17, 2026* | 88 | April 17–18, 2026 Upper Midwest outbreak |
| 8= | April 2, 2025 | 88 | April 2–7, 2025 outbreak and flood |
| 10 | January 21, 1999 | 86 | January 21–22, 1999 outbreak (Arkansas, Tennessee) |
*2026 is preliminary (DisasterAWARE distinct-tornado record; SPC's final 2026 database is not yet released). Four of the ten biggest tornado days have come since 2021 — partly more active weather, and partly better detection: denser radar coverage and more thorough damage surveys now confirm weak, short-lived tornadoes that would have gone uncounted decades ago. That is the main caution in comparing tornado counts across eras, and one reason 1974 remains so remarkable.
One rule for every outbreak: confirmed tornadoes in its busiest three consecutive days, out of every three-day period in the SPC database since 1950 (plus preliminary 2026). Ratings are F-scale before February 2007 and EF-scale after; deaths, ratings and states are for the same three days.
| Rank, three days and outbreak | Tornadoes | Deaths | Strongest | States |
|---|---|---|---|---|
| 1. Apr 25–27, 2011 — 2011 Super Outbreak (355 over Apr 25–28) | 315 | 324 | 4 EF5s, 11 EF4s | 20 |
| 2=. Apr 14–16, 2011 — Plains to Carolinas | 180 | 38 | EF3 | 16 |
| 2=. May 4–6, 2003 — Part of the May 2003 sequence | 180 | 40 | 5 F4s | 17 |
| 4. May 28–30, 2004 — Late-May 2004 outbreak | 174 | 5 | F4 | 16 |
| 5=. Apr 26–28, 2024 — Plains and Mid-South | 160 | 6 | 2 EF4s | 8 |
| 5=. May 23–25, 2011 — Part of the May 21–26 sequence | 160 | 18 | EF5 (El Reno–Piedmont, OK) | 18 |
| 7. Mar 31–Apr 2, 2023 — March 31–April 1, 2023 outbreak | 153 | 26 | EF4 | 17 |
| 8=. Jun 15–17, 1992 — Upper Midwest and Plains | 151 | 1 | F5 | 11 |
| 8=. Apr 2–4, 1974 — 1974 Super Outbreak (147 on Apr 3–4) | 151 | 311 | 7 F5s, 23 F4s | 13 |
| 10. May 6–8, 2024 — Part of May 6–10, 2024 | 147 | 3 | EF4 | 20 |
| Also mapped, by each outbreak's own dates (not ranked; none reaches the top ten) | ||||
| 2008 Super Tuesday, Feb 5–6, 2008 | 86 | 57 | EF4 | 10 |
| December 10–11, 2021 | 71 | 89 | EF4 (Mayfield, KY) | 10 |
| 1965 Palm Sunday, Apr 11–12, 1965 | 48 | 260 | 17 F4s | 9 |
| March 10–12, 2026* | 109 | 3 | EF3 (Kankakee, IL–Roselawn, IN) | 14 |
| March 5–7, 2026* | 32 | 8 | 2 EF3s (Union City, MI; Beggs, OK) | 7 |
Source: SPC Severe Weather Database (1950–2025). *2026 preliminary, from DisasterAWARE's de-duplicated distinct-tornado record. "=" marks a tie. Longer "outbreak sequences" chain several weather systems and are not ranked as one outbreak: May 21–26, 2011 produced 241 tornadoes in six days (including the Joplin EF5 on May 22), May 3–11, 2003 produced 365 in nine days, and May 17–29, 2019 produced 390 in thirteen. On any fixed window up to seven days, April 2011 still leads: 398 tornadoes over April 22–28, against 338 for May 4–10, 2003. Published totals differ slightly by definition: NWS and NCEI count 148 tornadoes for 1974 (including one in Ontario, Canada) and between 343 and 362 for April 25–28, 2011. We use the SPC database throughout so every row is counted the same way.
1974 — the most violent. Over April 3–4, 1974, 147 tornadoes struck 13 states — 143 of them in the 24 hours from 7 a.m. CST on April 3. Thirty were rated F4 or F5 — seven of them F5, including the tornado that devastated Xenia, Ohio. No outbreak since has matched that concentration of violent tornadoes: the 2011 Super Outbreak, with more than twice as many tornadoes, produced 15 rated EF4 or EF5.
2011 — the biggest, by every measure but violence. April 25–28, 2011 produced 355 confirmed tornadoes; 210 came on April 27, when four EF5s hit Mississippi and Alabama in a single afternoon — Smithville, Philadelphia, Hackleburg–Phil Campbell and Rainsville — and the day's toll reached 319 of the outbreak's 324 deaths. It is the largest outbreak in the record on every window we tested, from a single day to seven days.
March 2026 — big for its era, not for the record book. The two deadly March systems (March 5–7 and March 10–12) produced 141 tornadoes between them and killed 11 people, with three EF3s at the top of the scale — Union City, Michigan and Beggs, Oklahoma on March 6, and the long-tracked Kankakee, Illinois–Roselawn, Indiana tornado on March 10. A third system on March 15–16 added 60 tornadoes, none rated above EF1, and no deaths; Climate Central's billion-dollar disaster list puts that storm system's cost at $1.9 billion. March 10–12 (109 tornadoes) is the 11th-busiest three-day period since 2015. 2026's biggest single day came later: April 17, with 88 tornadoes across the Upper Midwest, tied for the eighth-busiest day on record — and no tornado deaths. Our full analysis of the March outbreaks has the day-by-day detail.
Eight outbreaks, every confirmed tornado. Switch outbreaks on and off in the layer menu to compare 1974 with 2011, or March 2026 with both; click any track for its rating, path length and casualties.
Explore the map: switch on more layers with the layers icon at the bottom right of the map: for all eight outbreaks, each tornado's touchdown time with an hourly chart, killer tornadoes, and SPC hail and wind reports; from 2008 on, SPC forecasts (the Day 1 outlook issued before each outbreak's busiest day, tornado watches and mesoscale discussions), NWS tornado-warning polygons (plus the 290 warnings of April 26–28, 2024) and radar at each outbreak's peak; damage-survey points from 2011 (zoom in); and radar-estimated hail for April 2024 and March 2026. Forecast, warning and radar archives don't reach back to 1965 or 1974.
What the map shows, by era: 1950–2025 tracks are straight lines from the SPC start point to the end point (the database stores no curved path), so they show where each tornado ran, not its exact wiggles. March 5–7 and March 10–12, 2026 tracks are the National Weather Service's surveyed damage paths where a survey was published (128 of 141 tornadoes), and straight start–end lines otherwise. Tornadoes with no recorded end point (23 in 1974, 13 in 1965 and 4 in March 2026) are shown as points only. Dates and times are Central Standard Time.
By deaths, the record reaches back before modern records. Because tornado records before 1950 are incomplete, this section comes in two parts: a complete ranking from 1950, and the deadliest earlier outbreaks the National Weather Service documents.
Since 1950, ranked. Deaths from every tornado on each outbreak's dates, in the SPC database. To find the candidates we scanned every one-to-four-day period since 1950, so this is the complete top ten.
| Rank | Outbreak | Deaths | Notes | States |
|---|---|---|---|---|
| 1 | 2011 Super Outbreak, Apr 25–28, 2011 | 324 | NOAA's billion-dollar disaster entry lists 321 | 21 |
| 2 | 1974 Super Outbreak, Apr 3–4, 1974 | 310 | NWS Indianapolis puts the toll from tornadoes and severe thunderstorms at 335; NCEI cites 335 direct fatalities | 13 |
| 3 | Palm Sunday, Apr 11–12, 1965 | 260 | NWS Indianapolis and Chicago publish 271 | 9 |
| 4 | Flint–Worcester, Jun 8–9, 1953 | 236 | Flint, MI (116) and Worcester, MA (90) tornadoes | 5 |
| 5 | Arkansas–Tennessee, Mar 21–22, 1952 | 209 | 6 | |
| 6 | Joplin outbreak, May 21–24, 2011 | 178 | Joplin, MO tornado 158; part of the May 21–26 sequence | 18 |
| 7 | Waco–San Angelo, May 10–11, 1953 | 139 | 9 | |
| 8 | Mississippi Delta, Feb 21–22, 1971 | 123 | 9 | |
| 9 | Udall–Blackwell, May 24–25, 1955 | 105 | 4 | |
| 10 | December 10–11, 2021 | 89 | Mayfield, KY EF4 | 10 |
The next-deadliest since 1950 is May 30–31, 1985, with 78 deaths. A wider four-day window adds a few deaths from adjacent days in some cases (1965: 266; Flint–Worcester: 247; Waco: 144) without changing the order.
Before 1950: documented, not ranked. The deadliest outbreaks with NWS- or NOAA-published death tolls, largest first:
| Outbreak | Deaths | Source and notes | Where |
|---|---|---|---|
| Tri-State outbreak, Mar 18, 1925 | 695+ | 695 killed by the Tri-State tornado alone (NWS Paducah), the deadliest US tornado; other tornadoes that day add more, and no official outbreak total exists | MO, IL, IN, plus TN, KY |
| Tupelo–Gainesville, Apr 5–6, 1936 | 454 | NOAA NCEI; Tupelo, MS (216) and Gainesville, GA (203) | AR, TN, MS, AL, GA |
| Dixie outbreak, Apr 23–26, 1908 | 320+ | NWS Birmingham: at least 34 tornadoes, "at least 320" killed | Mainly east of the Mississippi |
| Deep South outbreak, Mar 21, 1932 | 300+ | NWS Birmingham: "more than 300" killed; 268 in Alabama alone | Centered on Alabama |
| St. Louis outbreak, May 27, 1896 | 279+ | NWS St. Louis: 255 killed by the St. Louis–East St. Louis tornado; a second F4 that evening killed at least 24 in St. Clair and Clinton counties, Illinois | MO, IL |
The Tri-State tornado alone killed more people than the full toll of any other outbreak on either list, which is why 1925 ranks as the deadliest outbreak. The pre-1950 list is not a complete ranking: many outbreaks of that era have no official total. The April 20, 1920 outbreak, for one, began in Mississippi and killed 92 people in Alabama alone (NWS Birmingham), but no NWS total exists for the whole outbreak. The Natchez, Mississippi tornado of 1840 (317 deaths) was a single tornado, not an outbreak.
Every tornado, every outbreak, one record
DisasterAWARE Historical Event Intelligence connects NWS warnings, damage surveys, and exposure into event-level records — queryable by place, date, and severity.
Since 2015, the same three-day rule ranks every period from January 2015 to September 2026, counted in DisasterAWARE's de-duplicated distinct-tornado record (2026 is preliminary, marked *). Beside each, the number of tornado warnings the National Weather Service issued in those three days, counted from the Iowa Environmental Mesonet's archive of NWS warnings:
| Rank | Three days | Confirmed tornadoes (observed) | Deaths | NWS tornado warnings issued (alert) |
|---|---|---|---|---|
| 1 | April 26–28, 2024 | 161 | 6 | 290 |
| 2 | March 31–April 2, 2023 | 153 | 26 | 238 |
| 3 | May 6–8, 2024 | 147 | 3 | 286 |
| 4 | April 12–14, 2020 | 141 | 30 | 173 |
| 5 | May 24–26, 2024 | 133 | 15 | 240 |
| 11 | March 10–12, 2026* | 109 | 3 | 138 |
Source: tornadoes and deaths, DisasterAWARE distinct-tornado record (2015–September 2026; NWS damage surveys plus NCEI/SPC reports, de-duplicated), so 2015–2025 counts here can differ by a tornado or two from the SPC database used in the all-time tables above; warnings, Iowa Environmental Mesonet archive of NWS tornado warnings (unique warnings issued, queried October 9, 2026). *2026 preliminary.
Two things this table makes visible. First, warnings and tornadoes are different numbers: a warning is an alert issued for a storm, a tornado is what the damage survey later confirms. In every window here, NWS issued more tornado warnings than tornadoes were confirmed — 290 warnings for 161 tornadoes on April 26–28, 2024. (DisasterAWARE's Historical Hazards archive holds these warnings as alert records; its record counts reflect how alerts are grouped and ingested, so they are not a count of warnings issued.) Second, the deadliest recent outbreaks are not the biggest: the December 10–11, 2021 outbreak, with 89 deaths, does not reach this list by count.
The April 2011 outbreak is the benchmark loss for the peril. On the Insurance Information Institute's list of the costliest US catastrophes involving tornadoes, the April 22–28, 2011 outbreak cost insurers $7.56 billion at the time ($10.9 billion in 2025 dollars). Adjusted for inflation — the list ranks events in 2025 dollars — that makes it the costliest tornado outbreak on the list: only the August 2020 Midwest derecho, a straight-line windstorm, ranks higher. The total cost of April 25–28 — insured and uninsured — was $10.2 billion at the time, or $15.1 billion in 2026 dollars, in the billion-dollar disaster database NOAA kept through 2024 and Climate Central now maintains. The season around it set the record: Munich Re put 2011's US severe-storm losses at $46 billion, $25 billion of it insured, twice the previous record year.
| Outbreak | Insured loss | Total cost | Source |
|---|---|---|---|
| April 22–28, 2011 | $7.56B at the time ($10.9B in 2025 dollars) | $15.1B (2026 dollars), April 25–28 | III (Aon); Climate Central |
| December 10–11, 2021 | about $4B (projected) | $4.7B (2026 dollars) | Munich Re; Climate Central |
| February 5–6, 2008 | — | $1.9B (2026 dollars) | Climate Central |
| April 3–4, 1974 | — | about $600M at the time; about $5.3B in 2024 dollars | NWS; NOAA NCEI |
Three things an outbreak does to a portfolio that a single tornado does not:
The data that answers those questions is event-level and geographic: every confirmed tornado's track, rating, timing and casualties, joined to the warnings that preceded it. That is what the map above draws for eight outbreaks. DisasterAWARE's Historical Event Intelligence delivers it for any portfolio: tornado tracks, warning footprints, hail and wind evidence, and exposure, queryable by location and date, with sample datasets available on request.
Explore the historical record
Decades of reconstructed, verified catastrophes — browse the Historical Event Intelligence overview, or request sample data for your own portfolio.
What was the largest tornado outbreak in US history? The 2011 Super Outbreak, April 25–28, 2011: 355 confirmed tornadoes across 21 states, with 324 deaths. It is the largest on every window, from one day to a week.
What is the record for the most tornadoes in one day? 210 confirmed tornadoes on April 27, 2011 (SPC database, midnight to midnight Central Standard Time). The next-highest day is April 3, 1974, with 128.
What was the deadliest tornado outbreak in US history? The Tri-State outbreak of March 18, 1925. Its Tri-State tornado alone killed 695 people across Missouri, Illinois and Indiana. That is more than the full toll of any other outbreak on record here; the next is the Tupelo–Gainesville outbreak of April 5–6, 1936 (454 deaths). Since modern records began in 1950, the deadliest is the 2011 Super Outbreak, with 324 deaths in the SPC database.
What was the costliest tornado outbreak in US history? By inflation-adjusted insured loss, the April 22–28, 2011 outbreak: $7.56 billion at the time, or $10.9 billion in 2025 dollars (Insurance Information Institute, using Aon data). Its total cost for April 25–28 was $15.1 billion in 2026 dollars.
How big was the March 2026 tornado outbreak? Two deadly outbreaks, five days apart: 32 confirmed tornadoes on March 5–7 and 109 on March 10–12 (preliminary), 11 deaths in all, and nothing stronger than EF3. A third outbreak on March 15–16 added 60 more, none rated above EF1, and no deaths. Large for a March, but well outside the historical top ten.
Sources: NOAA Storm Prediction Center Severe Weather Database (1950–2025 tornadoes, accessed October 9, 2026); NWS Damage Assessment Toolkit; NOAA NCEI Storm Events Database; NWS Paducah, Birmingham, Indianapolis, Chicago, St. Louis and Wilmington event pages; Iowa Environmental Mesonet (NWS tornado warnings, VTEC archive); NOAA NCEI (1974 and 2011 outbreak summaries; Billion-Dollar Disasters 1980–2024); Climate Central U.S. Billion-Dollar Disasters database; Insurance Information Institute (Aon-defined insured losses); Munich Re NatCat releases (2011, 2012, 2022); Aon catastrophe reports (2024); DisasterAWARE distinct-tornado record (2015–September 2026) and Historical Hazards archive (queried October 9, 2026).




Decision-ready intelligence for understanding what's happening, what is impacted, and what to do next. Global hazard, severe weather, catastrophe, and physical risk intelligence trusted by governments, enterprises, insurers, humanitarian organizations, and technology platforms worldwide.
Request DemoContact Us

