


DisasterAWARE's historical hazard archive holds nearly 680,000 records across about 30 hazard types, from earthquakes and floods to wildfires, tornadoes and tropical cyclones. Every record carries the basics: what happened, where, when, how severe the alert was and, for most, the alert footprint. For the hazards where authoritative post-event data exists, records also carry an enhancement: the surveys, gauges, radar, claims and agency records that describe what actually happened on the ground.
This guide walks through those enhancements one hazard at a time: what each one contains, which source it comes from, where in the world it applies, and how far back it goes. The short version: tornado, hail, wind and flood enhancements come from US agency data and apply to the United States; earthquake and tropical cyclone enhancements come from global catalogs and apply worldwide; wildfire burned-area detail is almost entirely US, while every wildfire record worldwide states what kind of evidence it rests on.
A hazard record starts life as an alert: a National Weather Service warning, a USGS earthquake notice, a satellite fire detection, a tropical cyclone advisory. Enhancement adds structured blocks of evidence to that record after the event. Each block is attached to the record it describes, so a single tornado warning can carry its damage survey, its hail and wind reports and its storm classification together.
Three conventions hold across every enhancement:
Coverage: United States. Tornado records from 2014; damage-survey evidence mainly from 2017 onward.
The archive holds about 22,500 tornado records, and 98% of them carry the tornado enhancement. These are warning-grain records, mostly NWS tornado warnings and the confirmed touchdowns under them, so one tornado can appear on several records; they are not a list of distinct tornadoes. Each enhanced record carries:
Example: the warning records for the Greenfield, Iowa tornado of May 21, 2024 carry the NWS survey path for the EF4: 43 miles long, up to 1,600 yards wide, surveyors' estimated peak wind 180 mph, 5 deaths and 35 injuries. The same path is listed on each warning it touched, and one record owns it for counting.
Coverage: United States. Radar hail swaths from late 2019; storm reports and warnings across the enhanced years.
Severe thunderstorm records (more than 98,000 storm records in all) and tornado records share three enhancement blocks, carried by nearly 64,000 storm records and almost every tornado record:
Where radar or reports from the US network are used on an event just across the border, the record flags it as US-network evidence. Thousands of US marine warning records carry the same hail and wind blocks.
Example: a severe thunderstorm record in southeastern Colorado on September 20, 2026 (local time) carries a measured 4.0-inch (softball-size) hail report near Chivington, measured 3.1-inch hail near Brandon, eight radar swath polygons at thresholds from 1 to 2 inches, and the warning that covered them.
Coverage: the United States and its territories. Flood enhancement from late 2007.
About 84,800 of the archive's nearly 129,000 flood records carry the flood enhancement, more than 98% of them in the United States, and almost all the rest in US territories such as Puerto Rico. US flood records begin as NWS flood products (flash flood, areal, river and coastal warnings), so the enhancement adds what was measured and reported on the ground:
Outside the United States and its territories, flood records carry this enhancement only where a US flood alert reaches across the border; many carry a modeled exposure assessment instead (see below). The geometry on a flood record is the alert area, not a mapped flood extent.
Example: a flash flood warning for Alleghany, Ashe, Watauga and Wilkes counties, North Carolina, during Hurricane Helene in September 2024 carries five river gauges, two of them at Major flood (the Watauga River near Sugar Grove crested 23.6 feet above flood stage), a USGS high-water mark showing 3.75 feet of water above ground, a modeled depth of 5.5 feet, three road closures and 322 NFIP flood insurance claims.
Every hazard record, with its evidence attached
DisasterAWARE Historical Event Intelligence delivers the archive by API and bulk extract, with each enhancement labelled by source and coverage.
Coverage: worldwide, every basin. Enhancement from the 1998 season.
Nearly 2,000 of the archive's roughly 3,000 tropical cyclone records are enhanced from IBTrACS v04r01 (NOAA/NCEI), the international best-track archive. An enhanced storm carries:
Example: Hurricane Helene (2024) carries its 45-point track, a Category 4 peak of 120 knots and 939 mb, its landfall in Florida at 120 knots, and the NWS post-storm reports from 12 forecast offices, including 30.78 inches of rain at Busick, North Carolina, and storm tide 9.3 feet above high tide at Cedar Key, Florida.
Coverage: worldwide. Records from 1999.
The archive holds about 74,000 earthquake records worldwide. More than 12,700 of them, the events USGS processed with ShakeMap (95% of them magnitude 4.5 or above), carry the earthquake enhancement:
Example: the magnitude 7.8 earthquake north of Ende, Flores, Indonesia, in August 2026 carries its ShakeMap (maximum intensity 8.6, acceleration contours up to 0.5 g across 11 levels), PAGER alert orange, and NCEI's record of 156 deaths, 1,620 injuries and 5,099 houses destroyed.
Coverage: every wildfire record worldwide states its evidence basis; burned area and fire detail are almost entirely United States, from 1999.
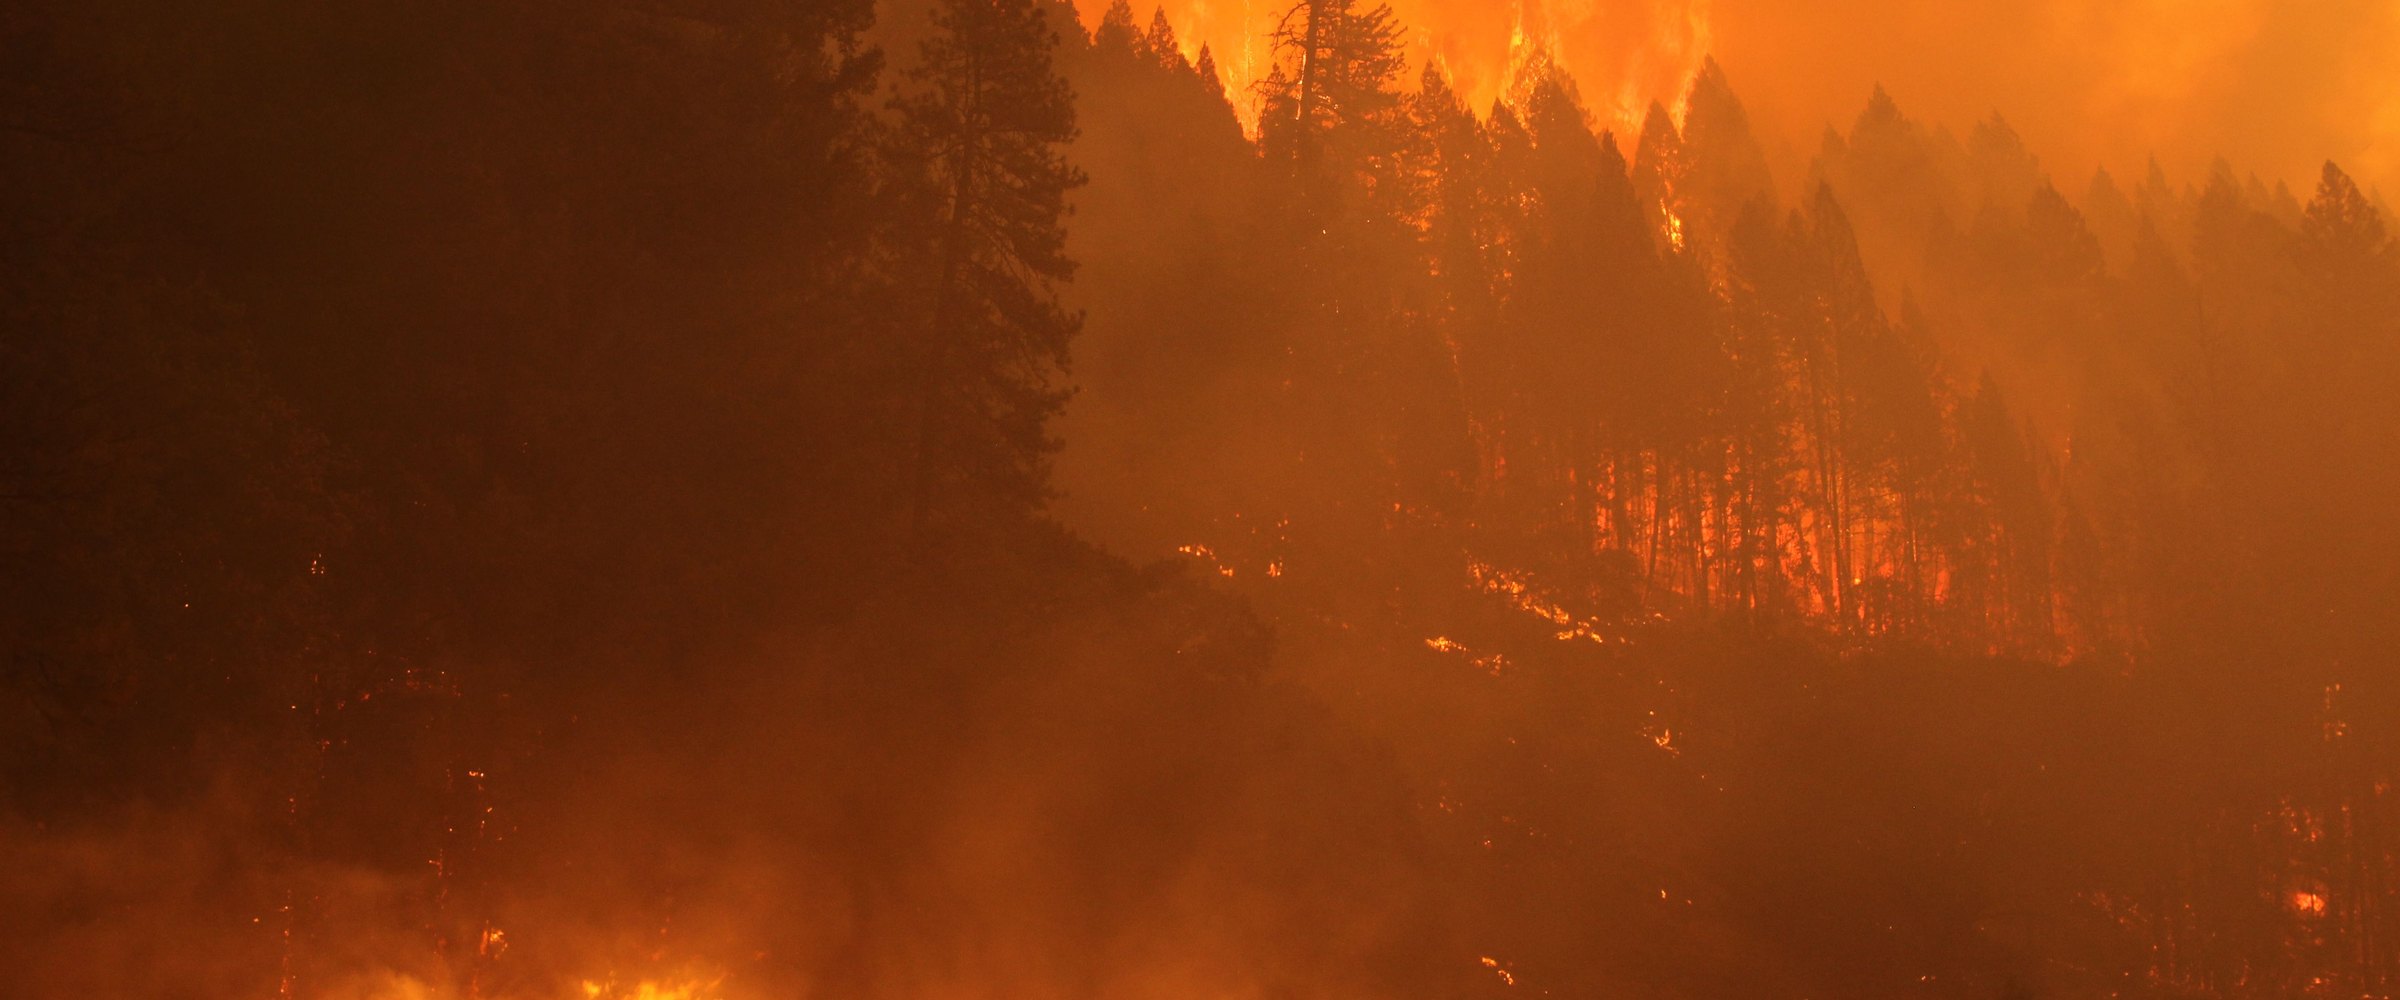
The archive holds nearly 130,000 wildfire records, and every one says what it is based on: an agency-confirmed fire incident, a satellite heat detection, a satellite burned-area product, an unconfirmed report, a prescribed burn, or a product that is not a fire at all (such as fire-weather alerts). Confirmed incidents and satellite detections make up the great majority. That matters, because a satellite detection is a potential fire, not a confirmed one.
More than 75,000 wildfire records, almost all of them US fires since 1999, carry the fire enhancement, joined to the US interagency fire record (NIFC/WFIGS and its predecessors). Depending on what the agencies reported for each fire, a record carries:
Example: the 2026 Wildhorse fire in Idaho carries a final size of 107,563 acres from its mapped perimeter, dated perimeters through its growth (largest one-day growth 16,623 acres), 1,135 satellite detections, and 27 linked smoke events over 15 days, with air quality reaching Very Unhealthy on preliminary AirNow readings.
Coverage: North America (mainly the United States, Canada and Mexico). From 2008.
The archive holds nearly 35,000 smoke events. Each one is built from daily NOAA Hazard Mapping System satellite smoke outlines. Each carries its smoke density and dates, and, where available:
Many records across hazard types, worldwide, carry a modeled exposure assessment: estimated population, households, schools, hospitals and capital value inside the alert footprint. It is an estimate of what lay inside the alert area, not a count of observed impact, and a large precautionary warning yields a large figure.
Landslide, volcano, tsunami, winter storm, extreme temperature and drought records carry the core record and, where modeled, exposure, but no hazard-specific enhancement.
| Hazard | Enhancement | Main sources | Where | From |
|---|---|---|---|---|
| Tornado | Damage-survey paths and points, Storm Events, storm reports, path length | NWS Damage Assessment Toolkit, NOAA Storm Events, NWS, SPC | US | 2014 (surveys mainly 2017+) |
| Hail | Reports, radar hail swaths, best size estimate | NWS and SPC reports, NOAA MRMS MESH | US | Radar from late 2019 |
| Wind | Gusts, damage reports, survey wind points | NWS and SPC reports, NWS damage surveys | US | Enhanced years |
| Severe storm | Observed hail, wind and tornado classification | Derived from the blocks above | US | Enhanced years |
| Flood | Gauges, alert history, reports, measured and modeled depth, tides, Storm Events, flood insurance claims | USGS, NWS, NOAA, FEMA | US and territories | Late 2007 |
| Tropical cyclone | Best track, wind radii, landfalls, station reports | IBTrACS (NOAA/NCEI), NWS post-storm reports | Worldwide (station reports US and territories) | 1998 season (station reports 2023+) |
| Earthquake | ShakeMap, USGS event, NCEI impacts, PAGER level | USGS, NOAA NCEI | Worldwide | 1999 |
| Wildfire | Evidence basis | Agency and satellite sources | Worldwide | All records |
| Wildfire | Burned size, perimeters, timeline, incident reports, satellite detections, smoke links | NIFC/WFIGS and interagency records, ICS-209, NASA FIRMS | Almost entirely US | 1999 |
| Smoke | Daily smoke outlines, ground air quality, source fires | NOAA HMS, EPA AirNow (preliminary) | North America | 2008 |
| All types | Modeled exposure | DisasterAWARE exposure model | Worldwide, where modeled | Varies |
The archive is served through the Historical Hazards API: filter by hazard type, date, country, state, county, radius or containment test, and by enhancement values such as EF rating, hail size, gauge category, landfall country, magnitude, intensity or final acres. Records come back as full records with every enhancement block or as a compact list for analysis. See the API documentation for every parameter and field.
Licensed extracts are available through Historical Event Intelligence, and the same archive can feed AI agents and analytics platforms through AI & Analytics Intelligence. Free sample datasets for tornado, hail, tropical cyclone and earthquake are on the sample datasets page, and each hazard's data page has field-level detail: tornado, severe convective storm, flood, hurricane, earthquake and wildfire.
Explore the historical record
Decades of reconstructed, verified catastrophes — browse the Historical Event Intelligence overview, or request sample data for your own portfolio.
What does "enhanced" mean in DisasterAWARE's historical hazard data?
An enhanced record carries structured post-event evidence on top of the original alert: damage surveys and storm reports for tornadoes, radar hail swaths and reports for hail, river gauges, high-water marks and flood insurance claims for floods, best tracks and landfalls for tropical cyclones, ShakeMap and impact records for earthquakes, and burned size, perimeters and incident reports for wildfires. Each block names its sources and whether they had data.
Is the enhanced data global?
It depends on the hazard. Earthquake and tropical cyclone enhancements come from global catalogs (USGS, NOAA NCEI, IBTrACS) and apply worldwide. Tornado, hail, wind and flood enhancements come from US agency data and apply to the United States (flood also covers US territories). Wildfire burned-area detail is almost entirely US, while every wildfire record worldwide states its evidence basis. Smoke covers North America.
How far back does the historical hazard data go?
Earthquake records run from 1999, tropical cyclone enhancement from the 1998 season, wildfire burned-area detail from 1999, flood enhancement from late 2007, smoke from 2008, and tornado records from 2014, with NWS damage-survey evidence mainly from 2017 onward and radar hail swaths from late 2019.
Are the tornado records a count of tornadoes?
No. Tornado records are warning-grain: mostly NWS tornado warnings and the confirmed touchdowns under them, so one tornado can appear on several records. Each record carries the survey paths and reports that touch it, and exactly one record owns each piece of evidence, so totals summed across records count each path and report once.
Does the flood data include flood depth?
Yes, labelled by method. Measured depth comes from USGS high-water marks and storm-tide sensors as height above ground; modeled depth comes from NWS inundation mapping libraries at river gauges and is always marked as modeled. The geometry on a flood record is the alert area, not a mapped flood extent.
How do I get the data?
Through the Historical Hazards API, or as licensed extracts through Historical Event Intelligence. Free samples for tornado, hail, tropical cyclone and earthquake are on the sample datasets page.
Sources: DisasterAWARE Historical Hazards API, queried 2026-10-14; DisasterAWARE Historical Hazards API documentation. Enhancement sources as named in each section: NWS (Damage Assessment Toolkit, Local Storm Reports, warnings, post-storm reports, inundation mapping), NOAA Storm Prediction Center, NOAA NCEI (Storm Events, Significant Earthquake Database, IBTrACS v04r01), NOAA MRMS, NOAA Hazard Mapping System, NOAA tide gauges, USGS (gauges, high-water marks, ShakeMap, PAGER), FEMA (NFIP claims, Individual Assistance), NIFC/WFIGS and the US interagency fire record, ICS-209 incident reports, NASA FIRMS, EPA AirNow and its partner federal, state, local and tribal air quality agencies (preliminary monitor data). This product uses the Federal Emergency Management Agency's OpenFEMA API, but is not endorsed by FEMA.



Decision-ready intelligence for understanding what's happening, what is impacted, and what to do next. Global hazard, severe weather, catastrophe, and physical risk intelligence trusted by governments, enterprises, insurers, humanitarian organizations, and technology platforms worldwide.
Request DemoContact Us

